Total Volume Profile
- 지표
- Shahabeddin Baset
- 버전: 1.1
- 업데이트됨: 17 12월 2024
- 활성화: 15
Includes almost all the concepts related to Volume Profile: POC, Value Area, Developing POC, Anchored VWAP, Volume Delta; since the “Total” in its name. It is fast in its calculations and simple to work with.
1. Selectable calculation timeframe to find most traded levels.
2. Capable of calculating Volume Profile based on tick data
3. Adjustable histogram bars by their count.
4. Adjustable histogram bars by their height (price range).
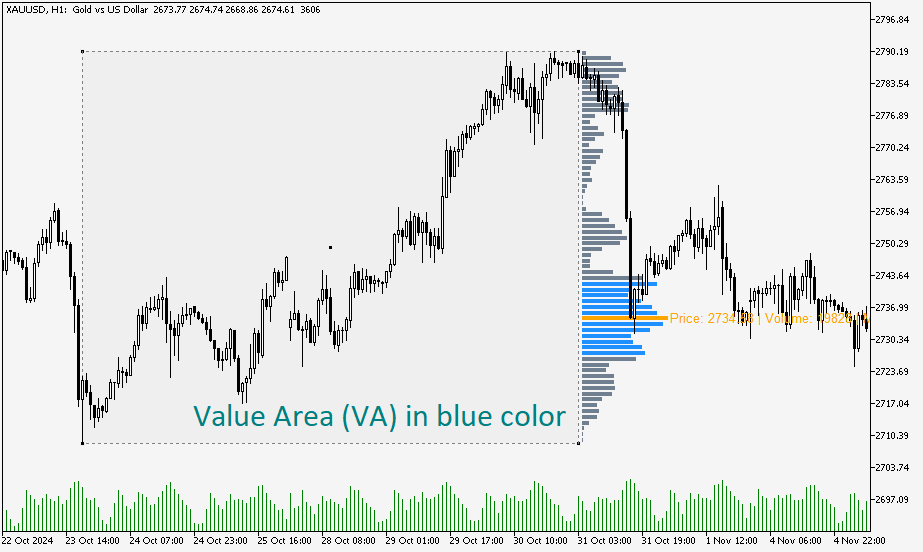
5. Showing Value Area (VA)
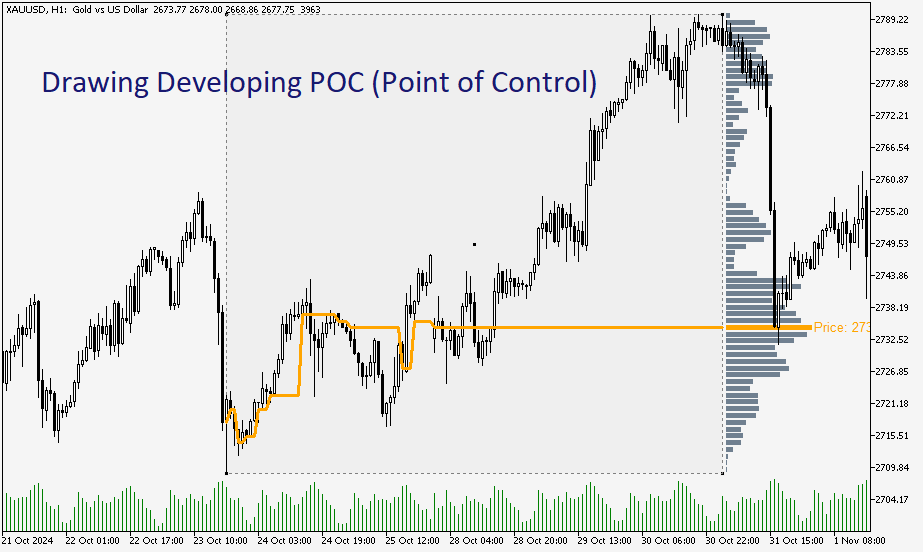
6. Drawing Developing Point of Control (POC)
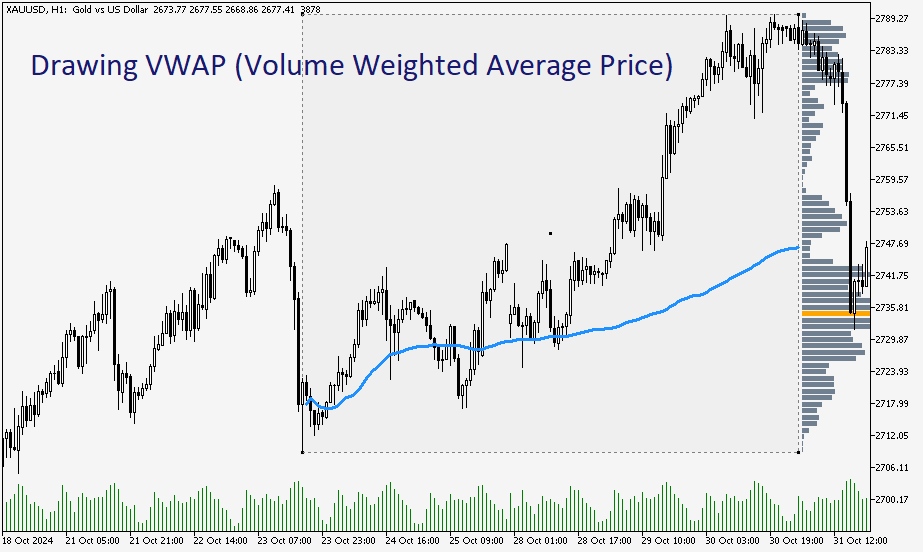
7. Drawing an Anchored VWAP.
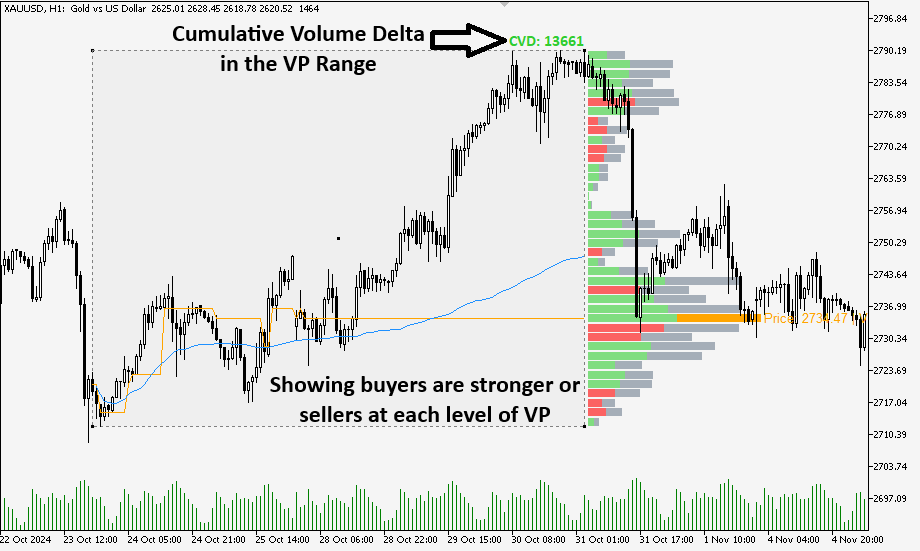
8. Showing the levels where buy pressure were stronger than sell pressure, and vice versa.
9. Displaying the volume traded at each level of Volume Profile.
10. Adjustable Transparency for histogram bars to avoid distracting.
11. Capable of being applied multiple times on chart to find different important levels at any given time range (especially useful for sessions).
12. Showing the volume delta (CVD) of the selected range at the top right of the rectangle.
13. Simple to set on chart and fast in calculation.
I think this indicator covers almost all concepts related to Volume Profile trading strategies, but am ready to hear and, if possible, implement any other concept that you think is missing, and you kindly write it here for me to improve the indicator.
Features:
1. Selectable calculation timeframe to find most traded levels. 2. Capable of calculating Volume Profile based on tick data
3. Adjustable histogram bars by their count.
4. Adjustable histogram bars by their height (price range).
5. Showing Value Area (VA)
6. Drawing Developing Point of Control (POC)
7. Drawing an Anchored VWAP.
8. Showing the levels where buy pressure were stronger than sell pressure, and vice versa.
9. Displaying the volume traded at each level of Volume Profile.
10. Adjustable Transparency for histogram bars to avoid distracting.
11. Capable of being applied multiple times on chart to find different important levels at any given time range (especially useful for sessions).
12. Showing the volume delta (CVD) of the selected range at the top right of the rectangle.
13. Simple to set on chart and fast in calculation.
How to use:
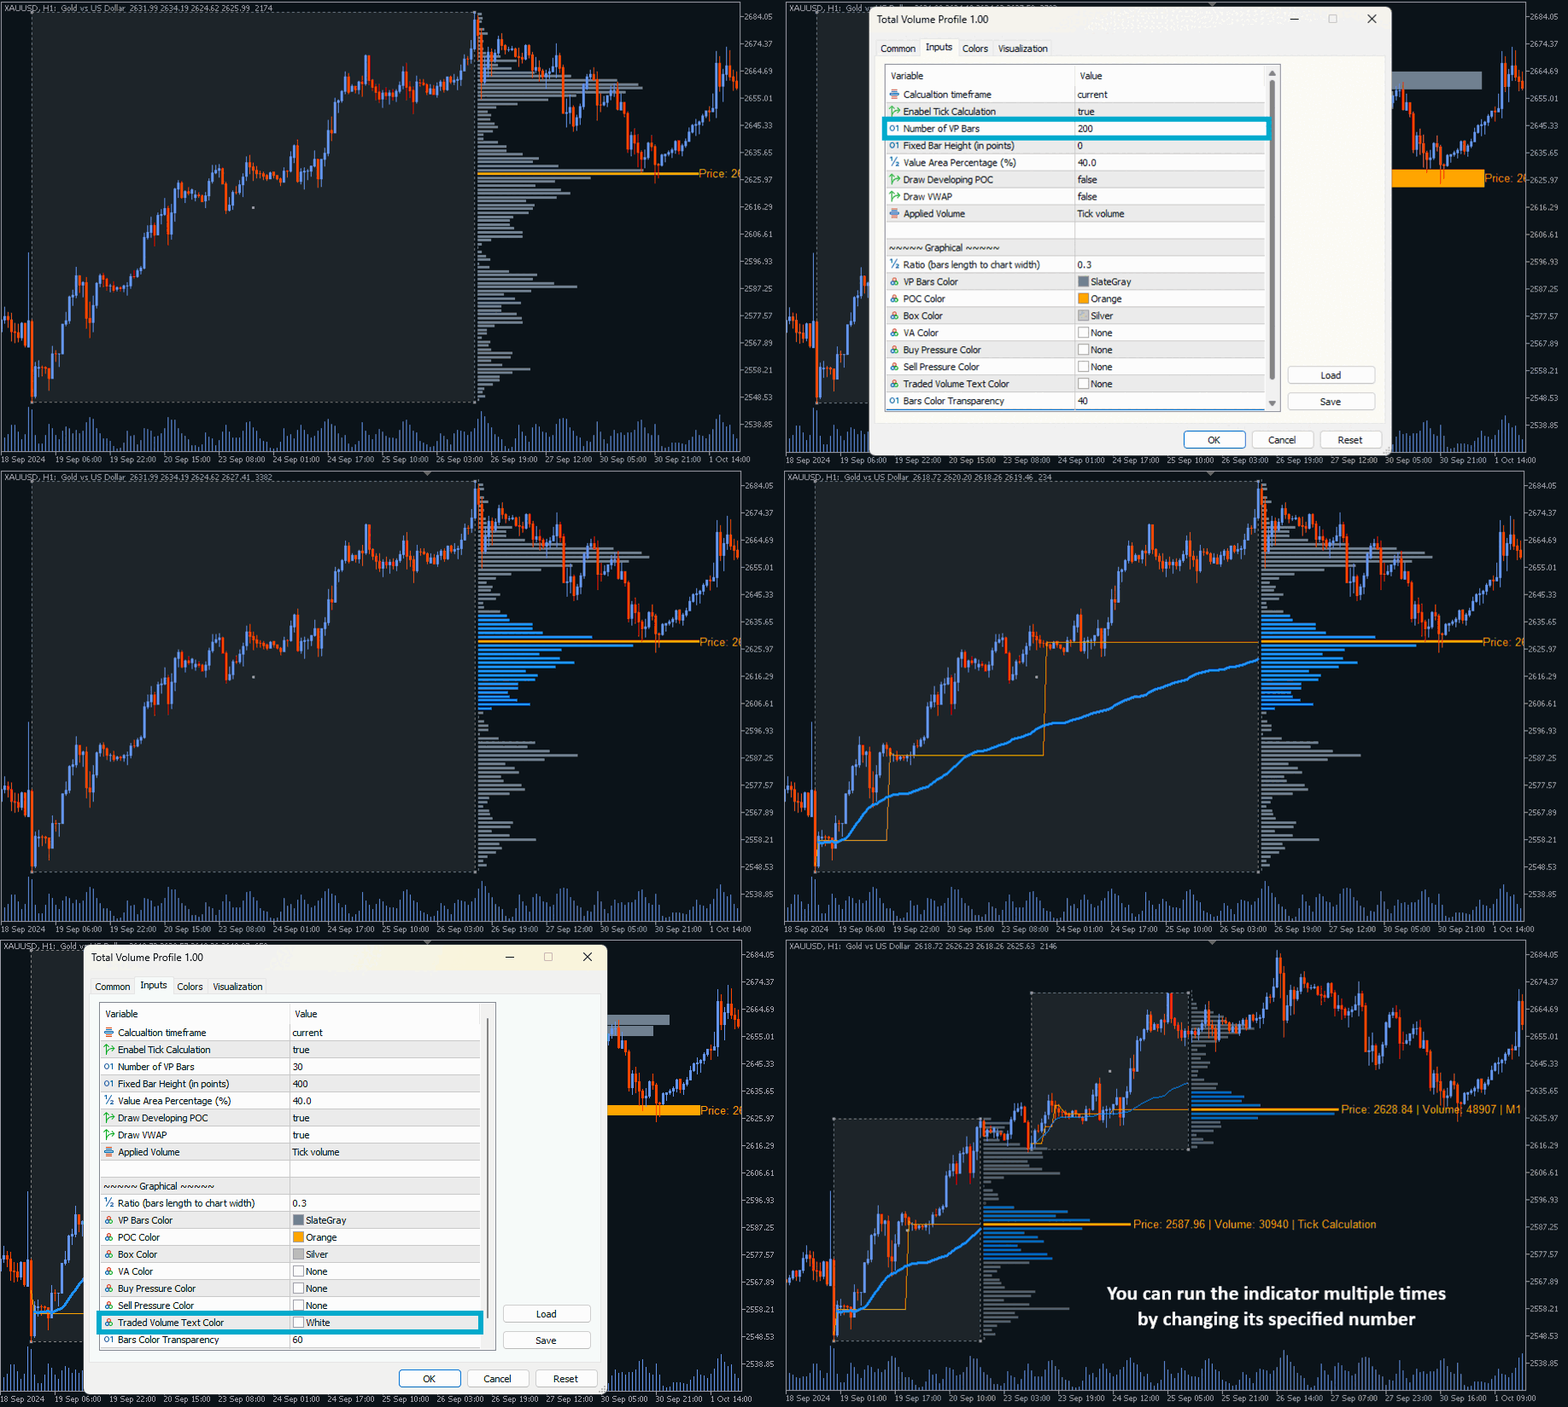
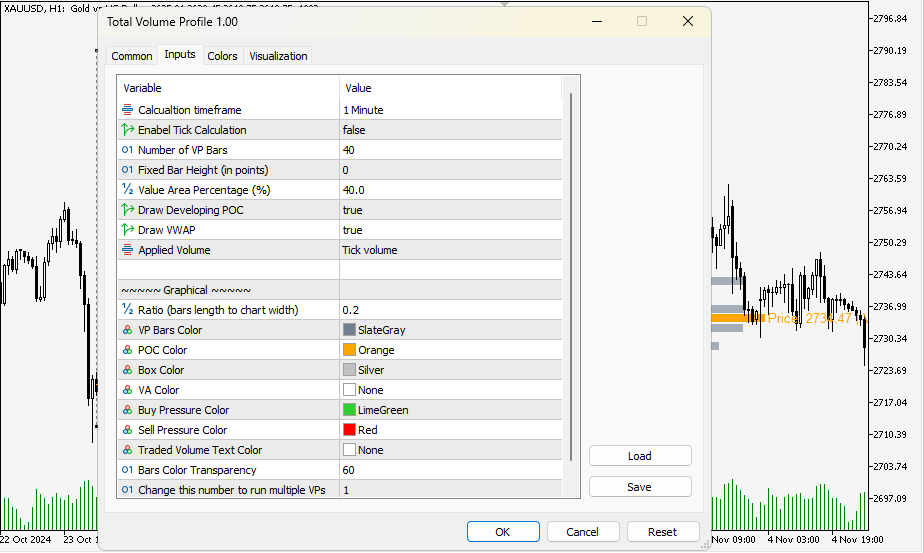
- After downloading and installing the indicator, run it on a chart, a rectangle will be appeared on the most recent candles. By moving your mouse, the Volume Profile of this default area will be drawn one candle after the end of the rectangle. Move the rectangle, from its middle point or its right/left edges, to the place where you want to see its Volume Profile. The indicator should instantly draw VP. If “tick calculation” is enabled, it may take some time to download the necessary tick data. Generally, the fastest calculation will be done when “calculation timeframe” is set to “current”, going deep into lower timeframes for calculation may take some time before drawing VP bars.
- Every VP bar covers a range of price. If you want this price range to be fixed, set “Fiexed Bar Height” parameter to your desired value (in points). Otherwise, you can set the indicator to show you a fixed number of bars wherever you apply the indicator. In this case, set the “Fiexed Bar Height” parameter to zero, and the “Number of VP Bars” parameter to your desired number.
- You can set Value Area Percentage, or when you don’t need it, you can set its color parameter (“VA color”) to NONE.
- You can enable/disable Developing POC and Anchored VWAP.
- To set the length of VP bars, there is a “Ratio” parameter in the input, that is in fact the ratio of POC length (the longest VP bar) to the chart width.
- If you are not satisfied with visual presentation of volume traded at each level through VP bars, you can set a color for “Traded Volume Text Color” parameter to see the actual number of traded volume at each VP bar (indicator will not, and cannot, show these numbers when VP bar height is too small).
- If you are interested in “Sessions Volume Profile,” which needs VP to be applied multiple times on the chart, just set different numbers for the last parameter of the input in every new running of the indicator, and you will be able to run as many VP on the chart as you wish.
- Set the “Bars Color Transparency” parameter to lower numbers (between 50-0) if you are more interested to see the price candles, not VP bars, and to higher numbers (between 50-100) if you want to see VP bars more clearly.
- When you set a color for “Buy Pressure” parameter, every VP bar that in its price range the buyers were stronger than sellers will be shown with that color, and the same goes for “Sell Pressure” parameter.
I think this indicator covers almost all concepts related to Volume Profile trading strategies, but am ready to hear and, if possible, implement any other concept that you think is missing, and you kindly write it here for me to improve the indicator.

