• 미리보기
  • 리뷰
  • 코멘트

AVP Market Sentiment

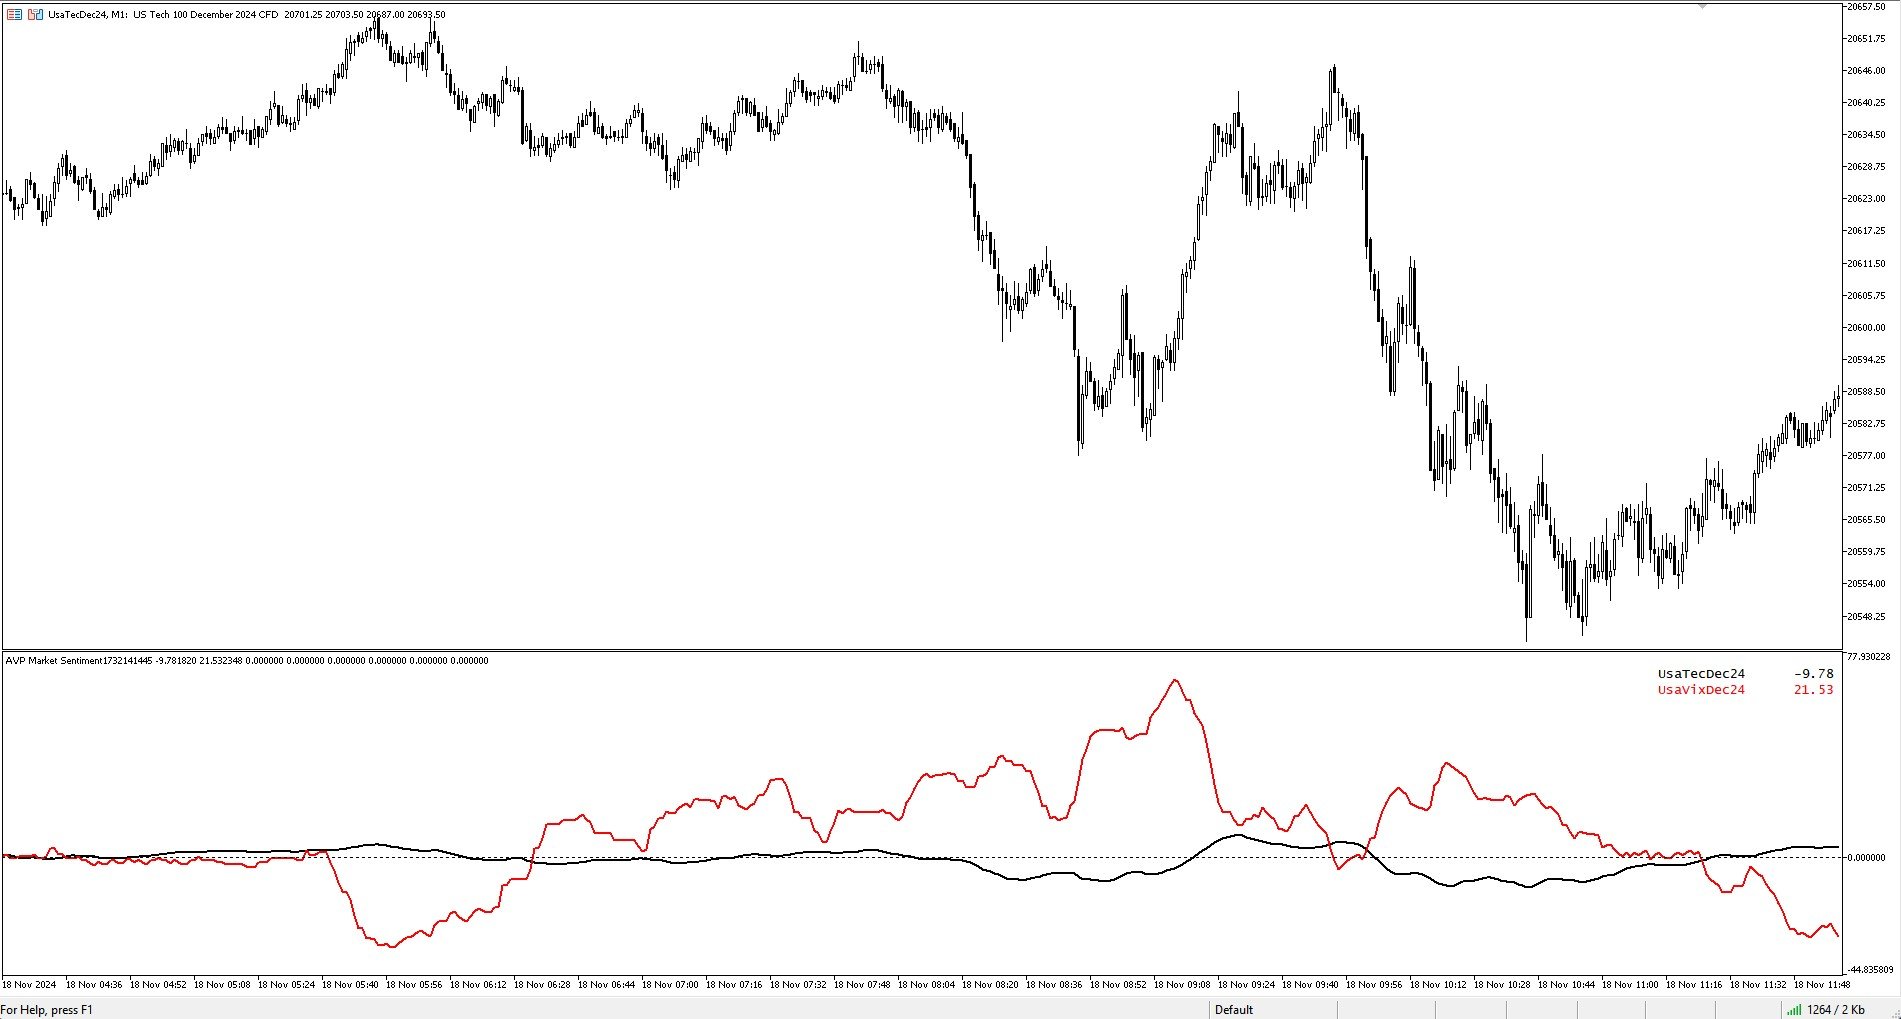
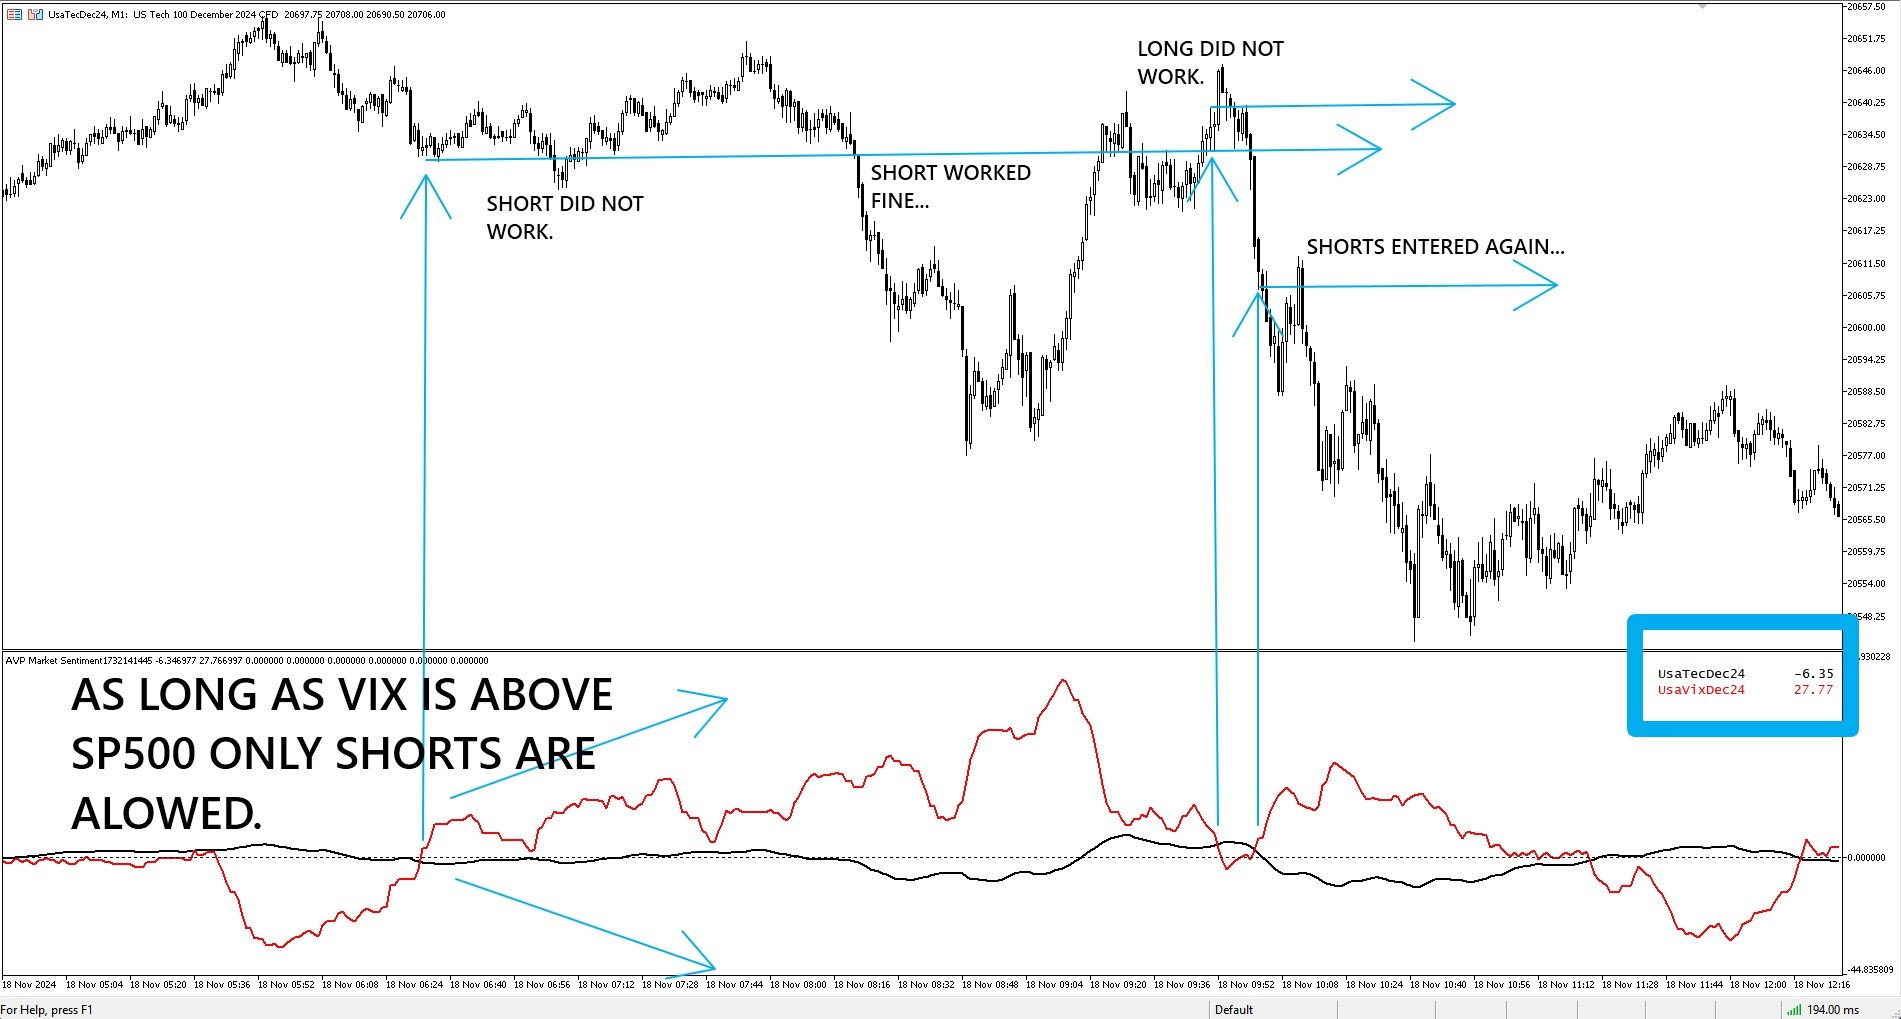
AVP Market Sentiment는 동일한 하위 차트 창에서 여러 자산 간의 관계를 분석하기 위해 개발된 도구입니다. 특히 잘 연구된 상관관계를 가진 티커를 비교할 때 유용합니다 (예: 미래 지수와 VIX). 여러 티커를 동시에 모니터링하고 하나 또는 여러 티커에 대한 의사 결정을 내릴 때 매우 유용합니다. 이 도구는 플랫폼에서 사용되는 이동 평균의 종류를 선택하고, 각 평균의 기간을 설정하며, 각 선의 색상을 사용자 지정할 수 있습니다. 계산이 빠르고 분석에서 매우 다재다능한 가벼운 도구입니다.

변동 수익에서 시장 분석의 중요성

변동 수익의 역동적인 세계에서 시장 분석은 투자자들이 수익을 극대화하고 위험을 최소화하려는 데 필수적인 도구입니다. 글로벌 금융 시장의 복잡성은 다양한 자산 간의 상호 관계에 대한 깊은 이해를 요구합니다. 여기에는 통화 쌍, 금과 은과 같은 귀금속, 미래 지수, 그리고 VIX(변동성 지수)가 포함됩니다.

글로벌 상호 관계

금융 시장은 복잡하게 상호 연결되어 있습니다. 한 시장의 움직임은 다른 시장에 중요한 영향을 미칠 수 있습니다. 예를 들어, EUR/USD와 같은 통화 쌍의 변동은 금과 은과 같은 상품의 가치를 직접적으로 영향을 미칠 수 있습니다. 이는 이러한 상품들이 종종 미국 달러로 가격이 책정되기 때문에 환율 변동에 민감하게 반응하기 때문입니다.

또한, 미국과 유로존과 같은 주요 경제국들의 통화 정책은 환율과 상품 시장에 영향을 미칩니다. 예를 들어, 연방준비제도(Fed)가 금리를 변경하면, 주식 시장부터 원유 가격까지 모든 분야에 연쇄 반응을 일으킬 수 있습니다.

귀금속과 통화

금과 은은 경제적 불확실성이 있을 때 특히 안전 자산으로 간주됩니다. 이들 금속과 통화 간의 관계는 복잡합니다. 달러가 강세를 보일 때 금 가격은 하락하는 경향이 있으며, 반대로 달러가 약세를 보일 때 금 가격은 상승하는 경향이 있습니다. 투자자들은 이러한 동향을 면밀히 관찰하여 투자 전략을 조정하고 필요에 따라 보호 또는 레버리지를 추구합니다.

역사적으로 금은 인플레이션과 통화 가치 하락에 대한 보호 수단으로 여겨졌습니다. 2008년과 같은 금융 위기 동안, 투자자들이 안전을 추구하면서 금 가격은 급등했습니다. 은은 금보다는 가치가 적지만 산업 분야에서 중요한 역할을 하며, 이는 은의 분석에 추가적인 복잡성을 더합니다.

미래 지수와 VIX

S&P 500과 다우 존스와 같은 미래 지수는 시장의 감정에 대한 예측을 제공합니다. 이들은 시장 움직임을 예측하고 포지션을 조정하는 데 유용한 지표입니다. VIX, 즉 "두려움 지수"는 시장의 변동성 기대치를 측정합니다. VIX가 높으면 불확실성이 커지며, 이는 위험을 완화하기 위해 투자 포트폴리오를 조정하는 데 도움이 될 수 있습니다.

예를 들어, 변동성이 높은 시기에는 투자자들이 안전 자산에 대한 포지션을 늘리거나 헤지 전략을 조정할 수 있습니다. VIX는 시장의 두려움을 반영할 뿐만 아니라, 투자자들이 미래의 변동성을 예상하고 거래할 수 있는 도구로 사용될 수 있습니다.

시장 분석 전략

효과적인 분석을 수행하려면 투자자들이 기본 분석과 기술 분석의 조합을 고려해야 합니다. 기본 분석은 자산 가치에 영향을 미칠 수 있는 경제적, 금융적, 기타 정성적 요인들을 연구하는 것입니다. 여기에는 경제 보고서 분석, 통화 정책 결정, 지정학적 사건들이 포함됩니다.

반면, 기술 분석은 시장에서의 가격과 거래량 패턴에 집중합니다. 이동 평균, 볼린저 밴드, 모멘텀 지표와 같은 도구들은 시장의 추세와 진입 및 퇴출 시점을 식별하는 데 사용됩니다. 이러한 접근법을 결합하면 시장에 대한 더 완전한 시각을 제공할 수 있습니다.

결론

변동 수익에서 시장 분석은 복잡한 글로벌 금융 환경을 탐색하는 데 필수적입니다. 자산, 통화, 귀금속 및 변동성 지수 간의 상호 관계를 이해하는 것은 투자자들이 정보에 기반한 결정을 내리고, 기회를 활용하고 위험으로부터 보호할 수 있도록 해줍니다. 정보가 힘인 세상에서, 시장 분석은 변동 수익 투자에서 성공의 열쇠입니다.


추천 제품
우리의   Basic Support and Resistance   표시기는 기술 분석을 향상시키는 데 필요한 솔루션입니다.이 표시기는 차트/ MT4 버전 특징 피보나치 수준의 통합 : 지원 및 저항 수준과 함께 피보나치 수준을 표시하는 옵션과 함께, 우리의 지표는 시장 행동과 가능한 역전 영역에 대한 더 깊은 통찰력을 제공합니다. 성능 최적화 : 각 막대의 개구부에서만 확장 라인을 업데이트하는 옵션을 사용하여, 우리의 지표는 지원 및 저항 수준의 정확도를 희생하지 않고 최적의 성능을 보장합니다. 입력 주요 설정 Timeframe:  이 입력을 통해 차트에 더 높은 기간의 지지선과 저항선을 표시하도록 선택할 수 있습니다. Support/Resistance Strength [Number of Bars]:   이 입력을 사용하면 지지대와 저항의 강도를 결정할 수 있습니다.숫자가 높을수록지지/저항이 더 강해집니다. Price mode:  이 매개 변수를 사용하면 지원 및 저항 수준을
SMC Venom Model BPR 지표는 Smart Money(SMC) 개념 내에서 일하는 트레이더를 위한 전문 도구입니다. 가격 차트에서 두 가지 주요 패턴을 자동으로 식별합니다. FVG (공정 가치 갭)는 3개의 캔들의 조합으로, 첫 번째와 세 번째 캔들 사이에 갭이 있습니다. 이는 볼륨 지원이 없는 레벨 사이에 구역을 형성하여 종종 가격 수정으로 이어집니다. BPR (균형 가격 범위)은 두 개의 FVG 패턴의 조합으로, "브리지"를 형성합니다. 이는 가격이 낮은 볼륨 활동으로 움직일 때 브레이크아웃과 레벨로의 복귀 구역으로, 캔들 사이에 갭을 생성합니다. 이러한 패턴은 거래자가 차트에서 거래량과 가격 역학을 분석하여 주요 지지/저항 수준, 돌파 구역 및 진입 지점을 식별하는 데 도움이 되며, 여기서 대형 시장 참여자와 일반 참여자 간의 상호 작용이 발생합니다. 이 지표는 사각형과 화살표 형태로 패턴을 시각화하며 유연한 경고 설정도 지원합니다. 주요 특징: 패턴 표시 모드
Blahtech Market Profile MT5
Blahtech Limited
5 (10)
Was: $249  Now: $149   Market Profile defines a number of day types that can help the trader to determine market behaviour. A key feature is the Value Area, representing the range of price action where 70% of trading took place. Understanding the Value Area can give traders valuable insight into market direction and establish the higher odds trade. It is an excellent addition to any system you may be using. Inspired by Jim Dalton’s book “Mind Over Markets”, this indicator is designed to suit the
Introducing the Power Trade Plus indicator designed by a small group of traders with a few years of experience trading the market profitably.  The Power Trade Plus is derived from the Power Trade indicator,  the indicator strive in powerful sniper entries and take profit levels,  with an algorithm that's can determine the markets volatility and Provides entries based on the current market volatility. This indicator is much more effective in stock ,currencies and indices.
Riko Trend mt5
Nadiya Mirosh
The Riko Trend indicator is a revolutionary trend trading and filtering solution with all the important features of a trend tool built into one tool! The Riko Trend indicator is good for any trader, suitable for any trader for both forex and binary options. You don’t need to configure anything, everything is perfected by time and experience, it works great during a flat and in a trend. The Riko Trend indicator is a technical analysis tool for financial markets that reflects the current price f
Mine Farm
Maryna Kauzova
Mine Farm is one of the most classic and time-tested scalping strategies based on the breakdown of strong price levels. Mine Farm is the author's modification of the system for determining entry and exit points into the market... Mine Farm - is the combination of great potential with reliability and safety. Why Mine Farm?! - each order has a short dynamic Stop Loss - the advisor does not use any risky methods (averaging, martingale, grid, locking, etc.) - the advisor tries to get the most
This is my first ExpertAdvisor, but it came along with more than 7 years in experience trading Forex , Crypto and Index.                                                                                SHEERAN: The Advanced Multi-Timeframe EA for Dynamic and Adaptive Trading   EA SHEERAN, is designed for traders who demand precision, flexibility, and reliability across multiple timeframes. Whether you’re targeting short-term gains on the M30 chart or looking for sustained moves on the H4, this E
ProEngulfing For MT5
Ashkan Hazegh Nikrou
ProEngulfing 무료 버전은 QualifiedEngulfing으로, 하루에 하나의 신호로 제한되며 기능이 적습니다. 모든 Koala 제품에 대한 최신 정보를 확인하려면 mql5 커뮤니티에서 Koala Trading Solution 채널에 가입하세요. 가입 링크는 아래와 같습니다: https ://www .mql5 .com /en /channels /koalatradingsolution 이 제품의 MT4 버전은 아래 링크에서 다운로드 가능합니다: https ://www .mql5 .com /en /market /product /52023 ProEngulfing 소개 – MT4용 전문가 수준의 Engulf 패턴 지표 정확성을 극대화한 ProEngulfing을 소개합니다. 이 최신 지표는 포렉스 시장에서 신뢰할 수 있는 Engulf 패턴을 식별하고 강조하는 데 중점을 둔 제품입니다. MetaTrader 4에 맞게 개발된 ProEngulfing은 신뢰도 높은 신호를 제공하기 위해
KT Renko Patterns MT5
KEENBASE SOFTWARE SOLUTIONS
KT Renko Patterns는 렌코 차트를 벽돌 하나하나 분석하여, 전 세계 다양한 금융 시장에서 트레이더들이 자주 사용하는 유명한 차트 패턴들을 찾아냅니다. 시간 기반 차트와 비교하면, 렌코 차트는 시각적으로 단순하고 깔끔하여 패턴 중심의 트레이딩이 훨씬 쉽게 가능합니다. KT Renko Patterns에는 다양한 렌코 패턴이 포함되어 있으며, 이 중 상당수는 Prashant Shah의 저서 『Profitable Trading with Renko Charts』에서 자세히 설명되어 있습니다. KT Renko Patterns 인디케이터를 기반으로 한 100% 자동화된 EA는 여기에서 이용할 수 있습니다 - KT Renko Patterns EA . 기능 소개 최대 8개의 명확한 렌코 패턴을 거래할 수 있어, 혼동 없이 신뢰도 높은 트레이딩이 가능합니다. 객관성을 제공하기 위해 각 패턴에는 손절선과 피보나치 목표가 함께 제공됩니다. KT Renko Patterns는 각 패턴의 정
Your Trend Friend
Luigi Nunes Labigalini
5 (1)
The trend is your friend! Look at the color of the indicator and trade on that direction. It does not  repaint. After each candle is closed, that's the color of the trend. You can focus on shorter faster trends or major trends, just test what's most suitable for the symbol and timeframe you trade. Simply change the "Length" parameter and the indicator will automatically adapt. You can also change the color, thickness and style of the lines. Download and give it a try! There are big movements w
Mean Reversion Supply Demand Indicator Mean Reversion Supply Demand is the indicator to detect the important supply demand zone in your chart. The concept of supply demand trading relies on the quantity mismatching between buying and selling volumes in the financial market. Typically, supply demand zone serves to predict the turning point. The wave pattern, for any supply demand zone to work as an successful trade, looks like the price must touch the base zone, move away and then return to zone
Volality Index Scalper
Lesedi Oliver Seilane
5 (1)
Volality Index scalper indicator  Meant for Volality pairs such as Volality 10, 25, 50, 75 and 100 The indicator works on all timeframes from the 1 minute to the monthly timeframe the indicator is non repaint the indicator has 3 entry settings 1 color change on zero cross 2 color change on slope change 3 color change on signal line cross Orange line is your sell signal Blue line is your buy signal.
Awesome Oscillator by Bill Williams with the ability to fine-tune and replace the averaging algorithms of the indicator, which significantly expands the possibilities of using this oscillator in algorithmic trading and brings it closer in its properties to such an indicator as the MACD. To reduce price noise, the final indicator is processed with an additional Smooth averaging. The indicator has the ability to give alerts, send mail messages and push signals when the direction of movement of th
Profile Map MT5
Dmitriy Sapegin
5 (5)
Market Profile helps the trader to identify the behavior if major market players and define zones of their interest. The key feature is the clear graphical display of the range of price action, in which 70% of the trades were performed. Understanding of the location of volume accumulation areas can help traders increase the probability of success. The tool can be used as an independent system as well as in combination with other indicators and trading systems. this indicator is designed to suit
Initial Balance MT5
Ricardo Almeida Branco
The Initial Balance (Initial Balance / Initial Balance) is a concept related to the study of volume (to learn more, study about Market Profile and Auction Market Theory. You can find some videos in English when searching for "Initial Balance Market Profile"). The IB defines a range in which prices were negotiated in the first hour of trading.The amplitude of the range is important and the break in the range defined by the Initial Balance may have occurred due to the movement of several players
Provided Trend
Nadiya Mirosh
Provided Trend is a complex signal formation indicator. As a result of the work of internal algorithms, you can see only three types of signals on your chart. The first is a buy signal, the second is a sell signal, and the third is a market exit signal. Options: CalcFlatSlow - The first parameter that controls the main function of splitting the price chart into waves. CalcFlatFast - The second parameter that controls the main function of splitting the price chart into waves. CalcFlatAvg - Para
NeuroExt
Dmytryi Voitukhov
4 (11)
https://t.me/mql5_neuroExt   actual version Signal https://www.mql5.com/ru/signals/1511461 You can use any tool. The bases will be automatically created at the start of the Learn. If you need to start learning from 0 - just delete the base files. Initial deposit - from 200 ye. Options: DO NOT ATTEMPT TO TEST WITHOUT NEURAL NETWORK TRAINING! it is enough for the balance graph after training to be horizontal. generating a training base is extremely simple.  there is a ready-made training for U
FREE
Noize Absorption Index
Ekaterina Saltykova
Noize Absorption Index - is the manual trading system that measures the difference of pressure between bears forces and bulls forces. Green line - is a noize free index that showing curent situation. Zero value of index shows totally choppy/flat market.Values above zero level shows how powerfull bullish wave is and values below zero measures bearish forces.Up arrow appears on bearish market when it's ready to reverse, dn arrow appears on weak bullish market, as a result of reverse expectation.
Unlock powerful breakout opportunities The 123 Pattern is one of the most popular, powerful and flexible chart patterns. The pattern is made up of three price points: a bottom, a peak or valley, and a Fibonacci retracement between 38.2% and 71.8%. A pattern is considered valid when the price breaks beyond the last peak or valley, moment at which the indicator plots an arrow, rises an alert, and the trade can be placed. [ Installation Guide | Update Guide | Troubleshooting | FAQ | All Products ]
Before installing the HeatMap indicator make sure you are using a broker that gives you access to the Depth of market (DOM) !! This indicator creates a heatmap on your chart allowing you to see the buy or sell limit orders easily and in real time. You have the possibility to change the setting and the colors of the HeatMap in order to adapt to all markets and all charts. Here is an example of a setting you can use with the NASDAQ100 on the AMPGlobal broker :  https://www.youtube.com/watch?v=x0Y
This indicator allows you to enjoy the two most popular products for analyzing request volumes and market deals at a favorable price: Actual Depth of Market Chart Actual Tick Footprint Volume Chart This product combines the power of both indicators and is provided as a single file. The functionality of Actual COMBO Depth of Market AND Tick Volume Chart is fully identical to the original indicators. You will enjoy the power of these two products combined into the single super-indicator! Below is
Visual Range Directional Force Indicator
AL MOOSAWI ABDULLAH JAFFER BAQER
Range Directional Force Indicator – Designed for You to Optimize! The Range Directional Force Indicator is a cutting-edge tool designed to empower traders by visualizing market dynamics and directional strength. Built to offer insights into market trends and reversals, this indicator is an invaluable asset for traders seeking precision in their strategies. However, it is important to note that this indicator is not optimized, leaving room for you to tailor it to your unique trading preferences.
Antique Trend
Nadiya Mirosh
The Antique Trend Indicator is a revolutionary trend trading and filtering solution with all the important features of a trend tool built into one tool! The Antique Trend indicator is good for any trader, suitable for any trader both for Forex and binary options. There is no need to configure anything, everything has been perfected by time and experience, it works great during flats and trends. The Antique Trend indicator is a tool for technical analysis of financial markets, reflecting curren
Gecko EA MT5
Profalgo Limited
5 (1)
NEW PROMO: Only a few copies copies available at 349$ Next price: 449$ Make sure to check out our " Ultimate EA combo package " in our   promo blog ! Gecko runs a simple, yet very effective, proven strategy.  It looks for important recent support and resistance levels and will trade the breakouts.  This is a "real" trading system, which means it will use a SL to protect the account.  It also means it will not use any dangerous techniques like martingale, grid or averaging down. The EA shows its
Girassol Sunflower MT5 Indicator
Saullo De Oliveira Pacheco
This is the famous Sunflower indicator for Metatrader5. This indicator marks possible tops and bottoms on price charts. The indicator identifies tops and bottoms in the asset's price history, keep in mind that the current sunflower of the last candle repaints, as it is not possible to identify a top until the market reverses and it is also not possible to identify a bottom without the market stop falling and start rising. If you are looking for a professional programmer for Metatrader5, please
Maximum Trend Arrows OT MT5
Mulweli Valdaz Makulana
STRICTLY FOR BOOM INDEX ONLY!!!!! Here I bring the Maximum Trend Arrows OT1.0 MT5 indicator. This indicator is made up of a combination of different trend indicators for entries and exits, for entries an orange arrow will paint on the chart below the current market and a red flag for closing of trades and it produces buy arrows only. When the orange arrow appears, it will appear along with it's sound to notify you. The 1H timeframe is recommended, don't use it anywhere else than on the 1H timefr
How to use Pair Trading Station Pair Trading Station is recommended for H1 time frame and you can use it for any currency pairs. To generate buy and sell signal, follow few steps below to apply Pair Trading Station to your MetaTrader terminal. When you load Pair Trading Station on your chart, Pair Trading station will assess available historical data in your MetaTrader platforms for each currency pair. On your chart, the amount of historical data available will be displayed for each currency pai
Pullback Hunter
Anton Polkovnikov
PULLBACK HUNTER What is every trader's cherished dream? To see without delay the places where the reversal will happen. This, of course, is from the category of magic, though... nothing is impossible. But for now I've prepared for you an indicator that marks in real time the end of corrections to the current movement or in short - catches pullbacks.What is the main point? Many people practice rebounds when the price moves in the direction of the open position. And they do them on the formation o
DYJ BoS
Daying Cao
DYJ BoS 지표는 다음을 포함하여 시장 구조 변화의 필수 요소를 자동으로 식별하고 표시합니다. 구조 돌파(BoS): 가격이 크게 움직여 이전 구조 지점을 돌파할 때 감지됩니다. 상승 추세선과 하락 추세선(UP & DN, 즉 연속적인 신고가와 신저가)을 표시하고, 가격이 이러한 선을 돌파하면 빨간색(BEAR)과 초록색(BULL) 화살표를 표시합니다. BoS는 일반적으로 가격이 이전 가격 움직임에 의해 확립된 스윙 저점이나 스윙 고점을 확실히 통과할 때 발생합니다. 가격이 스윙 하이보다 높거나 스윙 로우보다 낮게 움직일 경우, 이는 단순히 이전에 형성된 시장 구조를 깨는 것이므로 "브레이크아웃" 구조라고 합니다. 이는 종종 시장 심리와 추세 방향의 변화를 나타내며, 기존 추세가 지속되거나 새로운 추세가 시작됨을 알립니다. 일반적으로 마감 정확도를 높이기 위해 손절매와 이익실현을 설정하지 않는 것이 좋습니다. 최종 포지션은 일반적으로 같은 방향의 다음 돌파점에서 마감되거나 반
안녕하세요. 12point입니다. 인디케이터가 손쉽게 원하는 통화차트로 변경해줍니다.  굳이 듀얼모니터 사용하실 필요없습니다. 창 두개 띄어놓고도 변경가능합니다. 풀버전입니다. 통화는 무조건  Market Watch 목록에 활성화가 되어있어야합니다. 그래야 정상작동이 되요.  파라미터 값: SymbolList - 원하시는 통화 및 상품을 추가 할 수 있습니다 콤마(,)를 붙혀주세요. ratio - 사이즈 조절 LineNumber - 각 라인당 몇개의 통화버튼을 지정할것인가 입니다. button_width - 버튼 사이즈 조절 button_height - 버튼 사이즈 조절 손매매에 하는데있어서 나름 괜찮은 무기를 획득했으니... 우리 모두 성투해 봅시다.   감사합니다.
이 제품의 구매자들이 또한 구매함
Golden Trend Indicator MT5
Noha Mohamed Fathy Younes Badr
4.89 (18)
Golden Trend indicator  is The best indicator for predicting trend movement this indicator never lags and never repaints and never back paints    and give  arrow buy and sell    before the candle appear  and it will help you and  will make your trading decisions clearer its work on all currencies and  gold and crypto and all time frame This unique  indicator uses very secret algorithms to catch the  trends, so you can trade using this indicator and see the trend clear on charts  manual guide and
TPSproTREND PrO MT5
Roman Podpora
4.72 (18)
VERSION MT4        —        ИНСТРУКЦИЯ RUS           —        INSTRUCTIONS  ENG 주요 기능: 렌더링 없이 정확한 입력 신호! 신호가 나타나면 관련성은 유지됩니다! 이는 신호를 제공한 후 변경하여 예금 자금 손실을 초래할 수 있는 다시 그리기 지표와의 중요한 차이점입니다. 이제 더 큰 확률과 정확도로 시장에 진입할 수 있습니다. 화살표가 나타난 후 목표에 도달(이익실현)하거나 반전 신호가 나타날 때까지 캔들을 색칠하는 기능도 있습니다. STOP LOSS / TAKE PROFIT 구역 표시 진입점 검색 시 시각적 명확성을 높이기 위해 시장 진입을 위한 최적 지점이 검색되는 BUY/SELL 영역을 초기에 표시하는 모듈을 만들었습니다. 정지 손실 수준 작업을 위한 추가 지능형 논리는 시간이 지남에 따라 크기를 줄이는 데 도움이 되므로 거래에 들어갈 때 초기 위험을 줄이는 데 도움이 됩니다(move sl). 더 높은 기간의 MIN
TPSpro RFI Levels MT5
Roman Podpora
4.55 (20)
주요 플레이어의 반전 구역 / 피크 볼륨 / 활성 구역 =       TS TPS프로시스템 지침 RUS       /       지침       영어       /           버전 MT4        이 지표를 구매한 모든 구매자는 또한 다음을 무료로 받습니다. RFI SIGNALS 서비스의 거래 신호에 6개월 동안 액세스할 수 있습니다. TPSproSYSTEM 알고리즘에 따른 즉시 사용 가능한 진입 포인트입니다. 정기적으로 업데이트되는 교육 자료 - 전략에 푹 빠져서 전문가 수준을 높여보세요. 주중 24/5 지원 및 비공개 트레이더 채팅 이용 - 시장 상황에 대한 소통, 지원 및 분석. 저자가 설정한 파일 - 별도의 노력 없이 최대 결과를 얻을 수 있도록 지표를 자동으로 설정합니다. 주요 기능: 판매자와 구매자의 활동 영역을 표시합니다! 이 지표는 매수 및 매도에 대한 모든 올바른 첫 번째 임펄스 레벨/존을 표시합니다. 진입점 검색이 시작되는 이러한 레벨/존이 활성화되면
RelicusRoad Pro MT5
Relicus LLC
4.78 (18)
이제 $ 147 (몇 가지 업데이트 후 $ 499 증가) - 무제한 계정 (PCS 또는 MACS) RelicusRoad 사용 설명서 + 교육 비디오 + 비공개 Discord 그룹 액세스 + VIP 상태 시장을 보는 새로운 방법 RelicusRoad는 외환, 선물, 암호화폐, 주식 및 지수에 대한 세계에서 가장 강력한 거래 지표로서 거래자에게 수익성을 유지하는 데 필요한 모든 정보와 도구를 제공합니다. 우리는 초보자부터 고급까지 모든 거래자가 성공할 수 있도록 기술적 분석 및 거래 계획을 제공합니다. 미래 시장을 예측할 수 있는 충분한 정보를 제공하는 핵심 거래 지표입니다. 우리는 차트에서 말이 안 되는 여러 지표 대신 완전한 솔루션을 믿습니다. 타의 추종을 불허하는 매우 정확한 신호, 화살표 + 가격 조치 정보를 표시하는 올인원 표시기입니다. 강력한 AI를 기반으로 하는 RelicusRoad는 누락된 정보와 도구를 제공하여 교육하고 성공적인 트레이더인 트레이딩 전문가가 되도
MTF Supply Demand Zones MT5
Georgios Kalomoiropoulos
5 (1)
자동화된 수요 및 공급 구역의 차세대. 모든 차트에서 작동하는 새롭고 혁신적인 알고리즘. 모든 구역은 시장의 가격 움직임에 따라 동적으로 생성됩니다. 두 가지 유형의 경고 --> 1)가격이 영역에 도달할 때 2)새로운 영역이 형성될 때 당신은 더 이상 쓸모없는 지표를 얻을 수 없습니다. 입증된 결과로 완벽한 거래 전략을 얻을 수 있습니다.     새로운 기능:     가격이 공급/수요 영역에 도달하면 경고     새로운 공급/수요 구역이 생성되면 알림     푸시 알림 알림     핍의 영역 너비 레이블     기동특무부대에 한 번 더 시간이 주어집니다. 따라서 현재보다 위의 2개의 시간 프레임 대신 현재보다 높은 3개의 시간 프레임을 볼 수 있습니다.     Alerts/Zones/MTF 기능을 활성화/비활성화하는 버튼 당신이 얻는 이점:     거래에서 감정을 제거하십시오.     거래 항목을 객관화하십시오.     높은 확률 설정을 사용하여 수익
Quantum TrendPulse
Bogdan Ion Puscasu
5 (13)
SuperTrend   ,   RSI   ,   Stochastic   의 힘을 하나의 포괄적인 지표로 결합하여 트레이딩 잠재력을 극대화하는 궁극의 트레이딩 도구   인 Quantum TrendPulse를   소개합니다. 정밀성과 효율성을 추구하는 트레이더를 위해 설계된 이 지표는 시장 추세, 모멘텀 변화, 최적의 진입 및 종료 지점을 자신 있게 식별하는 데 도움이 됩니다. 주요 특징: SuperTrend 통합:   주요 시장 추세를 쉽게 따라가고 수익성의 물결을 타세요. RSI 정밀도:   매수 과다 및 매도 과다 수준을 감지하여 시장 반전 시점을 파악하는 데 적합하며 SuperTrend 필터로 사용 가능 확률적 정확도:   변동성이 큰 시장에서 숨겨진 기회를 찾기 위해 확률적 진동   을 활용하고 SuperTrend의 필터로 사용 다중 시간대 분석:   M5부터 H1 또는 H4까지 다양한 시간대에 걸쳐 시장을 최신 상태로 유지하세요. 맞춤형 알림:   맞춤형 거래 조건이 충족되면
Entry Points Pro for MT5
Yury Orlov
4.46 (130)
다시 색을 칠하지 않고 거래에 진입할 수 있는 정확한 신호를 제공하는 MT5용 지표입니다. 외환, 암호화폐, 금속, 주식, 지수 등 모든 금융 자산에 적용할 수 있습니다. 매우 정확한 추정값을 제공하고 매수와 매도의 가장 좋은 시점을 알려줍니다. 하나의 시그널로 수익을 내는 지표의 예와 함께 비디오 (6:22)시청하십시오! 대부분의 거래자는 Entry Points Pro 지표의 도움으로 첫 거래 주 동안 트레이딩 결과를 개선합니다. 저희의   Telegram Group 을 구독하세요! Entry Points Pro 지표의 좋은점. 재도색이 없는 진입 신호 신호가 나타나고 확인되면(시그널 캔들이 완성된 경우) 신호는 더 이상 사라지지 않습니다. 여타 보조지표의 경우 신호를 표시한 다음 제거되기 때문에 큰 재정적 손실로 이어집니다. 오류 없는 거래 게시 알고리즘을 통해 트레이드(진입 또는 청산)를 할 이상적인 순간을 찾을 수 있으며, 이를 통해 이를 사용하는 모든 거래자의 성공률이
FxaccurateLS
Shiv Raj Kumawat
WHY IS OUR FXACCCURATE LS MT5 THE PROFITABLE ? PROTECT YOUR CAPITAL WITH RISK MANAGEMENT Gives entry, stop and target levels from time to time. It finds Trading opportunities by analyzing what the price is doing during established trends. POWERFUL INDICATOR FOR A RELIABLE STRATEGIES We have made these indicators with a lot of years of hard work. It is made at a very advanced level. Established trends provide dozens of trading opportunities, but most trend indicators completely ignore them! The
설명 ICSM(Impulse-Correction SCOB Mapper)은 가격 움직임을 분석하고 유효한 충격, 수정 및 SCOB(Single Candle Order Block)을 식별하는 지표입니다. 유연하고 정보가 풍부하며 사용하기 쉽고 가장 유동성이 높은 관심 영역에 대한 트레이더의 인식을 크게 향상시키기 때문에 모든 유형의 기술적 분석과 함께 사용할 수 있는 강력한 도구입니다. 설정 일반 | 시각 색상 테마 - ICSM의 색상 테마를 정의합니다. SCOB | 시각 SCOB 표시 - SCOB를 활성화/비활성화합니다; SCOB 표시 방법 - SCOB 표현을 위한 스타일 옵션 목록을 나타냅니다; SCOB 색상 - SCOB의 색상을 정의합니다; ICM | 시각 ICM 라인 표시 - ICM(Impulse-Correction Mapper) 라인을 활성화/비활성화합니다; IC 트렌드 표시 - 차트 하단의 색상 구분선을 통해 충격-수정 트렌드 시각화를 활성화/비활성화합니다;
Blahtech Supply Demand MT5
Blahtech Limited
4.54 (13)
Was: $299  Now: $149  Supply Demand uses previous price action to identify potential imbalances between buyers and sellers. The key is to identify the better odds zones, not just the untouched ones. Blahtech Supply Demand indicator delivers functionality previously unavailable on any trading platform. This 4-in-1 indicator not only highlights the higher probability zones using a multi-criteria strength engine, but also combines it with multi-timeframe trend analysis, previously confirmed swings
MetaBands M5
Vahidreza Heidar Gholami
4.5 (2)
MetaBands uses powerful and unique algorithms to draw channels and detect trends so that it can provide traders with potential points for entering and exiting trades. It’s a channel indicator plus a powerful trend indicator. It includes different types of channels which can be merged to create new channels simply by using the input parameters. MetaBands uses all types of alerts to notify users about market events. Features Supports most of the channel algorithms Powerful trend detection algorith
[ MT4 Version ]  [ Order Blocks ]  [ Kill Zones ]  [ SMT Divergences ] How to trade using Order Blocks :  Click here User Interface Performance:  During testing in the strategy tester, the UI may experience lag. Rest assured, this issue is specific to the testing environment and does not affect the indicator's performance in live trading. Elevate your trading strategy with the  Order Blocks ICT Multi TF  indicator, a cutting-edge tool designed to enhance your trading decisions through advanced o
[ MT4 Version ]  [ Kill Zones ]  [ SMT Divergences ] How to trade using Order Blocks:  Click here User Interface Performance:  During testing in the strategy tester, the UI may experience lag. Rest assured, this issue is specific to the testing environment and does not affect the indicator's performance in live trading. Elevate your trading strategy with the  Order Blocks ICT Multi TF  indicator, a cutting-edge tool designed to enhance your trading decisions through advanced order block analysis
[ MT4 Version ] Are you tired of spending months on demo or live accounts to test your trading strategies? The Backtesting Simulator is the ultimate tool designed to elevate your backtesting experience to new heights. Utilizing Metatrader historical symbol information, it offers an unparalleled simulation of real market conditions. Take control of your testing speed, test ideas quickly or at a slower pace, and witness remarkable improvements in your testing performance. Forget about wasting tim
Precision trading: leverage wolfe waves for accurate signals Wolfe Waves are naturally occurring trading patterns present in all financial markets and represent a fight towards an equilibrium price. These patterns can develop over short and long-term time frames and are one of the most reliable predictive reversal patterns in existence, normally preceding strong and long price movements. [ Installation Guide | Update Guide | Troubleshooting | FAQ | All Products ] Clear trading signals Amazingly
IQ Gold Gann Levels a non-repainting, precision tool designed exclusively for XAUUSD/Gold intraday trading. It uses W.D. Gann’s square root method to plot real-time support and resistance levels, helping traders spot high-probability entries with confidence and clarity. William Delbert Gann (W.D. Gann) was an exceptional market analyst, whose trading technique was based on a complex blend of mathematics, geometry, astrology, and ancient mathematics which proved to be extremely accurate. Download
AT Forex Indicator MT5
Marzena Maria Szmit
5 (5)
The AT Forex Indicator MT5 is a sophisticated trading tool designed to provide traders with a comprehensive analysis of multiple currency pairs. This powerful indicator simplifies the complex nature of the forex market, making it accessible for both novice and experienced traders. AT Forex Indicator uses advanced algorithms to detect trends, patterns and is an essential tool for traders aiming to enhance their forex trading performance. With its robust features, ease of use, and reliable signal
Royal Scalping Indicator M5
Vahidreza Heidar Gholami
5 (6)
Royal Scalping Indicator is an advanced price adaptive indicator designed to generate high-quality trading signals. Built-in multi-timeframe and multi-currency capabilities make it even more powerful to have configurations based on different symbols and timeframes. This indicator is perfect for scalp trades as well as swing trades. Royal Scalping is not just an indicator, but a trading strategy itself. Features Price Adaptive Trend Detector Algorithm Multi-Timeframe and Multi-Currency Trend Low
프리시전 트레이딩 시스템의 로저 메드칼프에 의한 프리시전 인덱스 오실레이터 (Pi-Osc) 버전 2는 차트에 신속하게 로드되도록 주의 깊게 다시 코딩되었으며 경험을 향상시키기 위해 몇 가지 다른 기술적 개선 사항이 통합되었습니다. Pi-Osc는 정확한 거래 타이밍 신호를 제공하도록 개발되었으며 시장이 모든 사람의 스톱을 청산하기 위해 가야 하는 극도의 고갈 지점을 찾는 데 목적이 있습니다. 이 제품은 극단적인 지점이 어디에 있는지 알고 있는 고전적인 문제를 해결하며 트레이더로서의 삶을 훨씬 간단하게 만듭니다. 이것은 업계 표준 오실레이터와는 상당히 다른 강력한 차이점을 가지고 있는 고도로 복잡한 합의 지표입니다. 사용하는 기능 중 일부는 수요 지수, 자금 흐름, RSI, 스토캐스틱, 패턴 인식, 거래량 분석, 표준 편차 극단점 및 다양한 길이에서 위와 유사한 변형을 갖습니다. 미숙한 눈에는 다른 오실레이터와 비슷해 보일 수 있지만 RSI 또는 모멘텀과 같은 다른 오실레이
Trade smarter, not harder: Empower your trading with Harmonacci Patterns This is arguably the most complete harmonic price formation auto-recognition indicator you can find for the MetaTrader Platform. It detects 19 different patterns, takes fibonacci projections as seriously as you do, displays the Potential Reversal Zone (PRZ) and finds suitable stop-loss and take-profit levels. [ Installation Guide | Update Guide | Troubleshooting | FAQ | All Products ] It detects 19 different harmonic pri
Advanced Supply Demand MT5
Bernhard Schweigert
4.5 (14)
현재 33% 할인! 초보자나 전문 트레이더를 위한 최고의 솔루션! 이 보조지표는 우리가 다수의 독창적 기능과 새로운 공식을 통합한 독특하고 고품질이며 저렴한 거래 도구입니다. 이 업데이트를 통해 이중 시간대를 표시할 수 있습니다. 더 높은 TF를 표시할 수 있을 뿐만 아니라 차트 TF와 더 높은 TF 모두를 표시할 수 있습니다: 중첩 영역 표시. 모든 Supply Demand 트레이더들이 좋아할 것입니다. :) 중요한 정보 공개 Advanced Supply Demand의 잠재력을 극대화하려면 다음을 방문하십시오. https://www.mql5.com/ko/blogs/post/720245   진입 또는 목표의 명확한 트리거 포인트를 정확히 찾아냄으로 해서 거래가 어떻게 개선될지 상상해 보십시오. 새로운 알고리즘을 기반으로 매수자와 매도자 간의 잠재적인 불균형을 훨씬 더 쉽게 분간할 수 있습니다. 왜냐하면 가장 강한 공급영역과 가장 강한 수요 영역과 과거에 어떻게 진행 되었는지를(이전
KT Candlestick Patterns MT5
KEENBASE SOFTWARE SOLUTIONS
KT Candlestick Patterns는 실시간으로 24가지 가장 신뢰할 수 있는 일본 캔들 패턴을 찾아 차트에 표시합니다. 일본 트레이더들은 18세기부터 이러한 패턴을 사용해 가격 방향을 예측해왔습니다. 모든 캔들 패턴이 동일한 신뢰도를 가지는 것은 아니지만, 지지/저항 같은 다른 기술적 분석과 결합하면 시장 상황을 명확하게 보여줍니다. 이 지표는 Steve Nison의 책 "Japanese Candlestick Charting Techniques"에 소개된 많은 패턴을 포함하고 있습니다. 책에서 다루지 않는 복잡한 패턴들도 감지할 수 있어 더욱 강력한 기능을 제공합니다. 기능 각 신호에서 고정된 핍 수익을 목표로 설정하면, 지표가 해당 목표에 대한 성공률을 실시간으로 계산합니다. 일본의 유명한 24가지 캔들 패턴을 높은 정확도로 식별합니다. 각 패턴의 성능을 분석하고 정확도를 실시간으로 보여주는 모듈이 내장되어 있습니다. 패턴 간 최소 바 수를 설정할 수 있어 차트를 깔
CBT Quantum Maverick 고효율 바이너리 옵션 거래 시스템 CBT Quantum Maverick는 정밀하고 간단하며 체계적인 거래를 원하는 트레이더를 위해 설계된 고성능 바이너리 옵션 거래 시스템입니다. 사용자 지정이 필요 없으며, 처음부터 최적화된 결과를 제공합니다. 약간의 연습만으로 신호를 쉽게 마스터할 수 있습니다. 주요 특징: 정확한 신호 제공: 현재 봉 데이터를 기반으로 다음 캔들에 대한 신호를 생성하며, 빈번한 재도색이 없습니다. 다양한 시장에 대한 적응성: 바이너리 옵션 거래에 특화되었으며, 여러 브로커 및 자산 클래스와 호환됩니다. 호환 가능: Deriv Synthetic Charts: 모든 시간 프레임에서 사용 가능. OTC 차트: Quotex, PocketOption, Binomo, Stockity, IQOption, Exnova, OlympTrade, Deriv, Binolla, Homebroker 등의 브로커와 호환(MT5로의 무료 데이터 임
MetaForecast M5
Vahidreza Heidar Gholami
5 (3)
MetaForecast는 가격 데이터의 조화를 기반으로 모든 시장의 미래를 예측하고 시각화합니다. 시장이 항상 예측 가능한 것은 아니지만 가격에 패턴이 있다면 MetaForecast는 가능한 정확하게 미래를 예측할 수 있습니다. 다른 유사한 제품과 비교했을 때, MetaForecast는 시장 동향을 분석하여 더 정확한 결과를 생성할 수 있습니다. 입력 매개변수 Past size (과거 크기) MetaForecast가 미래 예측을 생성하기 위한 모델을 만드는 데 사용하는 막대의 수를 지정합니다. 모델은 선택한 막대 위에 그려진 노란색 선으로 표시됩니다. Future size (미래 크기) 예측해야 할 미래 막대의 수를 지정합니다. 예측된 미래는 핑크색 선으로 표시되며 그 위에 파란색 회귀선이 그려집니다. Degree (차수) 이 입력은 MetaForecast가 시장에서 수행할 분석 수준을 결정합니다. Degree 설명  0 차수 0의 경우, "Past size" 입력에 모든 봉우리와
PZ Mean Reversion MT5
PZ TRADING SLU
3 (2)
평균 회귀 거래에 대한 전문적이고 정량적인 접근 방식을 구현하는 고유한 지표입니다. 이는 가격이 예측 가능하고 측정 가능한 방식으로 평균으로 전환되고 반환된다는 사실을 이용하여 비정량적 거래 전략을 훨씬 능가하는 명확한 진입 및 퇴장 규칙을 허용합니다. [ Installation Guide | Update Guide | Troubleshooting | FAQ | All Products ] 명확한 거래 신호 놀랍도록 쉬운 거래 사용자 정의 가능한 색상 및 크기 성능 통계 구현 대부분의 거래 전략을 능가합니다. 적절한 SL 및 TP 레벨을 표시합니다. 이메일/음향/시각 알림을 구현합니다. 작동 원리 이 지표는 더 높은 기간에서 완전히 사용자 정의 가능한 이동 평균 주변의 표준 편차를 측정하고 추세 추종 접근 방식을 사용하여 정확하게 거래를 찾습니다. 거래는 현재 차트의 가격 동작을 살펴보고 선택한 더 높은 기간에서 계산된 평균 가격대로 가격이 돌아오면 닫힙니다. 코딩 방식 때문에 지
The   Time_Price_SQ9_Degree   indicator is based on the 9 Gann square. Using this indicator, you can identify strong time and price zones. The indicator displays the levels as a degree value. The degrees can be set in the settings. After launching, the MENU button appears. If it is highlighted, it can be moved to any point on the graph, and after double-clicking on it, it stops being highlighted and menu buttons appear. To hide the menu, just double-click on the button, it will become highlight
Volume by Price MT5
Brian Collard
3.25 (4)
Volume Profile, Footprint and Market Profile TPO (Time Price Opportunity). Volume and TPO histogram bar and line charts. Volume Footprint charts. TPO letter and block marker collapsed and split structure charts. Static, dynamic and flexible range segmentation and compositing methods with relative and absolute visualizations. Session hours filtering and segment concatenation with Market Watch and custom user specifications. Graphical layering, positioning and styling options to suit the user's a
Weltrade Spike Sentinel
Batsirayi L Marango
Introducing Indicator for PainX and GainX Indices Traders on Weltrade Get ready to experience the power of trading with our indicator, specifically designed for Weltrade   broker's PainX and GainX Indices.  Advanced Strategies for Unbeatable Insights Our indicator employs sophisticated strategies to analyze market trends, pinpointing optimal entry and exit points.  Optimized for Maximum Performance To ensure optimal results, our indicator is carefully calibrated for 5-minute timeframe charts on
TPA True Price Action indicator reveals the true price action of the market makers through 100% non-repainting signals strictly at the close of a candle! TPA shows entries and re-entries, every time the bulls are definitely stronger than the bears and vice versa. Not to confuse with red/green candles. The shift of power gets confirmed at the earliest stage and is ONE exit strategy of several. There are available now two free parts of the TPA User Guide for our customers. The first "The Basics"
Berma Bands
Muhammad Elbermawi
5 (3)
Berma Bands(BBs) 지표는 시장 동향을 파악하고 이를 활용하려는 트레이더에게 귀중한 도구입니다. 가격과 BBs 간의 관계를 분석함으로써 트레이더는 시장이 추세 단계인지 범위 단계인지를 분별할 수 있습니다. 자세한 내용을 알아보려면 [ Berma Home Blog ]를 방문하세요. 버마 밴드는 세 개의 뚜렷한 선으로 구성되어 있습니다. 어퍼 버마 밴드, 미들 버마 밴드, 로어 버마 밴드입니다. 이 선들은 가격 주위에 그려져 전체 추세에 대한 가격 움직임을 시각적으로 표현합니다. 이 밴드들 사이의 거리는 변동성과 잠재적인 추세 반전에 대한 통찰력을 제공할 수 있습니다. 버마 밴드 라인이 각각에서 분리될 때, 그것은 종종 시장이 횡보 또는 범위 이동 기간에 접어들고 있음을 시사합니다. 이는 명확한 방향 편향이 없음을 나타냅니다. 트레이더는 이러한 기간 동안 추세를 파악하기 어려울 수 있으며 더 명확한 추세가 나타날 때까지 기다릴 수 있습니다. 버마 밴드 라인이 단일 라인으로
필터:
리뷰 없음
리뷰 답변