SpeedAngle
- 지표
- Davit Beridze
- 버전: 2.5
- 활성화: 5
SpeedAngle 지표는 MetaTrader 4 (MT4)를 위한 고급 도구로, 가격 움직임의 각도를 계산하여 동적인 시각적 신호와 사용자 정의 가능한 알림을 제공합니다. 이를 통해 트레이더는 추세 반전과 모멘텀 변화를 신속하게 식별할 수 있습니다.
주요 기능
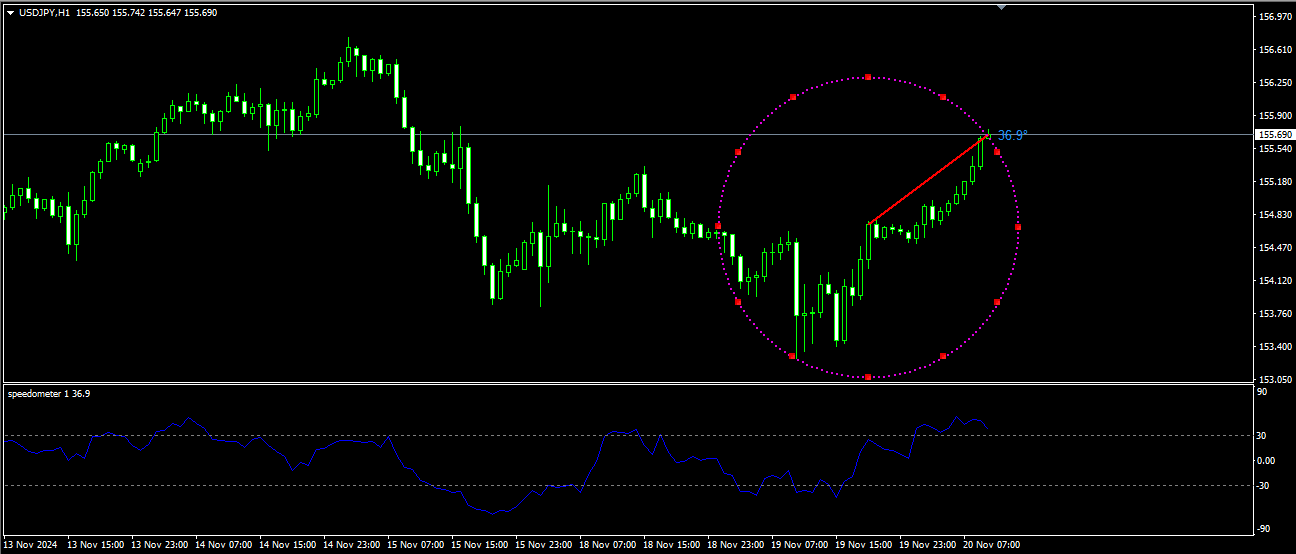
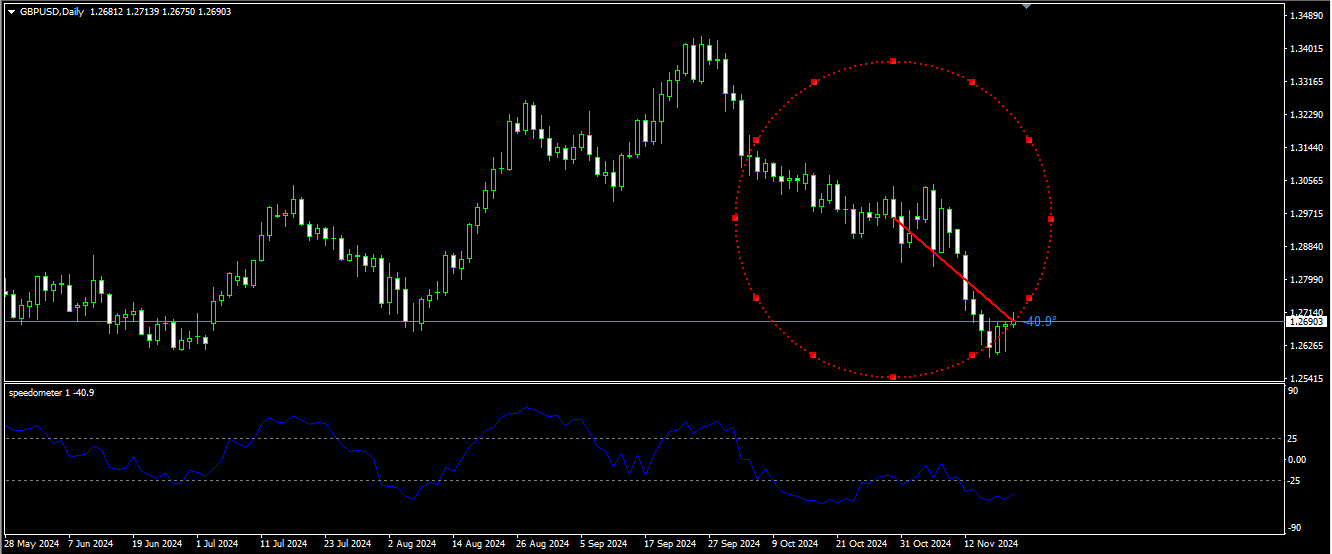
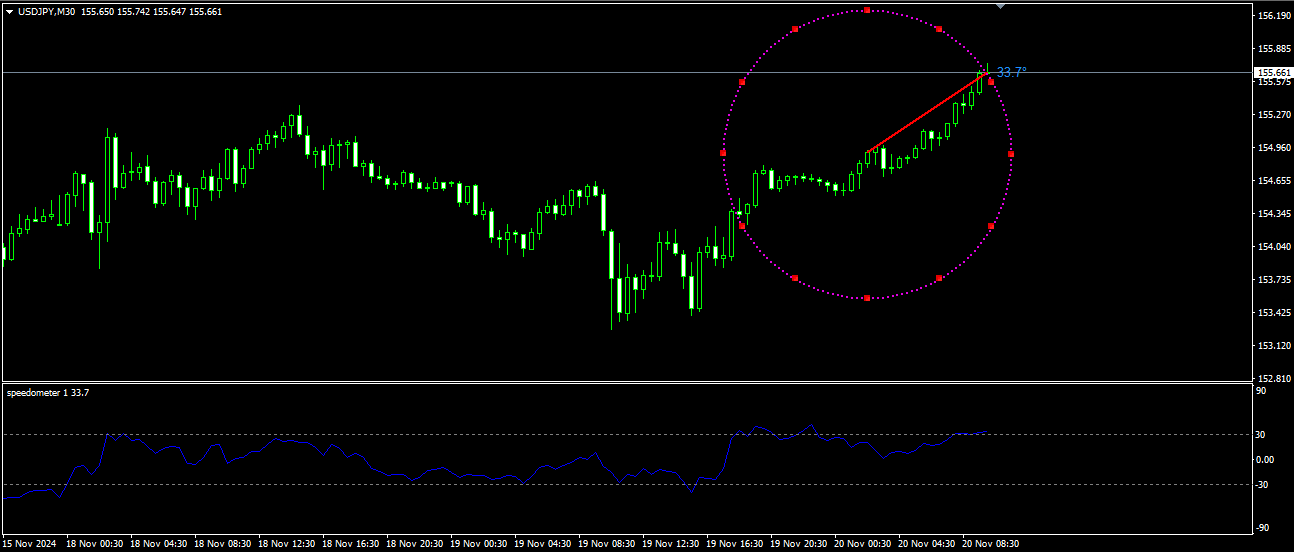
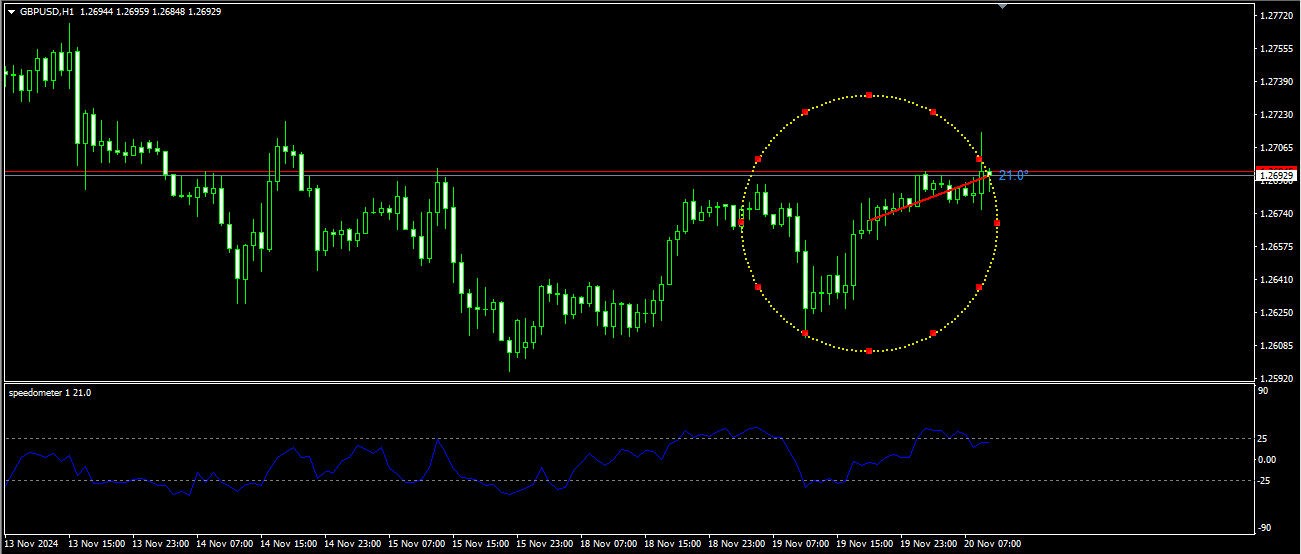
- 각도 기반 추세 분석:
- 사용자 정의 기간을 기반으로 각도를 계산하여 가격의 방향성과 속도를 시각화합니다.
- 동적 시각화:
- 각도 임계값에 따라 색상이 변하는 원을 표시:
- LevelMax 이상: 강한 상승 모멘텀 신호.
- LevelMin 이하: 강한 하락 모멘텀 신호.
- 범위 내: 가격 조정 또는 약한 움직임을 나타냅니다.
- 각도 임계값에 따라 색상이 변하는 원을 표시:
- 사용자 정의 가능한 알림:
- "극단값에서" 또는 "중간값에서" 시나리오를 선택하여 소리, 이메일, 푸시 알림 제공.
- 매수/매도 화살표:
- 매매 신호를 나타내는 선택적 화살표 표시.
- 완전한 사용자 정의 가능:
- 임계값, 색상, 알림 설정 등 조정 가능.
장점
- 시장 분석 단순화:
- 시각적 신호와 알림으로 주요 가격 조건을 빠르게 식별.
- 시간 절약:
- 알림이 기회를 알려주므로 차트를 지속적으로 모니터링할 필요가 없습니다.
- 모든 전략에 적합:
- 스캘핑, 스윙 트레이딩 및 추세 추종 전략을 보완합니다.
입력값 주요 사항
- 계산: 기간( StartBar )과 최대 히스토리 막대 수( MaxBarsHistory )를 정의.
- 시각화: 원과 선의 색상을 사용자 정의.
- 알림: 소리, 이메일 또는 푸시 알림 활성화.
- 임계값: 신호 생성을 위한 LevelMax 및 LevelMin 설정.