Extremely Reversal Signals for MT4
- 지표
- Minh Truong Pham
- 버전: 1.0
- 활성화: 10
Elevate your trading strategy with the Reversal Signals indicator by AlgoAlpha. This advanced tool is designed to pinpoint potential bullish and bearish reversals by analyzing price action and, optionally, volume confirmations. It seamlessly combines reversal detection with trend analysis, giving you a comprehensive view of market dynamics to make informed trading decisions.
Key Features
- 🔎 Price Action Reversal Detection: Identifies potential reversal points by comparing current price movements against historical candle patterns within a customizable lookback period.
- 📊 Volume Confirmation: Optionally integrates volume analysis to confirm the strength of reversal signals, enhancing their reliability.
- 📈 Stepped Moving Average Trend Indicator: Employs a stepped moving average that adjusts at set intervals to reflect underlying market trends.
- ⚙️ Customizable Settings: Tailor the indicator to your trading style with adjustable parameters for lookback periods, confirmation windows, moving average types, and more.
- 🎨 Visual Signals and Trend Coloring: Clear on-chart labels for reversal signals and color-coded trend areas to quickly identify bullish and bearish conditions.
- 🔔 Alerts for Key Market Events: Set up custom alerts for reversal signals and trend shifts to stay ahead of market movements.
Quick Guide to Using the Reversal Signals Indicator:
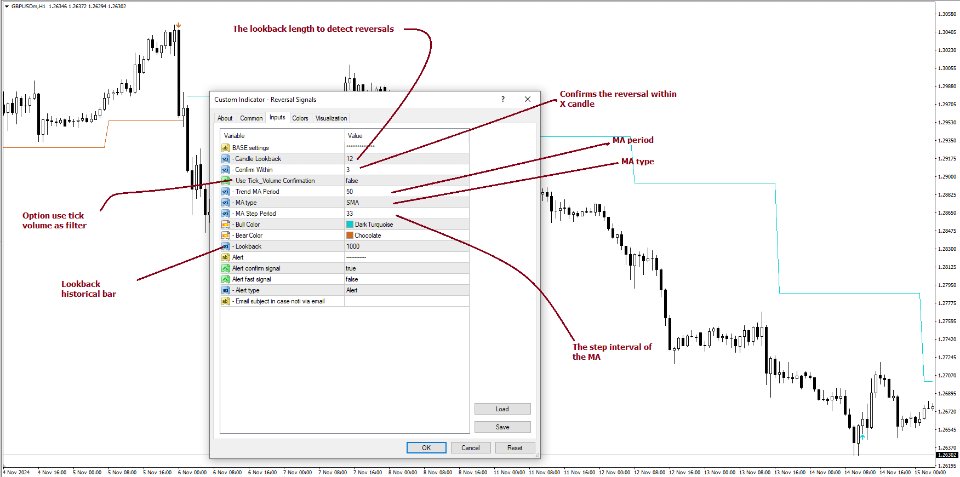
🛠 Add the Indicator: Add the indicator to your favorites by pressing the star icon. Customize settings like Candle Lookback, Confirm Within, and Use Volume Confirmation to fit your trading style.
Figure 1
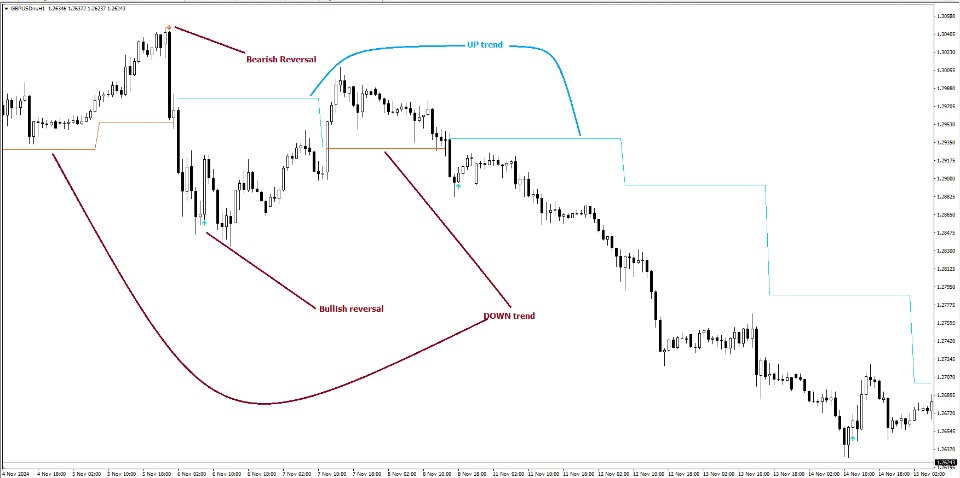
📊 Market Analysis: Observe the "𝓡" labels on the chart indicating bullish and bearish reversal signals. Look for labels below the bars for bullish signals and above the bars for bearish signals. Use the color-filled areas between the stepped moving average and the center line to assess market trends.
Figure 2
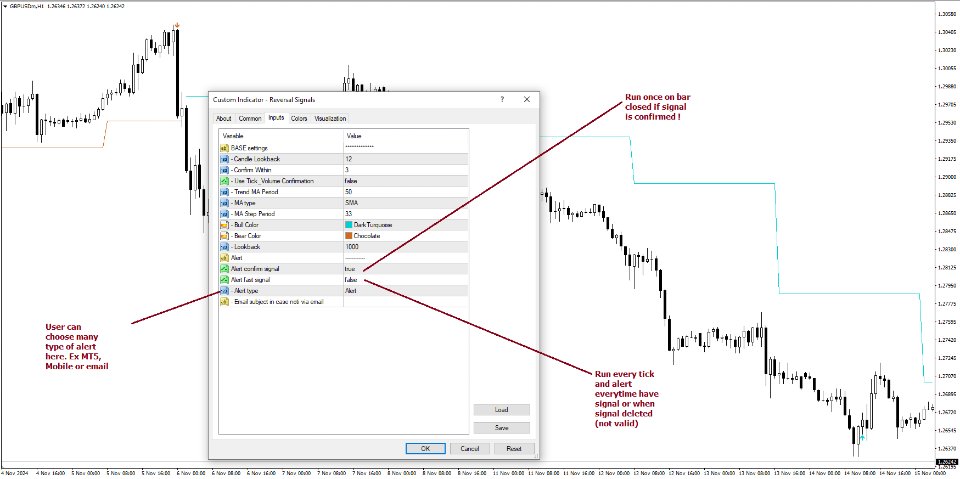
🔔 Alerts: Enable notifications for reversal signals and trend shifts to stay informed about market movements without constantly monitoring the chart.
Figure 3
How It WorksThe Reversal Signals indicator operates by conducting a thorough analysis of price action over a user-defined lookback period. For a bullish reversal, the indicator checks if the current closing price is lower than the lows of the preceding candles within the lookback window, suggesting a potential oversold condition. If this criterion is met, it marks the candle as a potential reversal point and waits for confirmation within a specified number of subsequent candles. Confirmation occurs when the price rises above the high of the identified candle, signaling a bullish reversal. An optional volume confirmation can be enabled to ensure that the reversal is supported by higher-than-average trading volume, adding an extra layer of validation to the signal. The process is mirrored for bearish reversals, where the indicator looks for the closing price exceeding previous highs and awaits confirmation of a downward move.
Complementing the reversal signals, the indicator features a stepped moving average that serves as a dynamic trend indicator. This moving average updates at intervals defined by the MA Step Period and shifts direction based on price crossings. If the price remains above the stepped MA, it indicates a bullish trend, coloring the area between the MA and the center line in green. Conversely, if the price falls below the stepped MA, a bearish trend is signaled, and the area is shaded red. This visual representation helps traders quickly assess the prevailing market trend and align their trading decisions accordingly.
Experience a new level of market insight with the Reversal Signals indicator. Add it to your favourite today and enhance your ability to detect and act on key ma.


