• 미리보기
  • 리뷰
  • 코멘트

NTL Japanese Candle Patterns

Japanese Candle Patterns (JCP) User Guide

Overview and Features

Japanese candlestick patterns, a foundational element of technical analysis, provide traders with visual insights into market psychology. Each pattern represents the battle between bulls and bears, encapsulating critical information about market sentiment, potential reversals, and continuation signals. Developed centuries ago and later popularized by Steve Nison in Japanese Candlestick Charting Techniques, these patterns are now widely recognized tools for assessing market conditions.

This indicator, leveraging the power of the JCP (Japanese Candle Patterns) methodology, assists traders in identifying and acting upon these vital patterns, enhancing both strategy formulation and execution.

Key Features

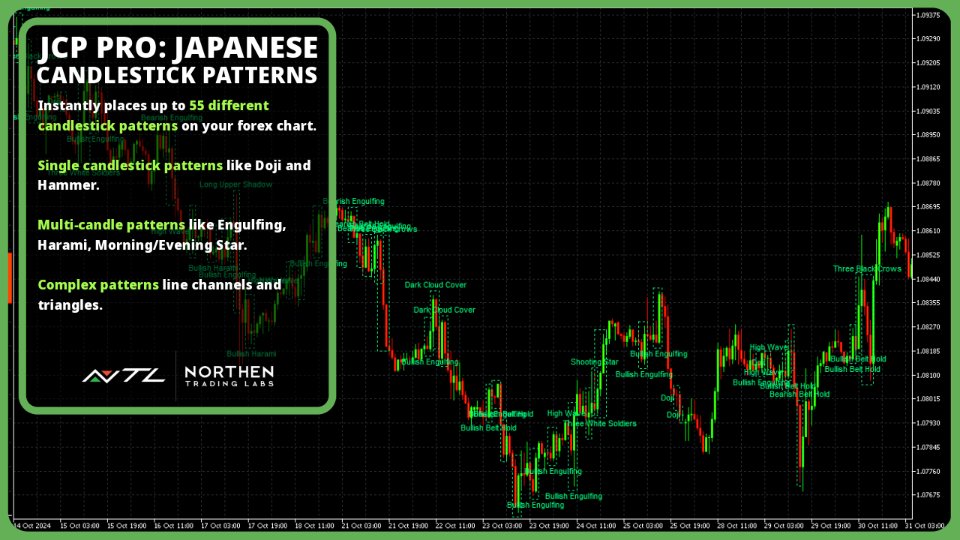
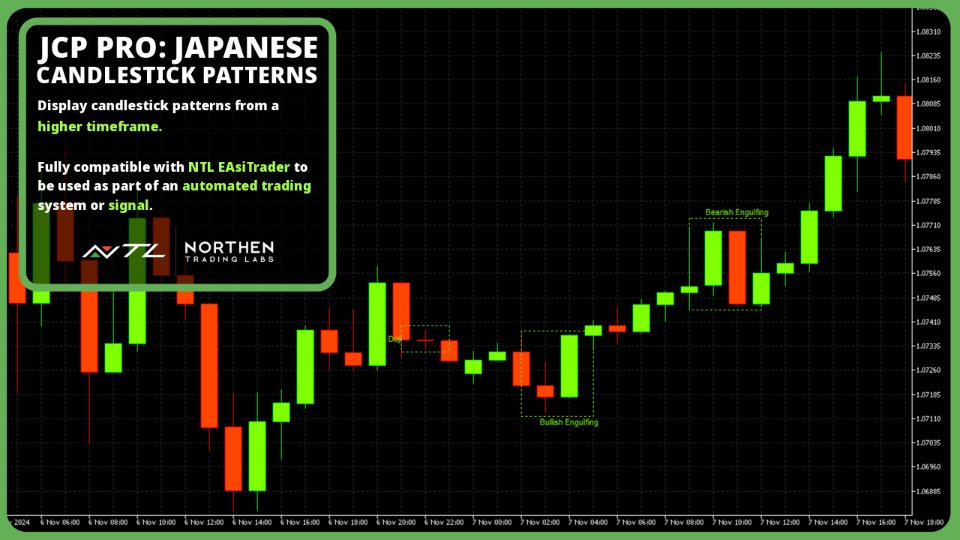
  • Comprehensive Pattern Recognition: Detects 55 well-known candlestick patterns such as the Doji, Hammer, and Engulfing patterns, each marked on the chart for clear visibility and immediate interpretation.

    • Single-Candle Patterns: Patterns like the Hammer, Shooting Star, and Doji.
    • Multi-Candle Patterns: Patterns that unfold over several candles, such as the Engulfing, Harami, and Morning/Evening Star.
    • Complex Patterns: Channels, Triangles, and support/resistance-based patterns which provide insights into broader market structures.
    • Trend Reversals: Patterns like the Hammer, Engulfing, or Doji Star are known for signaling possible reversals in price direction.
    • Continuation Signals: Patterns such as the Rising Three Method or Falling Three Method can indicate that a trend is likely to continue, which is valuable for trend-following strategies.
    • Confirmation of Market Strength: Patterns like the Marubozu, which lack shadows, show strong conviction by buyers or sellers, confirming strength in a given direction.
  • Multi-Timeframe Scanning: Whether trading on the 1-minute chart or the monthly chart, the JCP indicator adapts seamlessly, allowing users to examine patterns across multiple timeframes, from intra-day to long-term perspectives. Note: To use this feature effectively, fully load tick data for your desired timeframe.

  • Reduces Subjectivity: Manual identification of patterns can be subjective, while JCP applies consistent criteria.

  • Improves Efficiency: JCP scans the chart automatically, allowing traders to stay focused on strategic decision-making.

  • Compatible with EAsiTrader EA: Provides signals to NTL EAsiTrader EA for automated trading.

Whether you are a novice or experienced trader, JCP provides a systematic approach to identifying and utilizing candlestick patterns, combining the insights of centuries-old techniques with the power of modern trading tools.

Installation and Settings

Installation

  1. Installing the Indicator:

    • Download the JCP indicator JCP.ex5 file and place it in the Indicators\NTL folder of your MQL5 platform directory. You may need to create folder NTL if it doesn’t already exist.
    • The typical file path is Terminal -> MQL5 -> Indicators -> NTL . Once the file is in this folder, restart the platform to ensure it appears in the Navigator panel.
  2. Applying JCP to the Chart:

    • Open the chart of the symbol and timeframe on which you’d like to use the JCP indicator.
    • Drag the JCP indicator from the Navigator panel (under Indicators\NTL) onto your chart.
    • After adding JCP, you’ll see Inputs that allow you to customize how patterns are displayed, which patterns to include, and more.
  3. Customizing Settings:

    • Access input settings after dragging JCP onto a chart or by double-clicking on the indicator in the Navigator panel or selecting Properties after applying it to the chart.
    • Choose Your Timeframe: Use the Timeframe setting to select the timeframe for pattern analysis. For example, if your chart timeframe is M30 but you set Timeframe to H1 , JCP will identify patterns based on hourly data but display them on the 30-minute chart. Selecting timeframes lower than the chart timeframe is not possible, e.g. M10 timeframe on a M30 timeframe chart.
    • Select Patterns: In the input settings, enable or disable specific patterns based on your trading strategy. For example, if you focus on reversal signals, you might prioritize patterns like the Hammer or Engulfing patterns.
    • Pattern Customization: If you have specific preferences for pattern definitions, such as stricter criteria for Doji or Hammer patterns, adjust the relevant parameters in the Standard Patterns Definition Settings section.
    • Trend Confirmation Settings: For traders using trend-following strategies, the TrendConfirmation setting lets you filter patterns based on alignment with the ADX indicator. Adjust the ADXPeriod and ADXTrendLevel settings to fine-tune this feature.
  4. Verifying JCP’s Functionality on the Chart:

    • Once configured, observe how JCP displays patterns on the chart. Patterns appear with abbreviations or symbols, making it easy to spot key signals without clutter.
    • Tip: Test different configurations and timeframes in a demo environment to find the setup that best complements your trading strategy.
  5. Saving Your Custom JCP Template:

    • To avoid reconfiguring JCP each time, save your preferred settings as a template. Right-click on the chart, select Template -> Save Template, and name it something descriptive, like JCP_Custom .
    • You can load this template on other charts to quickly apply your JCP settings.

Settings

Timeframe

The Timeframe setting allows you to select the specific timeframe from which JCP will analyze candlestick patterns, regardless of the chart’s current timeframe. This feature is helpful if you want to analyze patterns on a higher timeframe than the one currently displayed, giving you a multi-timeframe perspective. Timeframe must be greater than or equal to the chart’s timeframe.

  • Example Use Case:

    • Let’s say your chart’s timeframe is set to M15 (15 minutes), but you want to identify patterns based on hourly (H1) data. Set the Timeframe input to H1 . JCP will then scan the data of each completed H1 candle and display any detected patterns on the M15 chart.
  • Common Applications:

    • Timeframe Analysis: Setting a higher timeframe (e.g., H4 on an H1 chart) can help capture more stable, long-term patterns that are less affected by noise.
  • Recommendation:

    • Match the timeframe to your trading strategy. For instance, trend traders might prefer higher timeframes (H4, D1), while intraday traders may choose M15 or M30 for quicker signals.

Pattern Types (CSV List)

This setting is a powerful feature that lets you customize which patterns JCP will scan for and display. It accepts a comma-separated list of pattern types, enabling you to fine-tune the indicator based on your trading strategy and preferred signals.

  • Full Pattern List:

    • AbandonedBabyBottom , AbandonedBabyTop , AscendingChannel , AscendingTriangle , BearishBeltHold , BearishCounterAttack , BearishEngulfing , BearishHarami , BearishHLinePin , BearishSeparating , BullishBeltHold , BullishCounterAttack , BullishEngulfing , BullishHarami , BullishHLinePin , BullishSeparating , DarkCloudCover , DescendingChannel , DescendingTriangle , Doji , DojiStar , DragonFlyDoji , EveningStar , FallingThreeMethod , FallingWindow , FlatLowerBody , FlatUpperBody , GravestoneDoji , Hammer , HangingMan , HighWave , InvertedHammer , LongLeggedDoji , LongLowerShadow , LongUpperShadow , Marubozu , MorningStar , Pennant , PiercingPattern , Rectangle , ResistanceLine , RisingThreeMethod , RisingWindow , ShavenBottom , ShavenHead , ShootingStar , SpinningTop , SupportLine , ThreeBlackCrows , ThreeWhiteSoldiers , TowerBottom , TowerTop , TweezerTop , TweezerBottom , UpsideGapTwoCrows .
  • Example Use Case:

    • To limit the indicator to specific patterns, enter only the desired patterns in Pattern Type setting. For example, setting Hammer, Doji, BullishEngulfing means JCP will only scan for and display these three patterns.
  • Tips for Customization:

    • Strategy-Specific Patterns:
      • For reversal strategies, you might prioritize patterns like Hammer , ShootingStar , Engulfing , and Doji .
      • For trend continuation, consider RisingThreeMethod , FallingThreeMethod , or Marubozu .
    • Limit Pattern Quantity: Using fewer patterns can help reduce visual clutter on the chart and improve chart readability, especially on lower timeframes.
    • Testing Different Combinations: Experiment with various pattern combinations to find setups that yield the most reliable signals for your trading style.

By adjusting Timeframe and Pattern Types thoughtfully, you can better align JCP’s analysis with your trading approach, whether it’s short-term scalping or long-term trend trading.

Use Strict Criteria

Tightens criteria for identifying patterns (e.g., for Doji and Hammer).

Big Body

Defines a candle’s “Big Body” size in terms of a ratio of the candle’s average body height. The average body height is defined as the average height of a candle’s body over a 14 candle period.

Big Candle

Defines a candle’s “Big Candle” size in terms of a ratio of the candle’s average whole height. The average candle height is defined as the average height of a whole candle over a 14 candle period.

Doji Body

Defines the maximum body size of a Doji pattern in terms of a ratio of the candle’s average body height. The average body height is defined as the average height of a candle’s body over a 14 candle period.

Small Body

Defines a candle’s “Small Body” size in terms of a ratio of the candle’s average body height. The average body height is defined as the average height of a candle’s body over a 14 candle period.

Small Candle

Defines a candle’s “Small Candle” size in terms of a ratio of the candle’s average whole height. The average candle height is defined as the average height of a whole candle over a 14 candle period.

Window Min Gap

Defines the minimum gap for a Falling or Rising Window pattern in terms of a ratio of the candle’s average whole height. The average candle height is defined as the average height of a whole candle over a 14 candle period.

Complex Pattern Tolerances

Define tolerances for channels, rectangles, and triangles as percentages of candle body height.

Trend Confirmation

Displays only patterns that align with the ADX-based trend.

ADX Period

Sets the ADX calculation period for smoothing trend identification.

ADX Trend Level

Sets the minimum ADX threshold to validate trends.

Use Symbol Names

When this setting is true the pattern’s abbreviated name is shown above or below the pattern on the chart. When this setting is false the pattern’s full name is shown above or below the pattern on the chart.

Using the Indicator

The following candle patterns are listed showing their full name, followed by their abbreviated name. The signs have the following meaning:

  • +: Bullish Pattern
  • -: Bearish Pattern
  • ++: Bullish Reversal Pattern
  • : Bearish Reversal Pattern

Standard Candle Patterns 1-2 (For a complete list see the online manual)

  1. Abandoned Baby Bottom (++ABB)
  • Description: The Abandoned Baby Bottom is a rare bullish reversal pattern, often appearing at the end of a downtrend. It consists of three candles: a strong bearish candle, a small-bodied Doji with a gap down, and a bullish candle with a gap up.
  • Pattern Criteria:
    • The first candle is bearish, reflecting strong selling pressure.
    • The second candle is a Doji with a gap below the first candle, signifying indecision in the market.
    • The third candle is bullish and opens with a gap above the Doji, showing that buyers have stepped in.
  • Trading Significance:
    • This pattern suggests that a downtrend is potentially reversing as buyers regain control, often signaling a shift in momentum toward the upside.
    • The two gaps (before and after the Doji) are key elements that strengthen the pattern’s reliability.
  • Interpretation Tips:
    • This pattern is most effective in strongly oversold markets where buying pressure is expected.
    • Confirmation with additional indicators like RSI (indicating oversold conditions) or volume can improve signal reliability.
  1. Abandoned Baby Top (–ABT)
  • Description: The Abandoned Baby Top is the bearish counterpart to the Abandoned Baby Bottom, typically appearing at the end of an uptrend. It signals a potential reversal to the downside.
  • Pattern Criteria:
    • The first candle is bullish, indicating strong buying momentum.
    • The second candle is a Doji with a gap above the first candle, signaling indecision and potential exhaustion.
    • The third candle is bearish and opens with a gap below the Doji, suggesting that sellers are regaining control.
  • Trading Significance:
    • This pattern often indicates a shift in sentiment from bullish to bearish, signaling that an uptrend may be ending.
    • The gaps on either side of the Doji enhance its reliability as a reversal signal.
  • Interpretation Tips:
    • This pattern is particularly valuable in overbought conditions, where a correction is anticipated.
    • Look for confirmation through volume analysis (increasing on the third candle) or with other trend indicators like ADX.

Complex Patterns 1-2 (For a complete list see the online manual)

  1. Ascending Channel (AC)
  • Description: The Ascending Channel is a bullish continuation pattern formed by two parallel upward-sloping trendlines, encompassing a series of higher highs and higher lows. This pattern indicates that the price is trending upward within a defined range and often signals continuation until a breakout or breakdown occurs.
  • Pattern Criteria:
    • The pattern consists of two parallel trendlines sloping upward, with price moving between the lines.
    • The price action includes a series of higher highs and higher lows, touching both the upper resistance and lower support trendlines.
  • Trading Significance:
    • This pattern is typically a bullish continuation signal, as the price gradually rises within the channel.
    • A breakout above the upper trendline suggests an acceleration in the uptrend, while a breakdown below the lower trendline may signal a reversal.
  • Interpretation Tips:
    • Traders can enter long positions near the lower trendline (support) and take profits near the upper trendline (resistance).
    • For confirmation of a breakout, watch for increased volume as the price moves above the upper trendline. If the price breaks below the lower trendline, it could signal a trend reversal.
  1. Ascending Triangle (AT)
  • Description: The Ascending Triangle is a bullish continuation pattern that forms with a horizontal resistance line and an upward-sloping support line. It signifies that the price is being compressed, with buyers becoming increasingly aggressive, often leading to a breakout above the resistance level.
  • Pattern Criteria:
    • The pattern consists of a horizontal resistance level, indicating that sellers are holding the price at a consistent level.
    • The support level slopes upward, showing that buyers are pushing the price higher, forming a series of higher lows.
  • Trading Significance:
    • The Ascending Triangle generally indicates a bullish continuation, as it shows building buying pressure against a static resistance level.
    • A breakout above the resistance line suggests that buyers have overwhelmed sellers, potentially leading to a strong upward move.
  • Interpretation Tips:
    • Ascending Triangles are more effective within an uptrend, where they signal continuation.
    • Volume often spikes on a breakout above the resistance level, adding strength to the bullish signal. Traders can enter on the breakout and set a target by measuring the height of the triangle and projecting it from the breakout point.

Advanced Usage and Strategy Integration

Indicator Buffers

  • Buffer 0: Candle Pattern Data
    • Bits 0-15: Pattern Type
    • Bits 16-19: Pattern Width In Bars
  • Buffer 1: Signal Flag values (Signal)
    • If (PatternTrendType Is Bearish Or PatternTrendType Is TopReversal Or PatternTrendType Is MajorTopReversal) Then Signal = Bearish
    • If (PatternTrendType Is Bullish Or PatternTrendType Is BottomReversal Or PatternTrendType Is MajorBottomReversal) Then Signal = Bullish

Strengthening Signals with Indicators

While Japanese Candlestick Patterns (JCP) can offer valuable insights into market psychology, their reliability and predictive power increase significantly when used in conjunction with other technical indicators. Each candlestick pattern provides a snapshot of market sentiment, but indicators like Moving Averages, RSI, and Bollinger Bands help confirm and strengthen these signals. By combining JCP with indicators, traders can reduce false signals, improve entry and exit timing, and make more informed decisions in both trending and volatile markets.

  1. Moving Averages (MA)
    Moving Averages help smooth out price data and highlight trend direction. Here’s how to integrate them with candlestick patterns:
  • Bullish Crossover and Bullish Patterns: When a shorter-term MA (e.g., 10-period) crosses above a longer-term MA (e.g., 50-period), it signals potential upward momentum. If this crossover aligns with a bullish pattern like a Hammer or Engulfing Bullish, it strengthens the likelihood of a trend reversal.

  • Bearish Patterns Below MA: Bearish patterns such as the Shooting Star or Bearish Engulfing forming below the MA suggest continued downward pressure, especially if the price remains below both short and long MAs.

    Example: In a downtrend, if the price briefly rises to test the 50-period MA and forms a Bearish Engulfing pattern, this combination can confirm a selling opportunity with higher confidence.

  1. Relative Strength Index (RSI)
    RSI measures the strength of price changes and is especially useful for identifying overbought or oversold conditions, enhancing JCP patterns:
  • Overbought Conditions with Bearish Patterns: If RSI is above 70 and a bearish pattern like Evening Star forms, it suggests a strong potential for a price reversal.

  • Oversold Conditions with Bullish Patterns: Similarly, an RSI below 30 alongside a Morning Star or Hammer indicates that buyers may soon gain control, suggesting a buying opportunity.

    Example: Suppose RSI has entered the oversold zone, and a Hammer pattern forms. This combination signals an opportune moment for a potential trend reversal, especially if it aligns with a support level.

  1. Bollinger Bands
    Bollinger Bands help gauge volatility, with price movements near the bands often signaling potential reversals:
  • Reversal Patterns at Upper Band: When the price touches the upper band and forms a bearish pattern like Shooting Star or Bearish Engulfing, it suggests that the asset might be overextended, signaling a sell opportunity.

  • Reversal Patterns at Lower Band: Conversely, if the price reaches the lower band and forms a bullish pattern like Hammer or Bullish Engulfing, it signals a potential reversal upwards.

    Example: During a period of high volatility, the price touches the upper Bollinger Band, followed by a Shooting Star. This often indicates a strong selling signal, especially if the price starts moving back toward the middle band.

Using JCP in combination with other indicators is essential for refining and validating trade signals. Indicators help filter out noise and reduce the impact of false signals that may appear from isolated patterns, thus providing a more holistic view of market conditions. This approach allows traders to make well-rounded decisions, improving the effectiveness of the JCP indicator as part of a comprehensive trading strategy.

Insights

Japanese Candlestick Patterns provide traders with nuanced insights into market psychology, yet some of their deeper interpretations are often overlooked. Here are advanced insights for applying JCP theory effectively:

  1. Psychological Layers of Reversal Patterns
    Reversal patterns like the Hammer and Shooting Star are more than mere entry signals; they reveal shifts in trader psychology. For instance, a Hammer forming after a downtrend indicates that buyers managed to regain control after a period of selling pressure, which might signal a bottom. Conversely, a Shooting Star shows buyer exhaustion at a peak, with sellers starting to dominate. Understanding the shift in momentum through these patterns allows traders to gauge when a trend may be reversing.

    • Example: In a downtrend, a Hammer forming near a key support level suggests a potential reversal. Combining this with oversold conditions (e.g., an RSI below 30) can provide a strong buy signal.
  2. The Power of Context in Continuation Patterns
    Continuation patterns like Rising Three Methods or Falling Three Methods suggest a temporary pause before the prevailing trend resumes. Observing these patterns in the context of trend strength can reveal the commitment of buyers or sellers. For example, the Rising Three Method in an uptrend reflects a momentary consolidation where sellers briefly control the market, but the trend resumes as buyers overpower them.

    • Example: If the Rising Three Method occurs after a period of high volume, it reinforces the likelihood of trend continuation, as the brief pause indicates that buyers are recharging before pushing prices higher.
  3. Complex Patterns for Detecting Breakouts and Reversals
    Patterns like Ascending Triangles or Descending Triangles provide unique opportunities by signaling a buildup of energy before a breakout. These patterns form as buyers and sellers become increasingly decisive, often leading to an explosive price move once a key level is breached.

    • Example: An Ascending Triangle forming in an uptrend near a resistance level with high volume is a strong signal of a breakout. Measuring the height of the triangle and projecting it from the breakout point offers a potential price target, allowing traders to set informed profit levels.
  4. Volume as a Confirmation Tool
    Volume plays a crucial role in confirming the reliability of candlestick patterns. Increased volume during the formation of a pattern—such as a Bearish Engulfing—can indicate stronger market commitment and enhance the signal’s reliability.

    • Example: A Bullish Engulfing pattern at a support level, accompanied by rising volume, signifies that buyers are taking control, increasing the likelihood of a reversal.
  5. Multi-Timeframe Analysis for Higher Accuracy
    Using candlestick patterns across multiple timeframes adds another dimension to their effectiveness. Patterns on higher timeframes, such as daily or weekly charts, often carry more weight, while shorter timeframes like 5-minute charts can fine-tune entry and exit points.

    • Example: A Bullish Engulfing on a daily chart signals a potential trend reversal. When confirmed by a smaller timeframe, like an hourly Hammer, it provides a more precise entry point with reduced risk.

By considering these advanced interpretations, traders can better leverage Japanese Candlestick Patterns as part of a holistic strategy, enhancing both the timing and reliability of trading decisions.
추천 제품
Trade smarter, not harder: Empower your trading with Harmonacci Patterns This is arguably the most complete harmonic price formation auto-recognition indicator you can find for the MetaTrader Platform. It detects 19 different patterns, takes fibonacci projections as seriously as you do, displays the Potential Reversal Zone (PRZ) and finds suitable stop-loss and take-profit levels. [ Installation Guide | Update Guide | Troubleshooting | FAQ | All Products ] It detects 19 different harmonic pri
Introduction to X3 Chart Pattern Scanner X3 Cherart Pattern Scanner is the non-repainting and non-lagging indicator detecting X3 chart patterns including Harmonic pattern, Elliott Wave pattern, X3 patterns, and Japanese Candlestick patterns. Historical patterns match with signal patterns. Hence, you can readily develop the solid trading strategy in your chart. More importantly, this superb pattern scanner can detect the optimal pattern of its kind. In addition, you can switch on and off individu
Ultimate Candle Patterns
Wojciech Daniel Knoff
This is a multi-symbol and multi-timeframe table-based indicator designed for a candlestick patterns detection with 46 patterns for META TRADER 5. Each formation has own image for easier recognition. Here you find most popular formations such as "Engulfing", "Hammer", "Three Line Strike", "Piercing" or Doji - like candles. Check my full list of patterns on my screenshots below. Also you can not only switch all bearish or bullish patterns from input, but also select formation for a specified symb
BRIEF INTRODUCTION   : This Panel is made for Volatility 75 (1s) Index  and  Volatility 75 Index  Synthetic indices instruments. It offers an ultimate and complete  auto trading with an optional money management Controls. This application is an automated panel who works on strategy tester. It is equiped with an automatic indicator attached in the bottom of the Panel.  There are another functionalities like  Martingale strategy  and a  range sequence  detection , it is triggered automatically w
Owl Smart Levels MT5
Sergey Ermolov
4 (29)
MT4 버전  |  FAQ Owl Smart Levels Indicator 는 Bill Williams 의 고급 프랙탈, 시장의 올바른 파동 구조를 구축하는 Valable ZigZag, 정확한 진입 수준을 표시하는 피보나치 수준과 같은 인기 있는 시장 분석 도구를 포함하는 하나의 지표 내에서 완전한 거래 시스템입니다. 시장과 이익을 취하는 장소로. 전략에 대한 자세한 설명 표시기 작업에 대한 지침 고문-거래 올빼미 도우미의 조수 개인 사용자 채팅 ->구입 후 나에게 쓰기,나는 개인 채팅에 당신을 추가하고 거기에 모든 보너스를 다운로드 할 수 있습니다 힘은 단순함에 있습니다! Owl Smart Levels 거래 시스템은 사용하기 매우 쉽기 때문에 전문가와 이제 막 시장을 연구하고 스스로 거래 전략을 선택하기 시작한 사람들 모두에게 적합합니다. 전략 및 지표에는 눈에 보이지 않는 비밀 공식 및 계산 방법이 없으며 모든 전략 지표는 공개되어 있습니다. Owl Smart Levels를 사
Scan pattern
VLADISLAV AKINDINOV
The indicator is designed to help in making a decision on the direction of trading (buy or sell). It is a history scanner that searches for matches of the current pattern (combination of several current bars) with historical data in percentage terms by the relative vertical position of candles relative to each other, the size of each candle, the size of the candle body and the candle shadows. In history, the matches found are indicated by vertical lines on the candle of the beginning of the soug
Blahtech Market Profile MT5
Blahtech Limited
5 (10)
Was: $249  Now: $149   Market Profile defines a number of day types that can help the trader to determine market behaviour. A key feature is the Value Area, representing the range of price action where 70% of trading took place. Understanding the Value Area can give traders valuable insight into market direction and establish the higher odds trade. It is an excellent addition to any system you may be using. Inspired by Jim Dalton’s book “Mind Over Markets”, this indicator is designed to suit the
Premium level Pro
Dmitriy Kashevich
Premium level is a unique indicator with more than 80% accuracy of correct predictions! This indicator has been tested for more than two months by the best Trading Specialists! The author's indicator you will not find anywhere else! From the screenshots you can see for yourself the accuracy of this tool! 1 is great for trading binary options with an expiration time of 1 candle. 2 works on all currency pairs, stocks, commodities, cryptocurrencies Instructions: As soon as the red arrow app
BRIEF INTRODUCTION   : This Panel is made for  Volatility 10 (1s) Index and Volatility 10 Index  Synthetic indices instruments. It offers an ultimate and complete  auto trading with an optional money management Controls. This application is an automated panel who works on strategy tester. It is equiped with an automatic indicator attached on the bottom of the Panel.  There are another functionalities like  Martingale strategy  and a  range sequence  detection , it triggers automatically when t
PZ Penta O MT5
PZ TRADING SLU
The Penta-O is a 6-point retracement harmonacci pattern which usually precedes big market movements. Penta-O patterns can expand and repaint quite a bit. To make things easier this indicator implements a twist: it waits for a donchian breakout in the right direction before signaling the trade. The end result is an otherwise repainting indicator with a very reliable trading signal. The donchian breakout period is entered as an input. [ Installation Guide | Update Guide | Troubleshooting | FAQ | A
SolarTrade Suite Financial Indicator: Jupiter Market Indicator - 금융 시장의 세계에서 신뢰할 수 있는 가이드! 이 트렌드 지표는 특별하고 혁신적이며 진보된 알고리즘을 사용하여 가치를 계산하며, 보기에도 좋은 디자인을 가지고 있습니다. 이 지표의 판독값은 이해하기 매우 쉽습니다. 파란색은 매수, 빨간색은 매도입니다. 설명 하단에서 SolarTrade Suite 시리즈의 다른 제품을 확인하세요. 투자와 금융 시장의 세계를 자신 있게 탐색하고 싶으신가요? SolarTrade Suite Financial Indicator: Jupiter Market Indicator는 정보에 입각한 투자 결정을 내리고 수익을 늘리는 데 도움이 되도록 설계된 혁신적인 소프트웨어입니다. SolarTrade Suite Financial Indicator: Jupiter Market Indicator의 장점: - 정확한 예측: 당사 지표는 고급 알고
KopierMaschine - локальный копировщик сделок между различными счетами MetaTrader 4 и MetaTrader 5 в любом направлении расположенных на одном компьютере с интуитивно понятным интерфейсом. Направления копирования: MT4 --> MT5 MT4 --> MT4 MT5 --> MT5 MT5 --> MT4 для копирования между терминалами MetaTrader 4 и   MetaTrader   5 необходимо приобрести версию продукта   KopierMaschine  для    MetaTrader  4 Особенности Программа работает в двух режимах Master и Slave На один подчиненный счет можно копир
Price Breakout pattern Scanner is the automatic scanner for traders and investors. It can detect following patterns automatically from your chart. Head and Shoulder - Common tradable pattern. Reverse Head and Shoulder - This pattern is the reverse formation of the Head and Shoulder. Double Top - When the price hits resistance level twice and decline toward the support level, the trader can anticipate sudden bearish breakout through the support level. Double Bottom - The double bottom pattern is
Incinerat8
Paulos Ngwenya
This algorithm uses real time data to generate signals with an accuracy rate of 80%. It shows entries and where you should place both the stoploss and the take profit for each trade. It determines trend! It can even help you to become a signal provider! And it can generate up to 8 signals a day! You get access to a free forex trading community  Operates on any broker compatible to synthetic indices and forex   if you need any assistance whatsapp +2774 35 35 744 or telegram link @pipsempire01
Monster Harmonics Indicator is a harmonic pattern indicator. It recognizes Gartley, Bat, Crab, Butterfly, Cypher, White Swan, Black Swan, Shark and AB=CD patterns. Projected patterns that are not yet completed are recognized, too. Monster even shows the PRZ (Potential Reversal Zone). Users can add their own user defined patterns to Monster. Besides the current pattern, Monster also shows all patterns in the symbols history. Monster will provide alerts for developing patterns. Introduced by H.M.
Forex traders often observe increased market activity near Supply and Demand zones, which are levels formed based on zones where strong price movements have previously occurred. The Supply Demand Strong Weak Confirm Indicator utilizes fractals and the ATR indicator to identify and plot support and resistance zones on the price chart. These zones are categorized as follows: - Weak: significant high and low points in the trend. - Untested: crucial turning points in the price chart that the pric
Noize Absorption Index
Ekaterina Saltykova
Noize Absorption Index - is the manual trading system that measures the difference of pressure between bears forces and bulls forces. Green line - is a noize free index that showing curent situation. Zero value of index shows totally choppy/flat market.Values above zero level shows how powerfull bullish wave is and values below zero measures bearish forces.Up arrow appears on bearish market when it's ready to reverse, dn arrow appears on weak bullish market, as a result of reverse expectation.
The diamond top and bottom are reversal patterns. It represents a rally to a new high with a drop to a support level followed by a rally to make a new high and a quick decline, breaking the support level to make a higher low. The bounce from the higher low is then followed by a rally, but making a lower high instead. Once this behavior is identified, prices then break the trend line connecting the first and second lows and start to decline further. You can find MT4 version hier Indicator shows
MSnR Lines
Pierre Paul Amoussou
MSnR Lines 는 차트에 서포트 및 저항 수준을 표시하기 위한 사용자 정의 지표입니다. 이러한 수준은 말레이시아 서포트 및 저항 이론에 기반하여 영역이 아닌 선 차트의 피크와 밸리에서 유도된 특정 가격 수준으로 정의됩니다. 특징: A-Level, V-Level 및 갭 레벨의 세 가지 유형의 수준. 수준에 대한 신선도 표시: 신선한 수준은 신선하지 않은 수준보다 중요합니다. 신선한 및 신선하지 않은 수준을위한 사용자 정의 가능한 색상 및 스타일. 신선한 수준 또는 모든 수준만 표시하는 옵션. 조정 가능한 회고 기간 및 현재 가격 위 아래의 수준 수. 다중 시간 프레임 지원. 사용 방법: 트레이더는 거래 결정을 위해 잠재적인 지원 및 저항 수준을 식별하기 위해 MSnR Lines를 사용할 수 있습니다. 신선한 수준은 보다 중요하며 더 나은 거래 기회를 제공할 수 있습니다.
Unlock powerful breakout opportunities The 123 Pattern is one of the most popular, powerful and flexible chart patterns. The pattern is made up of three price points: a bottom, a peak or valley, and a Fibonacci retracement between 38.2% and 71.8%. A pattern is considered valid when the price breaks beyond the last peak or valley, moment at which the indicator plots an arrow, rises an alert, and the trade can be placed. [ Installation Guide | Update Guide | Troubleshooting | FAQ | All Products ]
Atomic Analyst MT5
Issam Kassas
4.32 (19)
우선적으로 언급할 점은이 거래 지표가 다시 그리지 않고 지연되지 않으며 이를 통해 수동 및 로봇 거래 모두에 이상적이라는 점입니다. 사용자 매뉴얼: 설정, 입력 및 전략. Atomic Analyst는 가격의 강도와 모멘텀을 활용하여 시장에서 더 나은 이점을 찾는 PA Price Action Indicator입니다. 고급 필터를 장착하여 잡음과 거짓 신호를 제거하고 거래 잠재력을 높이는 데 도움이 됩니다. 복잡한 지표의 다중 레이어를 사용하여 Atomic Analyst는 차트를 스캔하고 복잡한 수학적 계산을 간단한 신호와 색상으로 변환하여 초보 트레이더가 이해하고 일관된 거래 결정을 내릴 수 있도록합니다. "Atomic Analyst"는 새로운 및 경험이 풍부한 트레이더를위한 종합적인 거래 솔루션입니다. 프리미엄 지표와 최고 수준의 기능을 하나의 거래 전략에 결합하여 모든 종류의 트레이더에 대한 다재다능한 선택지가되었습니다. 인트라데이 거래 및 스캘핑 전략 : 빠르고 정확한 일일
Introduction to Chart Pattern MT Chart Pattern MT is a chart pattern scanner to detect the triangle pattern, falling wedge pattern, rising wedge pattern, channel pattern and so on. Chart Pattern MT uses highly sophisticated chart pattern detection algorithm. However, we have designed it in the easy to use with intuitive user interface. Chart Pattern MT will show all the patterns in your chart in the most efficient format for your trading. You do not have to do tedious manual pattern detection an
지표에 대하여 이 지표는 금융 상품의 종가에 대한 몬테카를로 시뮬레이션을 기반으로 합니다. 몬테카를로는 통계적 기법으로, 이전에 관찰된 결과에 기반한 랜덤 숫자를 사용하여 다양한 결과가 나올 확률을 모델링하는 데 사용됩니다. 어떻게 작동하나요? 이 지표는 과거 데이터를 바탕으로 시간에 따른 랜덤 가격 변화를 모델링하여 특정 종목에 대한 여러 가격 시나리오를 생성합니다. 각 시뮬레이션은 종가 변동을 반영하기 위해 랜덤 변수를 사용하여, 주어진 기간 동안 미래 시장 움직임을 효과적으로 모방합니다. 몬테카를로 시뮬레이션의 장점 - 몬테카를로 시뮬레이션은 다양한 미래 시나리오에 대한 테스트를 통해 여러 거래 전략의 리스크를 분석하는 데 도움을 줍니다. - 희귀한 극단적 사건(꼬리 위험)을 포함하여 다양한 시장 상황에서 전략의 성과를 확인할 수 있습니다. - 단일 예측에 의존하지 않고, 몬테카를로는 관련 확률과 함께 잠재적 결과의 범위를 제공합니다. 이는 수익 또는 손실 가능성을 이해하는
Precision trading: leverage wolfe waves for accurate signals Wolfe Waves are naturally occurring trading patterns present in all financial markets and represent a fight towards an equilibrium price. These patterns can develop over short and long-term time frames and are one of the most reliable predictive reversal patterns in existence, normally preceding strong and long price movements. [ Installation Guide | Update Guide | Troubleshooting | FAQ | All Products ] Clear trading signals Amazingly
Trading Utility for Forex Currency Pairs Only not for Gold  Functions Auto Lot Calculation based on Risk Auto stoploss  Auto TakeProfit Breakeven Auto Close Half % Close in percentage with respect to the PIPs Pending Orders BuyLimit Sell Limit with distances BuyStop Sell Stop    with distances Trading Informations Risk in percentage For Multiple trades Combine Takeprofit and Combine Stoplosses
Better RSI MT5
KO PARTNERS LTD
This Indicator enhances the default Relative Strength Index (RSI) by introducing several improvements. First, it visually highlights overbought and oversold regions by changing the RSI color from white to red. Second, it includes additional reference lines at 20, 40, 50, 60, and 80, providing a clearer framework for assessing RSI values. The most notable feature is the use of the middle 50-line to indicate the current market cycle. The color of the 50-line dynamically reflects the cycle: green f
Candlestick Pattern Scanner is a multi-timeframe and multi-symbol dashboard and alert system that checks all timeframes and currency pairs for different candlestick patterns that are formed in them. Scanner is integrated   with support and resistance zones so you can check the candlestick patterns in most important areas of the chart to find breakout and reversal patterns in the price chart. Download demo version   (works on M4,M6,M12,H3,H8 timeframes and 20 symbols of Market Watch window) Read
Your Trend Friend
Luigi Nunes Labigalini
5 (1)
The trend is your friend! Look at the color of the indicator and trade on that direction. It does not  repaint. After each candle is closed, that's the color of the trend. You can focus on shorter faster trends or major trends, just test what's most suitable for the symbol and timeframe you trade. Simply change the "Length" parameter and the indicator will automatically adapt. You can also change the color, thickness and style of the lines. Download and give it a try! There are big movements w
새로운 통합 지표 - 3 in 1 시장 분석과 투자 전략을 향상시킬 거래 도구를 찾고 계십니까? 저희는 최고의 지표 세 가지를 강력하고 편리한 하나의 솔루션으로 결합하여, 거래에서 최고의 가치를 얻을 수 있도록 했습니다. 1. 오더 블록 지표 (이전에 32.90$에 판매됨) 오더 블록 지표는 시장에서 중요한 기관의 관심 영역을 식별하는 데 필수적인 도구입니다. 이 지표는 오더 블록 캔들의 고점과 저점을 표시하며, 이는 가격 반전이나 추세 지속이 발생할 수 있는 중요한 영역을 나타냅니다. 단독으로 사용될 때, 오더 블록 지표는 잠재적인 지지 및 저항 영역을 식별하여 더 나은 거래 결정을 내릴 수 있도록 도와줍니다. 링크: https://www.mql5.com/it/market/product/121633?source=Site+Market+MT5+Search+Rating006%3aorderblock+indicator 2. FVG 지표 (이전에 34.90$에 판매됨) FVG 지표는 공정 가
Terra Infinity
Ivan Simonika
Terra Infinity is a flat indicator. This improved version of the CalcFlat indicator has three additional lines that significantly increase its effectiveness. Unlike its predecessor with two static levels, Terra Infinity adds three dynamic lines above the main histogram, which are interpreted as follows: base signal line, minimum signal line, maximum signal line. These lines are formed using the additional parameter Avg, which is the average value of the histogram. Averaging produces a line cl
이 제품의 구매자들이 또한 구매함
Golden Trend Indicator MT5
Noha Mohamed Fathy Younes Badr
4.89 (18)
Golden Trend indicator  is The best indicator for predicting trend movement this indicator never lags and never repaints and never back paints    and give  arrow buy and sell    before the candle appear  and it will help you and  will make your trading decisions clearer its work on all currencies and  gold and crypto and all time frame This unique  indicator uses very secret algorithms to catch the  trends, so you can trade using this indicator and see the trend clear on charts  manual guide and
Cycle Maestro MT5
Stefano Frisetti
NOTE: CYCLEMAESTRO is distributed only on this website, there are no other distributors. Demo version is for reference only and is not supported. Full versione is perfectly functional and it is supported. CYCLEMAESTRO , the first and only indicator of Cyclic Analysis, useful for giving signals of TRADING, BUY, SELL, STOP LOSS, ADDING. Created on the logic of   Serghei Istrati   and programmed by   Stefano Frisetti ;   CYCLEMAESTRO   is not an indicator like the others, the challenge was to inter
MonetTrend
Aliya Bolek
MonetTrend — Премиум-индикатор для торговли по тренду (M30, H1, H4) MonetTrend — это мощный и визуально понятный трендовый индикатор, созданный для торговли на таймфреймах M30, H1 и H4. Он идеально подходит для работы с волатильными инструментами, такими как: • Золото (XAUUSD) • Криптовалюты (BTCUSD) • Валютные пары (EURUSD, USDJPY и др.) Ключевые особенности MonetTrend: • Автоматическое отображение Take Profit 1 (TP1) и Stop Loss (SL): После появления сигнала индикатор сразу показывает: • TP
TPSproTREND PrO MT5
Roman Podpora
4.72 (18)
VERSION MT4        —        ИНСТРУКЦИЯ RUS           —        INSTRUCTIONS  ENG 주요 기능: 렌더링 없이 정확한 입력 신호! 신호가 나타나면 관련성은 유지됩니다! 이는 신호를 제공한 후 변경하여 예금 자금 손실을 초래할 수 있는 다시 그리기 지표와의 중요한 차이점입니다. 이제 더 큰 확률과 정확도로 시장에 진입할 수 있습니다. 화살표가 나타난 후 목표에 도달(이익실현)하거나 반전 신호가 나타날 때까지 캔들을 색칠하는 기능도 있습니다. STOP LOSS / TAKE PROFIT 구역 표시 진입점 검색 시 시각적 명확성을 높이기 위해 시장 진입을 위한 최적 지점이 검색되는 BUY/SELL 영역을 초기에 표시하는 모듈을 만들었습니다. 정지 손실 수준 작업을 위한 추가 지능형 논리는 시간이 지남에 따라 크기를 줄이는 데 도움이 되므로 거래에 들어갈 때 초기 위험을 줄이는 데 도움이 됩니다(move sl). 더 높은 기간의 MIN
RelicusRoad Pro MT5
Relicus LLC
4.79 (19)
이제 $ 147 (몇 가지 업데이트 후 $ 499 증가) - 무제한 계정 (PCS 또는 MACS) RelicusRoad 사용 설명서 + 교육 비디오 + 비공개 Discord 그룹 액세스 + VIP 상태 시장을 보는 새로운 방법 RelicusRoad는 외환, 선물, 암호화폐, 주식 및 지수에 대한 세계에서 가장 강력한 거래 지표로서 거래자에게 수익성을 유지하는 데 필요한 모든 정보와 도구를 제공합니다. 우리는 초보자부터 고급까지 모든 거래자가 성공할 수 있도록 기술적 분석 및 거래 계획을 제공합니다. 미래 시장을 예측할 수 있는 충분한 정보를 제공하는 핵심 거래 지표입니다. 우리는 차트에서 말이 안 되는 여러 지표 대신 완전한 솔루션을 믿습니다. 타의 추종을 불허하는 매우 정확한 신호, 화살표 + 가격 조치 정보를 표시하는 올인원 표시기입니다. 강력한 AI를 기반으로 하는 RelicusRoad는 누락된 정보와 도구를 제공하여 교육하고 성공적인 트레이더인 트레이딩 전문가가 되도
Quantum TrendPulse
Bogdan Ion Puscasu
5 (13)
SuperTrend   ,   RSI   ,   Stochastic   의 힘을 하나의 포괄적인 지표로 결합하여 트레이딩 잠재력을 극대화하는 궁극의 트레이딩 도구   인 Quantum TrendPulse를   소개합니다. 정밀성과 효율성을 추구하는 트레이더를 위해 설계된 이 지표는 시장 추세, 모멘텀 변화, 최적의 진입 및 종료 지점을 자신 있게 식별하는 데 도움이 됩니다. 주요 특징: SuperTrend 통합:   주요 시장 추세를 쉽게 따라가고 수익성의 물결을 타세요. RSI 정밀도:   매수 과다 및 매도 과다 수준을 감지하여 시장 반전 시점을 파악하는 데 적합하며 SuperTrend 필터로 사용 가능 확률적 정확도:   변동성이 큰 시장에서 숨겨진 기회를 찾기 위해 확률적 진동   을 활용하고 SuperTrend의 필터로 사용 다중 시간대 분석:   M5부터 H1 또는 H4까지 다양한 시간대에 걸쳐 시장을 최신 상태로 유지하세요. 맞춤형 알림:   맞춤형 거래 조건이 충족되면
TPSpro RFI Levels MT5
Roman Podpora
4.55 (20)
주요 플레이어의 반전 구역 / 피크 볼륨 / 활성 구역 =       TS TPS프로시스템 지침 RUS       /       지침       영어       /           버전 MT4        이 지표를 구매한 모든 구매자는 또한 다음을 무료로 받습니다. RFI SIGNALS 서비스의 거래 신호에 6개월 동안 액세스할 수 있습니다. TPSproSYSTEM 알고리즘에 따른 즉시 사용 가능한 진입 포인트입니다. 정기적으로 업데이트되는 교육 자료 - 전략에 푹 빠져서 전문가 수준을 높여보세요. 주중 24/5 지원 및 비공개 트레이더 채팅 이용 - 시장 상황에 대한 소통, 지원 및 분석. 저자가 설정한 파일 - 별도의 노력 없이 최대 결과를 얻을 수 있도록 지표를 자동으로 설정합니다. 주요 기능: 판매자와 구매자의 활동 영역을 표시합니다! 이 지표는 매수 및 매도에 대한 모든 올바른 첫 번째 임펄스 레벨/존을 표시합니다. 진입점 검색이 시작되는 이러한 레벨/존이 활성화되면
MONEYTRON – ТВОЙ ЛИЧНЫЙ СИГНАЛ НА УСПЕХ! XAUUSD | AUDUSD | USDJPY | BTCUSD Поддержка таймфреймов: M5, M15, M30, H1 Почему трейдеры выбирают Moneytron? 82% успешных сделок — это не просто цифры, это результат продуманной логики, точного алгоритма и настоящей силы анализа. Автоматические сигналы на вход — не нужно гадать: когда покупать, когда продавать. 3 уровня Take Profit — ты сам выбираешь свой уровень прибыли: безопасный, уверенный или максимум. Четкий Stop Loss — контролируешь риск
MetaForecast M5
Vahidreza Heidar Gholami
5 (3)
MetaForecast는 가격 데이터의 조화를 기반으로 모든 시장의 미래를 예측하고 시각화합니다. 시장이 항상 예측 가능한 것은 아니지만 가격에 패턴이 있다면 MetaForecast는 가능한 정확하게 미래를 예측할 수 있습니다. 다른 유사한 제품과 비교했을 때, MetaForecast는 시장 동향을 분석하여 더 정확한 결과를 생성할 수 있습니다. 입력 매개변수 Past size (과거 크기) MetaForecast가 미래 예측을 생성하기 위한 모델을 만드는 데 사용하는 막대의 수를 지정합니다. 모델은 선택한 막대 위에 그려진 노란색 선으로 표시됩니다. Future size (미래 크기) 예측해야 할 미래 막대의 수를 지정합니다. 예측된 미래는 핑크색 선으로 표시되며 그 위에 파란색 회귀선이 그려집니다. Degree (차수) 이 입력은 MetaForecast가 시장에서 수행할 분석 수준을 결정합니다. Degree 설명  0 차수 0의 경우, "Past size" 입력에 모든 봉우리와
CBT Quantum Maverick
Arpit Sharma
1 (1)
CBT Quantum Maverick 고효율 바이너리 옵션 거래 시스템 CBT Quantum Maverick는 정밀하고 간단하며 체계적인 거래를 원하는 트레이더를 위해 설계된 고성능 바이너리 옵션 거래 시스템입니다. 사용자 지정이 필요 없으며, 처음부터 최적화된 결과를 제공합니다. 약간의 연습만으로 신호를 쉽게 마스터할 수 있습니다. 주요 특징: 정확한 신호 제공: 현재 봉 데이터를 기반으로 다음 캔들에 대한 신호를 생성하며, 빈번한 재도색이 없습니다. 다양한 시장에 대한 적응성: 바이너리 옵션 거래에 특화되었으며, 여러 브로커 및 자산 클래스와 호환됩니다. 호환 가능: Deriv Synthetic Charts: 모든 시간 프레임에서 사용 가능. OTC 차트: Quotex, PocketOption, Binomo, Stockity, IQOption, Exnova, OlympTrade, Deriv, Binolla, Homebroker 등의 브로커와 호환(MT5로의 무료 데이터 임
Advanced Currency Strength28 MT5
Bernhard Schweigert
5 (2)
초보자 또는 전문가 트레이더를 위한 최고의 솔루션! 이 지표는 우리가 독점 기능과 새로운 공식을 통합했기 때문에 독특하고 고품질이며 저렴한 거래 도구입니다. 단 하나의 차트로 28 Forex 쌍의 통화 강도를 읽을 수 있습니다! 새로운 추세 또는 스캘핑 기회의 정확한 트리거 포인트를 정확히 찾아낼 수 있기 때문에 거래가 어떻게 개선될지 상상해 보십시오. 사용 설명서: 여기를 클릭  https://www.mql5.com/en/blogs/post/697384 그것이 첫 번째, 원본입니다! 쓸모없는 지망생 클론을 사지 마십시오. 더 스페셜  강력한 통화 모멘텀을 보여주는 하위 창의 화살표 GAP가 거래를 안내합니다! 기본 또는 호가 통화가 과매도/과매도 영역(외부 시장 피보나치 수준)에 있을 때 개별 차트의 기본 창에 경고 표시가 나타납니다. 통화 강도가 외부 범위에서 떨어질 때 풀백/반전 경고. 교차 패턴의 특별 경고 추세를 빠르게 볼 수 있는 다중 시간 프레임 선택이 가능합
MetaBands M5
Vahidreza Heidar Gholami
4.5 (2)
MetaBands uses powerful and unique algorithms to draw channels and detect trends so that it can provide traders with potential points for entering and exiting trades. It’s a channel indicator plus a powerful trend indicator. It includes different types of channels which can be merged to create new channels simply by using the input parameters. MetaBands uses all types of alerts to notify users about market events. Features Supports most of the channel algorithms Powerful trend detection algorith
소개       Quantum Breakout PRO   , 브레이크아웃 존 거래 방식을 변화시키는 획기적인 MQL5 지표! 13년 이상의 거래 경험을 가진 숙련된 트레이더 팀이 개발한       퀀텀 브레이크아웃 PRO       혁신적이고 역동적인 브레이크아웃 존 전략으로 거래 여정을 새로운 차원으로 끌어올리도록 설계되었습니다. Quantum Breakout Indicator는 5개의 이익 목표 영역이 있는 브레이크아웃 영역의 신호 화살표와 브레이크아웃 상자를 기반으로 한 손절 제안을 제공합니다. 초보자 거래자와 전문 거래자 모두에게 적합합니다. Quantum EA 채널:       여기를 클릭하세요 중요한! 구매 후 설치 매뉴얼을 받으려면 개인 메시지를 보내주십시오. 추천: 기간: M15 통화쌍: GBPJPY, EURJPY, USDJPY,NZDUSD, XAUUSD 계정 유형: 스프레드가 매우 낮은 ECN, Raw 또는 Razor 브로커 시간: GMT +3 중개인 :
Trend Forecaster
Alexey Minkov
5 (6)
The Trend Forecaster indicator utilizes a unique proprietary algorithm to determine entry points for a breakout trading strategy. The indicator identifies price clusters, analyzes price movement near levels, and provides a signal when the price breaks through a level. The Trend Forecaster indicator is suitable for all financial assets, including currencies (Forex), metals, stocks, indices, and cryptocurrencies. You can also adjust the indicator to work on any time frames, although it is recommen
IQ Gold Gann Levels a non-repainting, precision tool designed exclusively for XAUUSD/Gold intraday trading. It uses W.D. Gann’s square root method to plot real-time support and resistance levels, helping traders spot high-probability entries with confidence and clarity. William Delbert Gann (W.D. Gann) was an exceptional market analyst, whose trading technique was based on a complex blend of mathematics, geometry, astrology, and ancient mathematics which proved to be extremely accurate. Download
MTF Supply Demand Zones MT5
Georgios Kalomoiropoulos
5 (1)
자동화된 수요 및 공급 구역의 차세대. 모든 차트에서 작동하는 새롭고 혁신적인 알고리즘. 모든 구역은 시장의 가격 움직임에 따라 동적으로 생성됩니다. 두 가지 유형의 경고 --> 1)가격이 영역에 도달할 때 2)새로운 영역이 형성될 때 당신은 더 이상 쓸모없는 지표를 얻을 수 없습니다. 입증된 결과로 완벽한 거래 전략을 얻을 수 있습니다.     새로운 기능:     가격이 공급/수요 영역에 도달하면 경고     새로운 공급/수요 구역이 생성되면 알림     푸시 알림 알림     핍의 영역 너비 레이블     기동특무부대에 한 번 더 시간이 주어집니다. 따라서 현재보다 위의 2개의 시간 프레임 대신 현재보다 높은 3개의 시간 프레임을 볼 수 있습니다.     Alerts/Zones/MTF 기능을 활성화/비활성화하는 버튼 당신이 얻는 이점:     거래에서 감정을 제거하십시오.     거래 항목을 객관화하십시오.     높은 확률 설정을 사용하여 수익
Entry Points Pro for MT5
Yury Orlov
4.46 (130)
다시 색을 칠하지 않고 거래에 진입할 수 있는 정확한 신호를 제공하는 MT5용 지표입니다. 외환, 암호화폐, 금속, 주식, 지수 등 모든 금융 자산에 적용할 수 있습니다. 매우 정확한 추정값을 제공하고 매수와 매도의 가장 좋은 시점을 알려줍니다. 하나의 시그널로 수익을 내는 지표의 예와 함께 비디오 (6:22)시청하십시오! 대부분의 거래자는 Entry Points Pro 지표의 도움으로 첫 거래 주 동안 트레이딩 결과를 개선합니다. 저희의   Telegram Group 을 구독하세요! Entry Points Pro 지표의 좋은점. 재도색이 없는 진입 신호 신호가 나타나고 확인되면(시그널 캔들이 완성된 경우) 신호는 더 이상 사라지지 않습니다. 여타 보조지표의 경우 신호를 표시한 다음 제거되기 때문에 큰 재정적 손실로 이어집니다. 오류 없는 거래 게시 알고리즘을 통해 트레이드(진입 또는 청산)를 할 이상적인 순간을 찾을 수 있으며, 이를 통해 이를 사용하는 모든 거래자의 성공률이
초보자 또는 전문가 트레이더를 위한 최고의 솔루션! 이 지표는 우리가 독점 기능과 비밀 공식을 통합했기 때문에 독특하고 고품질이며 저렴한 거래 도구입니다. 단 하나의 차트로 28개 통화 쌍 모두에 대한 경고를 제공합니다. 새로운 추세 또는 스캘핑 기회의 정확한 트리거 포인트를 정확히 찾아낼 수 있기 때문에 거래가 어떻게 개선될지 상상해 보십시오! 새로운 기본 알고리즘을 기반으로 구축되어 잠재적인 거래를 훨씬 더 쉽게 식별하고 확인할 수 있습니다. 이는 통화의 강세 또는 약세가 가속되는지 여부를 그래픽으로 표시하고 가속 속도를 측정하기 때문입니다. 자동차의 속도계처럼 생각하면 됩니다. 가속화할 때 Forex 시장에서 동일한 일이 분명히 더 빠르게 발생합니다. 즉, 반대 방향으로 가속화되는 통화를 페어링하면 잠재적으로 수익성 있는 거래를 식별한 것입니다. 통화 모멘텀의 수직선과 화살표가 거래를 안내합니다! 역동적인 Market Fibonacci 23 레벨은 경고 트리거로 사용되며
FxaccurateLS
Shiv Raj Kumawat
WHY IS OUR FXACCCURATE LS MT5 THE PROFITABLE ? PROTECT YOUR CAPITAL WITH RISK MANAGEMENT Gives entry, stop and target levels from time to time. It finds Trading opportunities by analyzing what the price is doing during established trends. POWERFUL INDICATOR FOR A RELIABLE STRATEGIES We have made these indicators with a lot of years of hard work. It is made at a very advanced level. Established trends provide dozens of trading opportunities, but most trend indicators completely ignore them! The
Blahtech Supply Demand MT5
Blahtech Limited
4.54 (13)
Was: $299  Now: $149  Supply Demand uses previous price action to identify potential imbalances between buyers and sellers. The key is to identify the better odds zones, not just the untouched ones. Blahtech Supply Demand indicator delivers functionality previously unavailable on any trading platform. This 4-in-1 indicator not only highlights the higher probability zones using a multi-criteria strength engine, but also combines it with multi-timeframe trend analysis, previously confirmed swings
Royal Scalping Indicator M5
Vahidreza Heidar Gholami
5 (6)
Royal Scalping Indicator is an advanced price adaptive indicator designed to generate high-quality trading signals. Built-in multi-timeframe and multi-currency capabilities make it even more powerful to have configurations based on different symbols and timeframes. This indicator is perfect for scalp trades as well as swing trades. Royal Scalping is not just an indicator, but a trading strategy itself. Features Price Adaptive Trend Detector Algorithm Multi-Timeframe and Multi-Currency Trend Low
프리시전 트레이딩 시스템의 로저 메드칼프에 의한 프리시전 인덱스 오실레이터 (Pi-Osc) 버전 2는 차트에 신속하게 로드되도록 주의 깊게 다시 코딩되었으며 경험을 향상시키기 위해 몇 가지 다른 기술적 개선 사항이 통합되었습니다. Pi-Osc는 정확한 거래 타이밍 신호를 제공하도록 개발되었으며 시장이 모든 사람의 스톱을 청산하기 위해 가야 하는 극도의 고갈 지점을 찾는 데 목적이 있습니다. 이 제품은 극단적인 지점이 어디에 있는지 알고 있는 고전적인 문제를 해결하며 트레이더로서의 삶을 훨씬 간단하게 만듭니다. 이것은 업계 표준 오실레이터와는 상당히 다른 강력한 차이점을 가지고 있는 고도로 복잡한 합의 지표입니다. 사용하는 기능 중 일부는 수요 지수, 자금 흐름, RSI, 스토캐스틱, 패턴 인식, 거래량 분석, 표준 편차 극단점 및 다양한 길이에서 위와 유사한 변형을 갖습니다. 미숙한 눈에는 다른 오실레이터와 비슷해 보일 수 있지만 RSI 또는 모멘텀과 같은 다른 오실레이
PZ Mean Reversion MT5
PZ TRADING SLU
3 (2)
평균 회귀 거래에 대한 전문적이고 정량적인 접근 방식을 구현하는 고유한 지표입니다. 이는 가격이 예측 가능하고 측정 가능한 방식으로 평균으로 전환되고 반환된다는 사실을 이용하여 비정량적 거래 전략을 훨씬 능가하는 명확한 진입 및 퇴장 규칙을 허용합니다. [ Installation Guide | Update Guide | Troubleshooting | FAQ | All Products ] 명확한 거래 신호 놀랍도록 쉬운 거래 사용자 정의 가능한 색상 및 크기 성능 통계 구현 대부분의 거래 전략을 능가합니다. 적절한 SL 및 TP 레벨을 표시합니다. 이메일/음향/시각 알림을 구현합니다. 작동 원리 이 지표는 더 높은 기간에서 완전히 사용자 정의 가능한 이동 평균 주변의 표준 편차를 측정하고 추세 추종 접근 방식을 사용하여 정확하게 거래를 찾습니다. 거래는 현재 차트의 가격 동작을 살펴보고 선택한 더 높은 기간에서 계산된 평균 가격대로 가격이 돌아오면 닫힙니다. 코딩 방식 때문에 지
The   Time_Price_SQ9_Degree   indicator is based on the 9 Gann square. Using this indicator, you can identify strong time and price zones. The indicator displays the levels as a degree value. The degrees can be set in the settings. After launching, the MENU button appears. If it is highlighted, it can be moved to any point on the graph, and after double-clicking on it, it stops being highlighted and menu buttons appear. To hide the menu, just double-click on the button, it will become highlight
KT Candlestick Patterns MT5
KEENBASE SOFTWARE SOLUTIONS
KT Candlestick Patterns는 실시간으로 24가지 가장 신뢰할 수 있는 일본 캔들 패턴을 찾아 차트에 표시합니다. 일본 트레이더들은 18세기부터 이러한 패턴을 사용해 가격 방향을 예측해왔습니다. 모든 캔들 패턴이 동일한 신뢰도를 가지는 것은 아니지만, 지지/저항 같은 다른 기술적 분석과 결합하면 시장 상황을 명확하게 보여줍니다. 이 지표는 Steve Nison의 책 "Japanese Candlestick Charting Techniques"에 소개된 많은 패턴을 포함하고 있습니다. 책에서 다루지 않는 복잡한 패턴들도 감지할 수 있어 더욱 강력한 기능을 제공합니다. 기능 각 신호에서 고정된 핍 수익을 목표로 설정하면, 지표가 해당 목표에 대한 성공률을 실시간으로 계산합니다. 일본의 유명한 24가지 캔들 패턴을 높은 정확도로 식별합니다. 각 패턴의 성능을 분석하고 정확도를 실시간으로 보여주는 모듈이 내장되어 있습니다. 패턴 간 최소 바 수를 설정할 수 있어 차트를 깔
[ MT4 Version ] Are you tired of spending months on demo or live accounts to test your trading strategies? The Backtesting Simulator is the ultimate tool designed to elevate your backtesting experience to new heights. Utilizing Metatrader historical symbol information, it offers an unparalleled simulation of real market conditions. Take control of your testing speed, test ideas quickly or at a slower pace, and witness remarkable improvements in your testing performance. Forget about wasting tim
설명 ICSM(Impulse-Correction SCOB Mapper)은 가격 움직임을 분석하고 유효한 충격, 수정 및 SCOB(Single Candle Order Block)을 식별하는 지표입니다. 유연하고 정보가 풍부하며 사용하기 쉽고 가장 유동성이 높은 관심 영역에 대한 트레이더의 인식을 크게 향상시키기 때문에 모든 유형의 기술적 분석과 함께 사용할 수 있는 강력한 도구입니다. 설정 일반 | 시각 색상 테마 - ICSM의 색상 테마를 정의합니다. SCOB | 시각 SCOB 표시 - SCOB를 활성화/비활성화합니다; SCOB 표시 방법 - SCOB 표현을 위한 스타일 옵션 목록을 나타냅니다; SCOB 색상 - SCOB의 색상을 정의합니다; ICM | 시각 ICM 라인 표시 - ICM(Impulse-Correction Mapper) 라인을 활성화/비활성화합니다; IC 트렌드 표시 - 차트 하단의 색상 구분선을 통해 충격-수정 트렌드 시각화를 활성화/비활성화합니다;
Beast Super Signal MT5
Dustin Vlok
2.71 (7)
수익성 있는 거래 기회를 쉽게 식별하는 데 도움이 되는 강력한 외환 거래 지표를 찾고 계십니까? Beast Super Signal보다 더 이상 보지 마십시오. 사용하기 쉬운 이 추세 기반 지표는 시장 상황을 지속적으로 모니터링하여 새로운 개발 추세를 찾거나 기존 추세에 뛰어들 수 있습니다. Beast Super Signal은 모든 내부 전략이 정렬되고 서로 100% 합류할 때 매수 또는 매도 신호를 제공하므로 추가 확인이 필요하지 않습니다. 신호 화살표 알림을 받으면 구매 또는 판매하기만 하면 됩니다. 구매 후 비공개 VIP 그룹에 추가되도록 저에게 메시지를 보내주세요! (전체 제품 구매만 해당). 최신 최적화된 세트 파일을 구입한 후 저에게 메시지를 보내주세요. MT4 버전은   여기에서 사용할 수 있습니다. 여기에서   Beast Super Signal EA를 받으세요. 최신 결과를 보려면 댓글 섹션을 확인하세요! Beast Super Signal은 1:1, 1:2
Volume by Price MT5
Brian Collard
3.25 (4)
Volume Profile, Footprint and Market Profile TPO (Time Price Opportunity). Volume and TPO histogram bar and line charts. Volume Footprint charts. TPO letter and block marker collapsed and split structure charts. Static, dynamic and flexible range segmentation and compositing methods with relative and absolute visualizations. Session hours filtering and segment concatenation with Market Watch and custom user specifications. Graphical layering, positioning and styling options to suit the user's a
TPA True Price Action indicator reveals the true price action of the market makers through 100% non-repainting signals strictly at the close of a candle! TPA shows entries and re-entries, every time the bulls are definitely stronger than the bears and vice versa. Not to confuse with red/green candles. The shift of power gets confirmed at the earliest stage and is ONE exit strategy of several. There are available now two free parts of the TPA User Guide for our customers. The first "The Basics"
제작자의 제품 더 보기
EAsiTrader: Advanced Strategy Creation & Automation for MetaTrader 5 EAsiTrader is designed for those who want to eliminate the hassle of programming and drastically accelerate the process of creating Expert Advisors, making strategy development faster and more efficient. EAsiTrader is a versatile trading tool designed specifically for MetaTrader 5, providing automation features and a comprehensive set of tools to help users build, test, and refine and run trading strategies. EAsiTrader adapts
FREE
AutoFib: Advanced Fibonacci Retracement for MetaTrader 5 Automate Fibonacci Analysis for Smarter Trading Decisions AutoFib simplifies Fibonacci retracement analysis by automatically identifying key levels of support and resistance directly on your MT5 charts. Whether you're new to Fibonacci analysis or an advanced trader, AutoFib enhances your ability to identify potential reversals, continuations, and critical price levels. Key Features: Automatic Fibonacci Levels – Identify retracement and ext
NTL Pivot Lines
Northen Trading Labs
Pivot Lines (PL) User Guide Overview and Features The Pivot Lines Indicator (PL) provides traders with a powerful tool for identifying potential support and resistance levels based on well-established pivot point calculation methods. By offering insights into possible price turning points, this indicator helps traders make more informed trading decisions and refine their entry and exit strategies. With customizable settings for different timeframes and calculation methods, PL is versatile and a
ABH - Candle Component Analysis - User Guide Overview and Features The   ABH - Average Bar Height   indicator is designed to help traders analyze market volatility and identify potential buy and sell signals by measuring the average size of each candlestick component over a specific period. The indicator calculates and displays four lines representing different candlestick metrics. By analyzing these values, traders can interpret market strength, volatility, and potential trend changes. Beyond
NTL Market Times
Northen Trading Labs
NTL Market Times Indicator The NTL Market Times Indicator for MT5 provides a clear unobtrusive display of the opening and closing times of the world’s major Forex trading centers. It automatically adjusts for UK daylight saving time, ensuring reliable market session information all year round. Main Features Major Markets: Displays New York, London, Frankfurt, Sydney, and Tokyo trading hours. Color-Coded Sessions: Each market session is uniquely color-coded for quick identification on the chart.
NTL HLines
Northen Trading Labs
HLines User Guide Overview and Features The NTL HLines Indicator is designed to elevate your trading with precise support and resistance analysis. Utilizing a sophisticated algorithm, this MQL5 indicator scans for high-probability price levels across multiple timeframes, helping traders pinpoint strategic entry and exit zones. With fully customizable pivot scanning and multi-timeframe support, HLines provides a powerful, adaptable toolset for traders of all experience levels. Key features includ
필터:
리뷰 없음
리뷰 답변