Harmonic Price Patterns
- 지표
- Kourosh Hossein Davallou
- 버전: 5.60
- 활성화: 5
Harmonic price patterns identify the stages of a retracement so that when the pattern is complete, you have a clear buy or sell signal. Retracements are vexing at all times, and any help is always welcome, although, with harmonic price patterns, the orthodoxy is to apply Fibonacci numbers. Again, Fibonacci numbers are not a proven theory, and in fact, there is a great deal of evidence that Fibonacci numbers appear in securities prices, including Forex, only about the number of times as chance would allow. Nevertheless, when a perfect or near-perfect Fibonacci number does appear, plenty of traders will see it and produce the expected outcome, so it does not pay to dismiss Fibonacci-based trading ideas out of hand.
Note that harmonic price patterns are unrelated to classic chart patterns (head-and-shoulders, double top, et al.). The key books on harmonics are by Scott Carney, author of The Harmonic Trader (1999) and Harmonic Trading of the Financial Markets, Volumes 1 and 2 (2010). Harmonics have become increasingly popular in Forex in recent years, and specialized software is now available. Like all trading concepts based on Fibonacci numbers, harmonic pattern identification takes a lot of practice and a lot of re-drawing and re-calculation since the numbers so seldomly hit exactly where they are supposed to. However, a focus on retracements can be helpful in improving trading performance since retracements are where most losses are clustered.
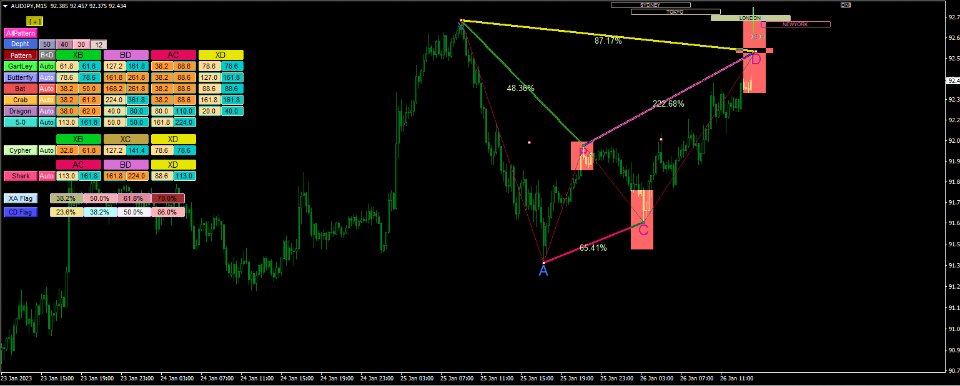
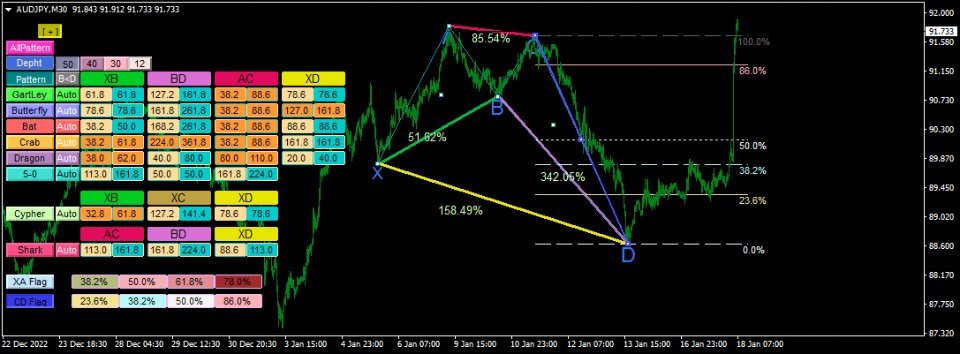
It may be of interest that some people can “see” harmonic patterns and others cannot, even with the help of software that does the hard work of performing the calculations. Proponents of harmonic patterns claim that they appear hundreds of times per day and thousands of times per week, but if that were true, you should be able to pick any chart on any timeframe and find one of the seven or eight standard harmonic patterns within seconds. We can find every other technical phenomenon with no effort at all on any chart, but not harmonic patterns. Therefore, the illustration here has to be a model. See the figure below. It is the basic ABCD pattern, and here is the “Gartley bearish pattern.” Other patterns are variations of this core concept, including the Bat, Butterfly, Crab, and Shark patterns. Note that the Gartley pattern is named after H.M. Gartley, who wrote a book titled Profits in the Stock Market in 1935. Gartley did not use Fibonacci numbers, although he identified the sequence of price moves.




















사용자가 평가에 대한 코멘트를 남기지 않았습니다