Elder MACD Combo
- 지표
- Financial Trading Seminars Inc.
- 버전: 3.0
- 업데이트됨: 17 11월 2021
- 활성화: 5
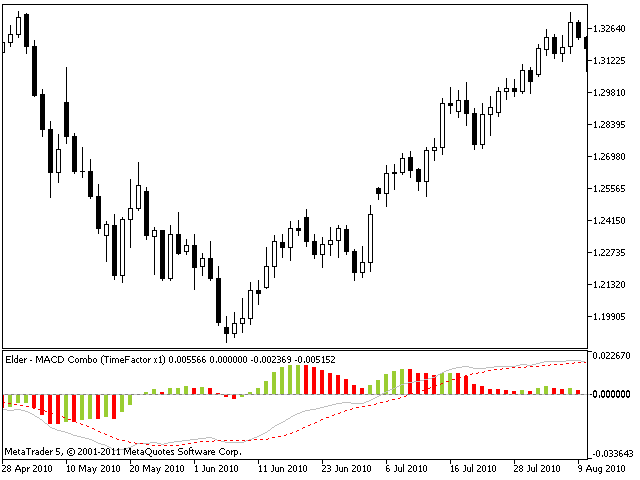
MACD Histogram tracks the difference between the MACD line and the Signal line (which is the exponential moving average of the first line). For better visibility, when plotting the lines and the histogram in the same window, we scale up the histogram by a factor of 2. Furthermore, we use two separate plots for the histogram, which allows us to color-code the bars for upticks and downticks.
The MACD Combo overlays MACD lines on MACD Histogram. Putting both plots in the same window enables you to change both with a single parameter change.
Parameters:
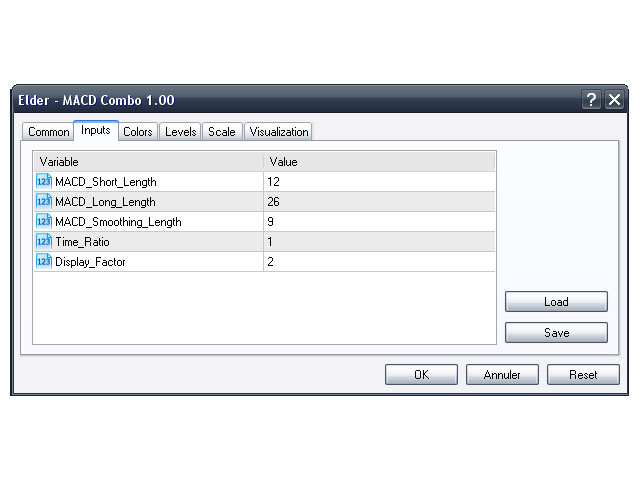
- MACD_Short_Length (12) – The short EMA for the MACD calculation;
- MACD_Long_Length (26) – The long EMA for the MACD calculation;
- MACD_Smoothing_Length (9) – The smoothing value for the Signal line;
- Time_Ratio (1) – Normally 1, showing MACD for the same timeframe as the price chart. If, on the other hand, you are looking at a daily chart and want to see a weekly MACD, set this to 5, multiplying all the parameters above by five;
- Display_Factor (2) – The scale factor.


사용자가 평가에 대한 코멘트를 남기지 않았습니다