OHLC Levels Pro
- 지표
- Makarii Gubaydullin
- 버전: 1.0
- 활성화: 10
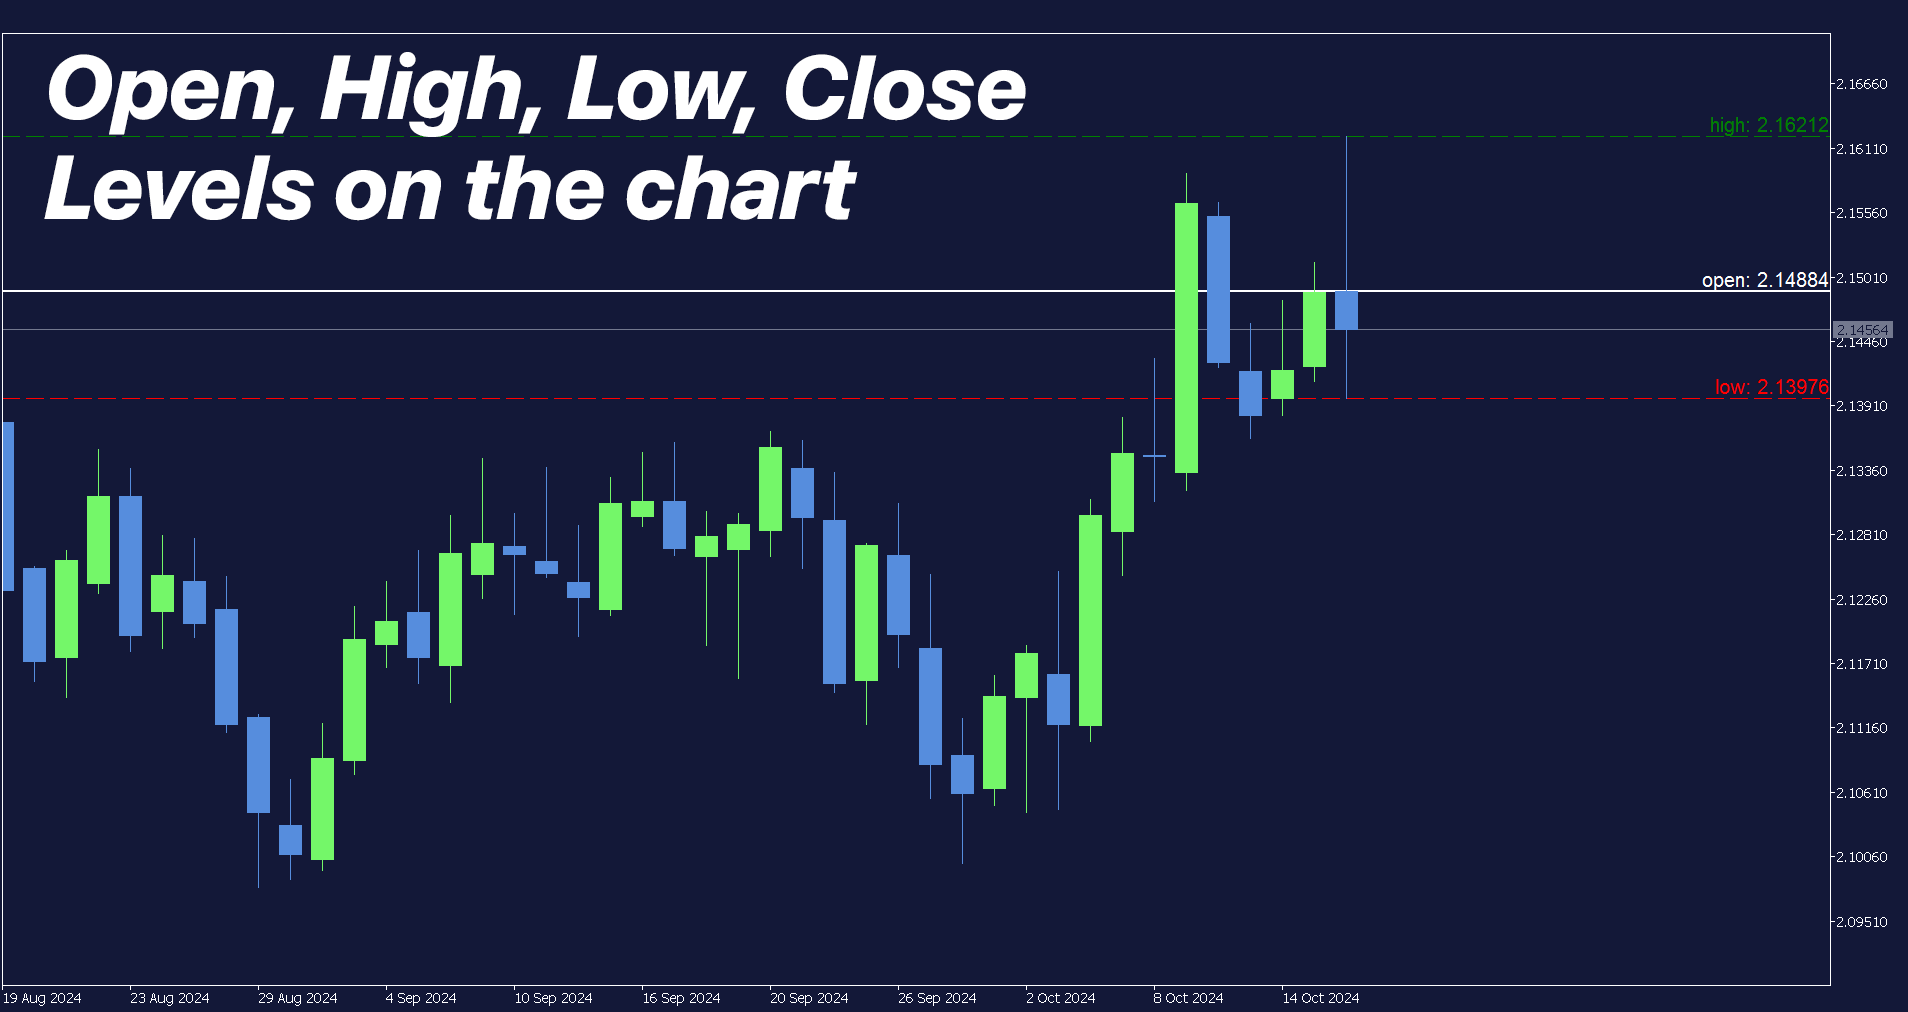
Visualization of Open, High, Low, Close levels on the chart
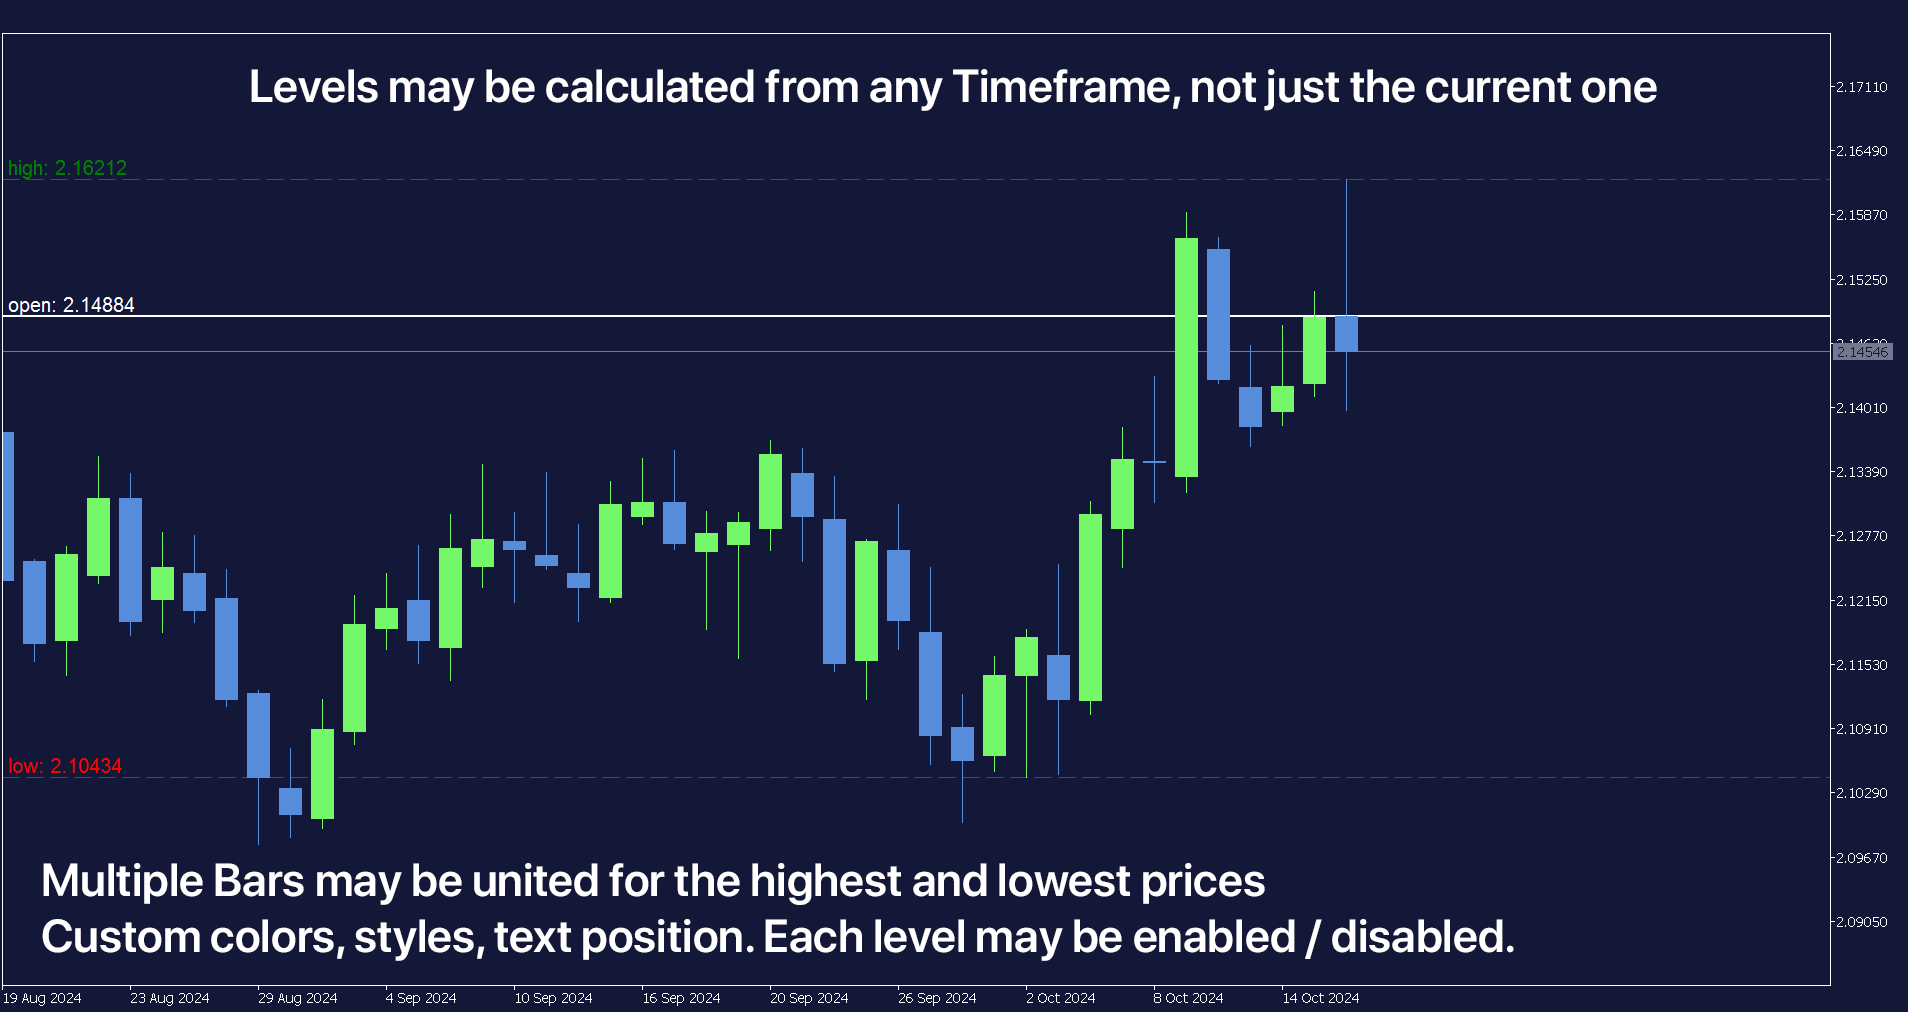
You can choose any timeframe, not just the current one.
The offset of the calculated bar can be adjusted: the current (floating) bar, or a set number of bars back.My #1 Utility: includes 65+ functions | Contact me if you have any questions | MT5 version
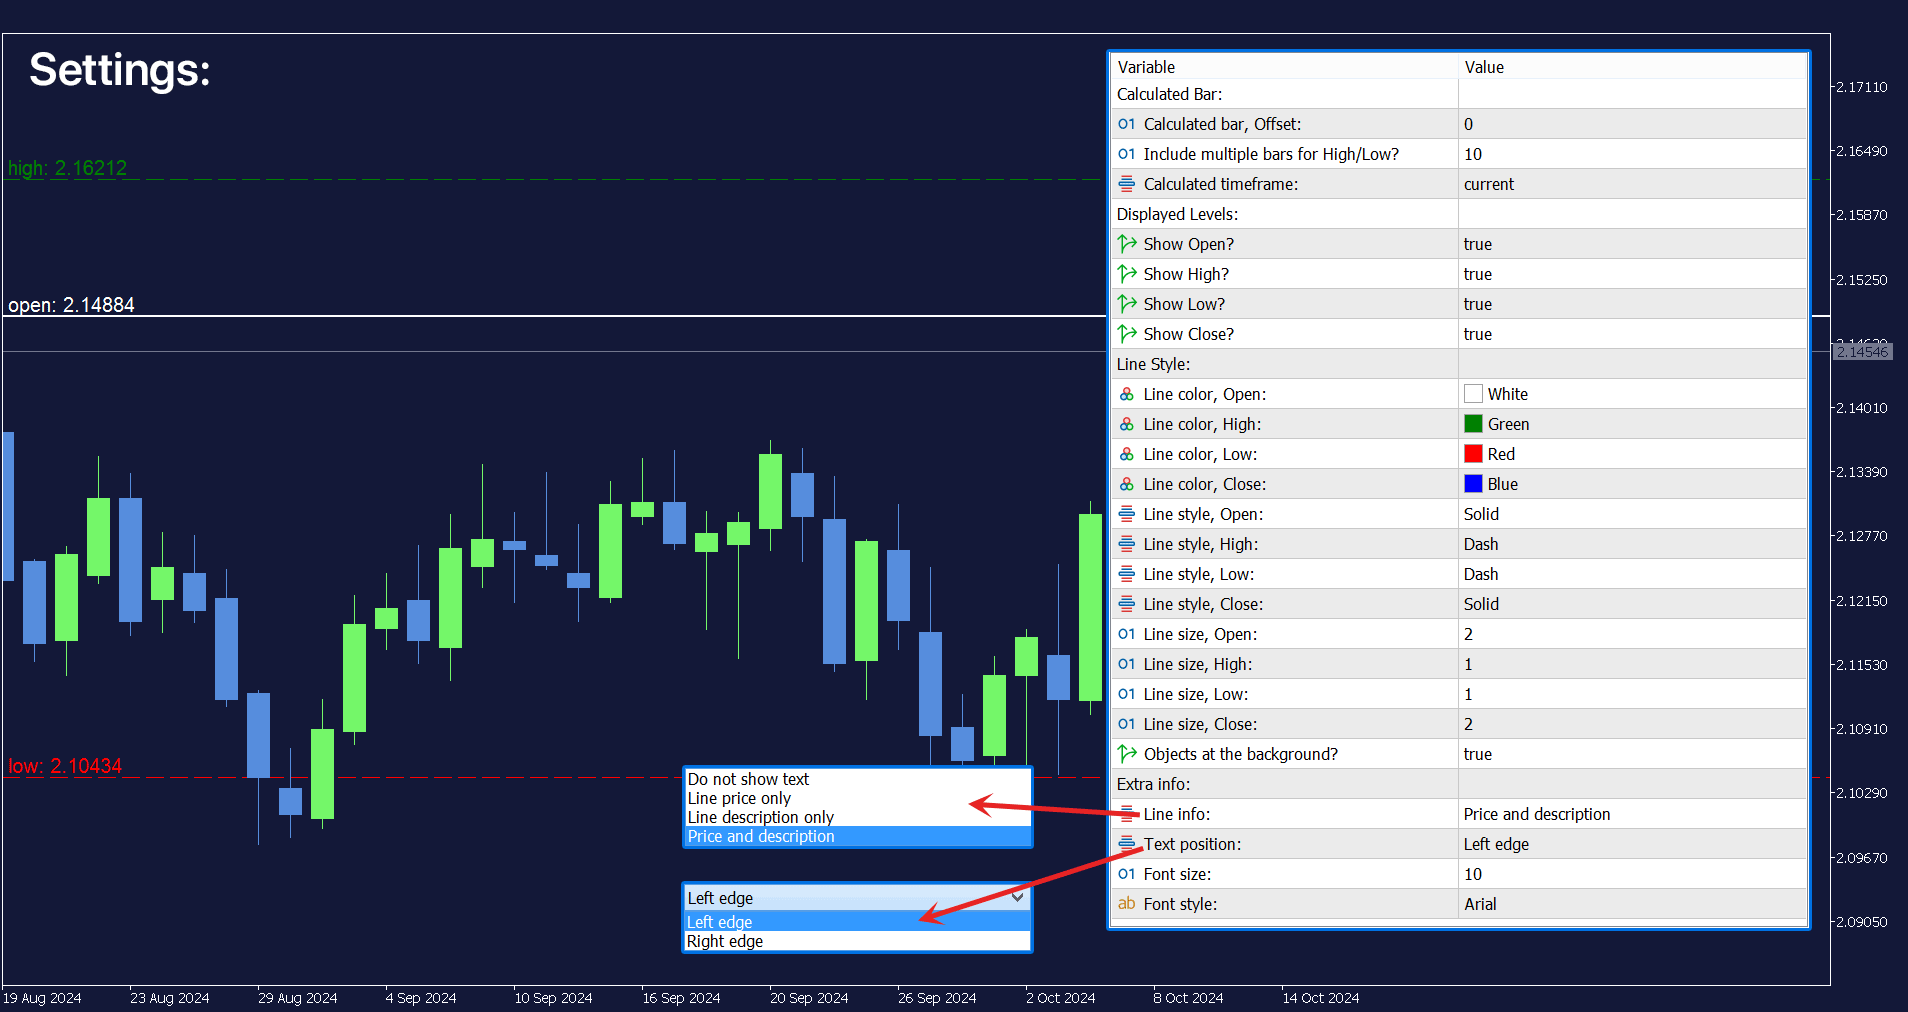
In the settings of the indicator, you can configure:
- Offset of the calculated bar: 0 = current bar, 1 = previous bar, 2 = 2 bars back...
- "Include multiple bars" option:
if > 0: then several bars will be combined to determine the highest and the lowest prices. - Calculated timeframe.
- Each level (OHLC) may be enabled / disabled separetely.
- Lines visualization: colors, style, size, background option.
- Extra info:
- May be disabled;
- Line prices only;
- Line info only;
- Both: info + price;
- Font size and style (if 'extra info' is enabled).
The program file must be placed in the "Indicators" directory.