EZ Advanced Dynamic RSI
- 지표
- Danijel Plesa
- 버전: 1.0
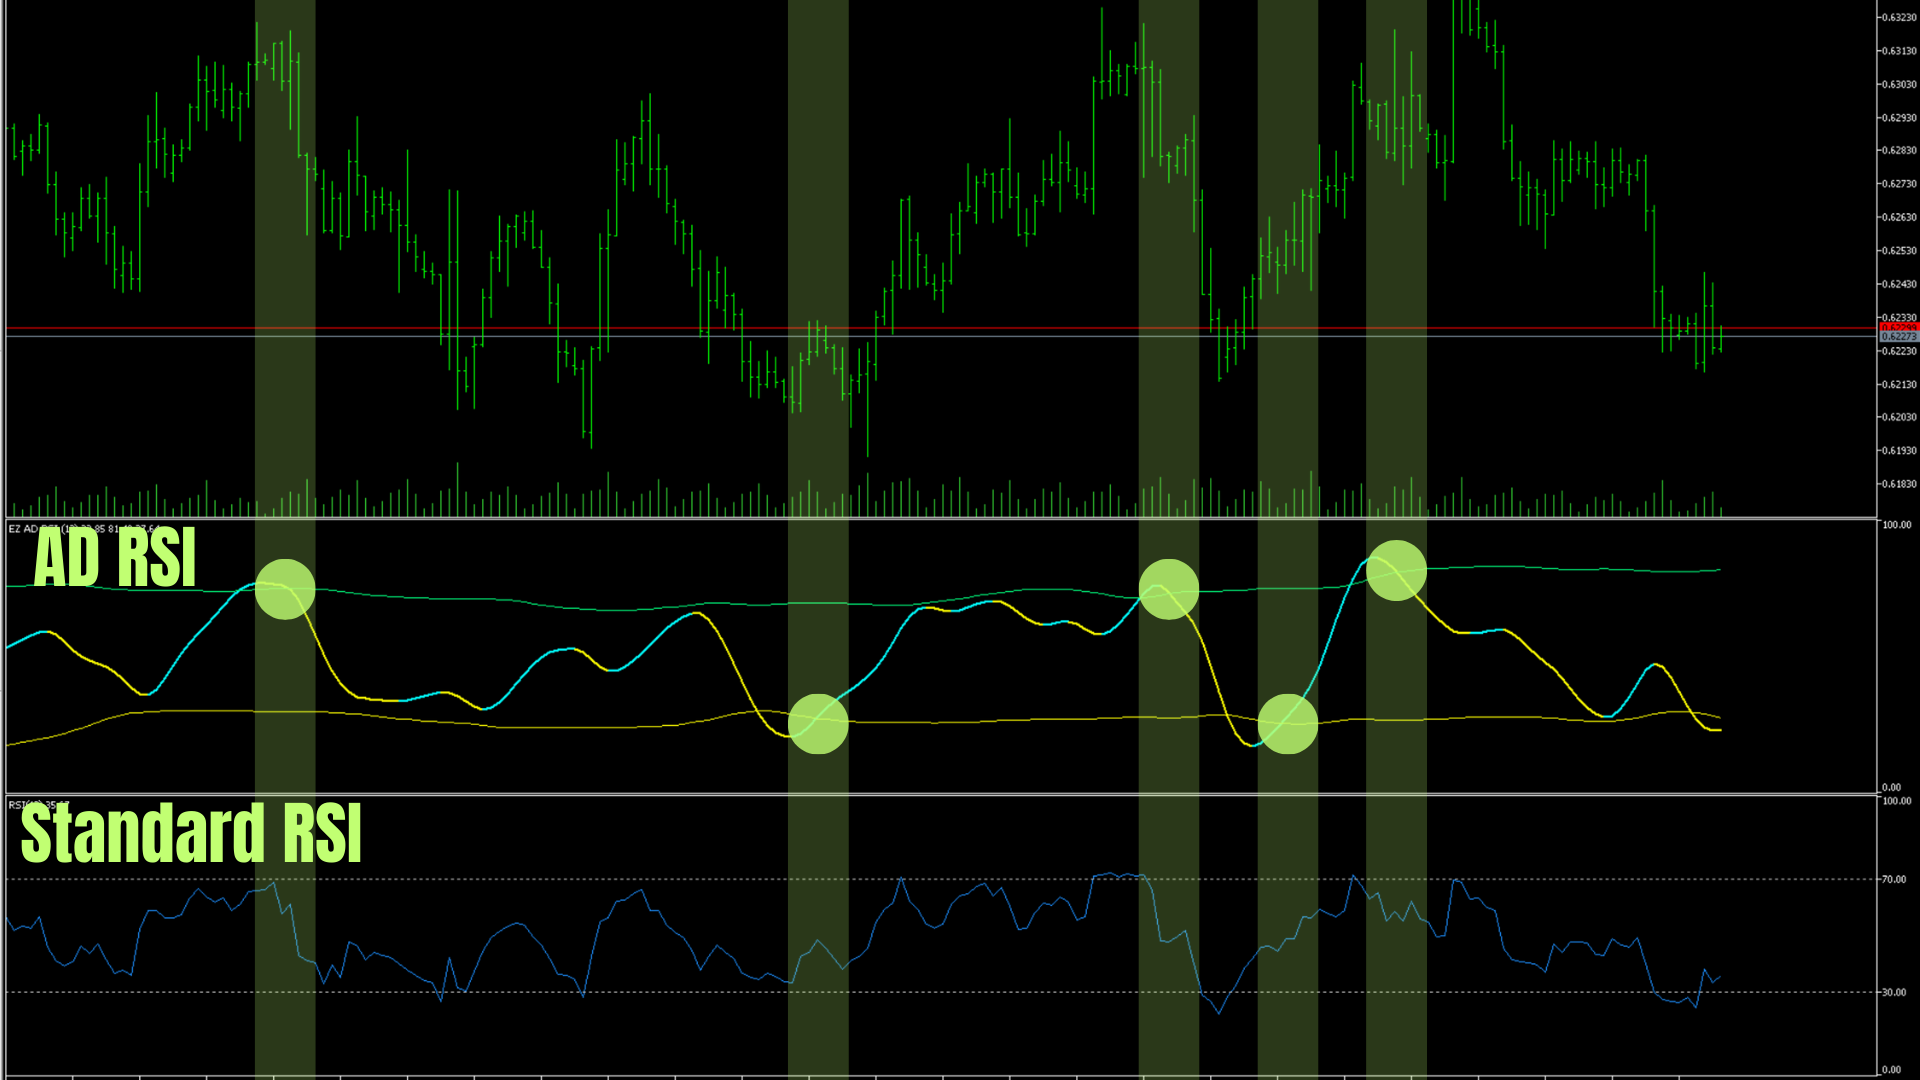
Advanced Dynamic RSI – The Evolution of the Classic RSI
📈 Advanced Dynamic RSI is based on the work of technical analyst J. Welles Wilder and has been further enhanced by Edgezone.
This improved indicator combines Wilder’s proven RSI calculation with modern features and a dynamic smoothing method,
offering more precise and adaptable signals. This enables traders to analyze market volatility and price movements more accurately.
Features and Key Functions
- 🔄 Dynamic Levels: The Advanced Dynamic RSI calculates overbought and oversold levels based on moving averages and standard deviation, adapting flexibly to various market conditions and responding dynamically to volatility changes.
- 📊 Smoothing Options: Inspired by Wilder's original smoothing method, this indicator offers a refined smoothing factor for a more stable RSI line that is less sensitive to short-term market noise.
- 🎨 Visual Customization: Choose colors and style options for the overbought/oversold lines to customize your chart setup and ensure a user-friendly experience.
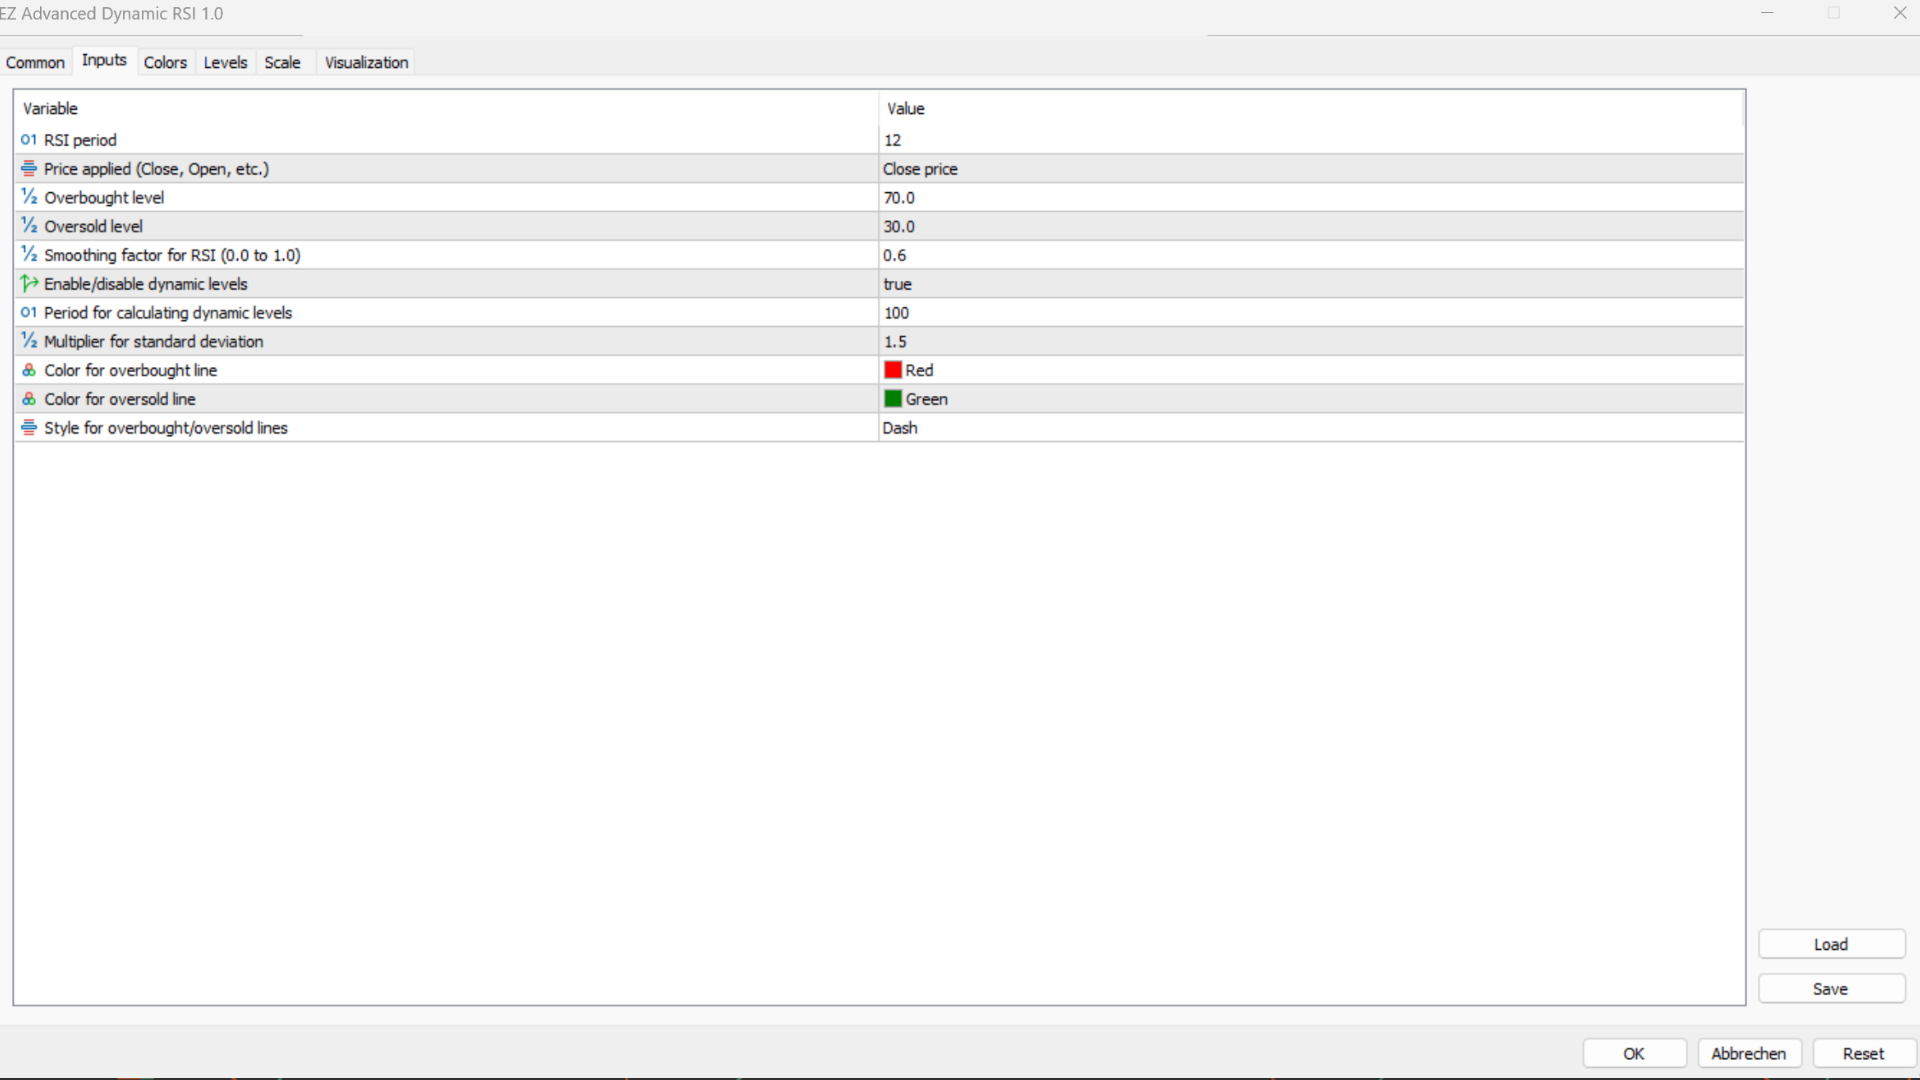
Input Parameters and Their Functions
- 📅 RSI Period (inpPeriod):
Defines the number of periods used for the RSI calculation.
Default: 10 – Suitable for short- to medium-term analysis.
- 💰 Price Source (inpPrice):
Determines which price (e.g., closing or opening price) is used for the calculation.
Options include Close, Open, High, Low, Median, Typical, and Weighted.
- 🎯 Overbought and Oversold Levels (Overbought_Level & Oversold_Level):
Classic fixed values for identifying overbought and oversold markets.
Default: 70 and 30 – These values can be adjusted to use dynamic levels.
- 🌐 Smoothing Factor (Smoothing_Factor):
Controls the smoothing of the RSI and provides a more consistent representation.
Range: 0.0 (no smoothing) to 1.0 (maximum smoothing).
- 🔄 Dynamic Levels (DynamicLevels):
Activates the dynamic calculation of overbought/oversold levels based on moving averages and standard deviation.
Options: True (enabled) / False (disabled).
- 📏 Dynamic Period and Standard Deviation Factor (DynamicPeriod & StdDev_Factor):
Define the timeframe and multipliers for dynamic levels. Higher values expand the overbought/oversold range and reduce sensitivity to short-term fluctuations.
- 🎨 Color Customization and Style (Overbought_Color, Oversold_Color, Level_Line_Style):
Set colors and styles for visual representation. Adjust lines to your preferences with options such as solid or dashed lines.
Application and Benefits
The Advanced Dynamic RSI is ideal for traders who watch for overbought/oversold signals while benefiting from dynamically adjustable levels.
The indicator is suitable for both scalping strategies in short-term markets and trend analysis on higher timeframes.
Its flexibility and precision make it an excellent tool for anyone looking to improve their trading decisions while responding to market conditions.
If you like our AD RSI, please leave us a ⭐️⭐️⭐️⭐️⭐️ rating!
This helps us continue to provide you with high-quality tools for your trading needs!
Afterward, you can simply reach out to us here or through our website.
You’ll then receive an 🎁 EA of your choice from our offerings.


Very good inidcator, but whenever I change the scala lines (fix or free), they jump back to the old settings.