Daily OHLC Levels
- 지표
- Daniel Christian Krause
- 버전: 1.11
- 업데이트됨: 11 10월 2024
- 활성화: 10
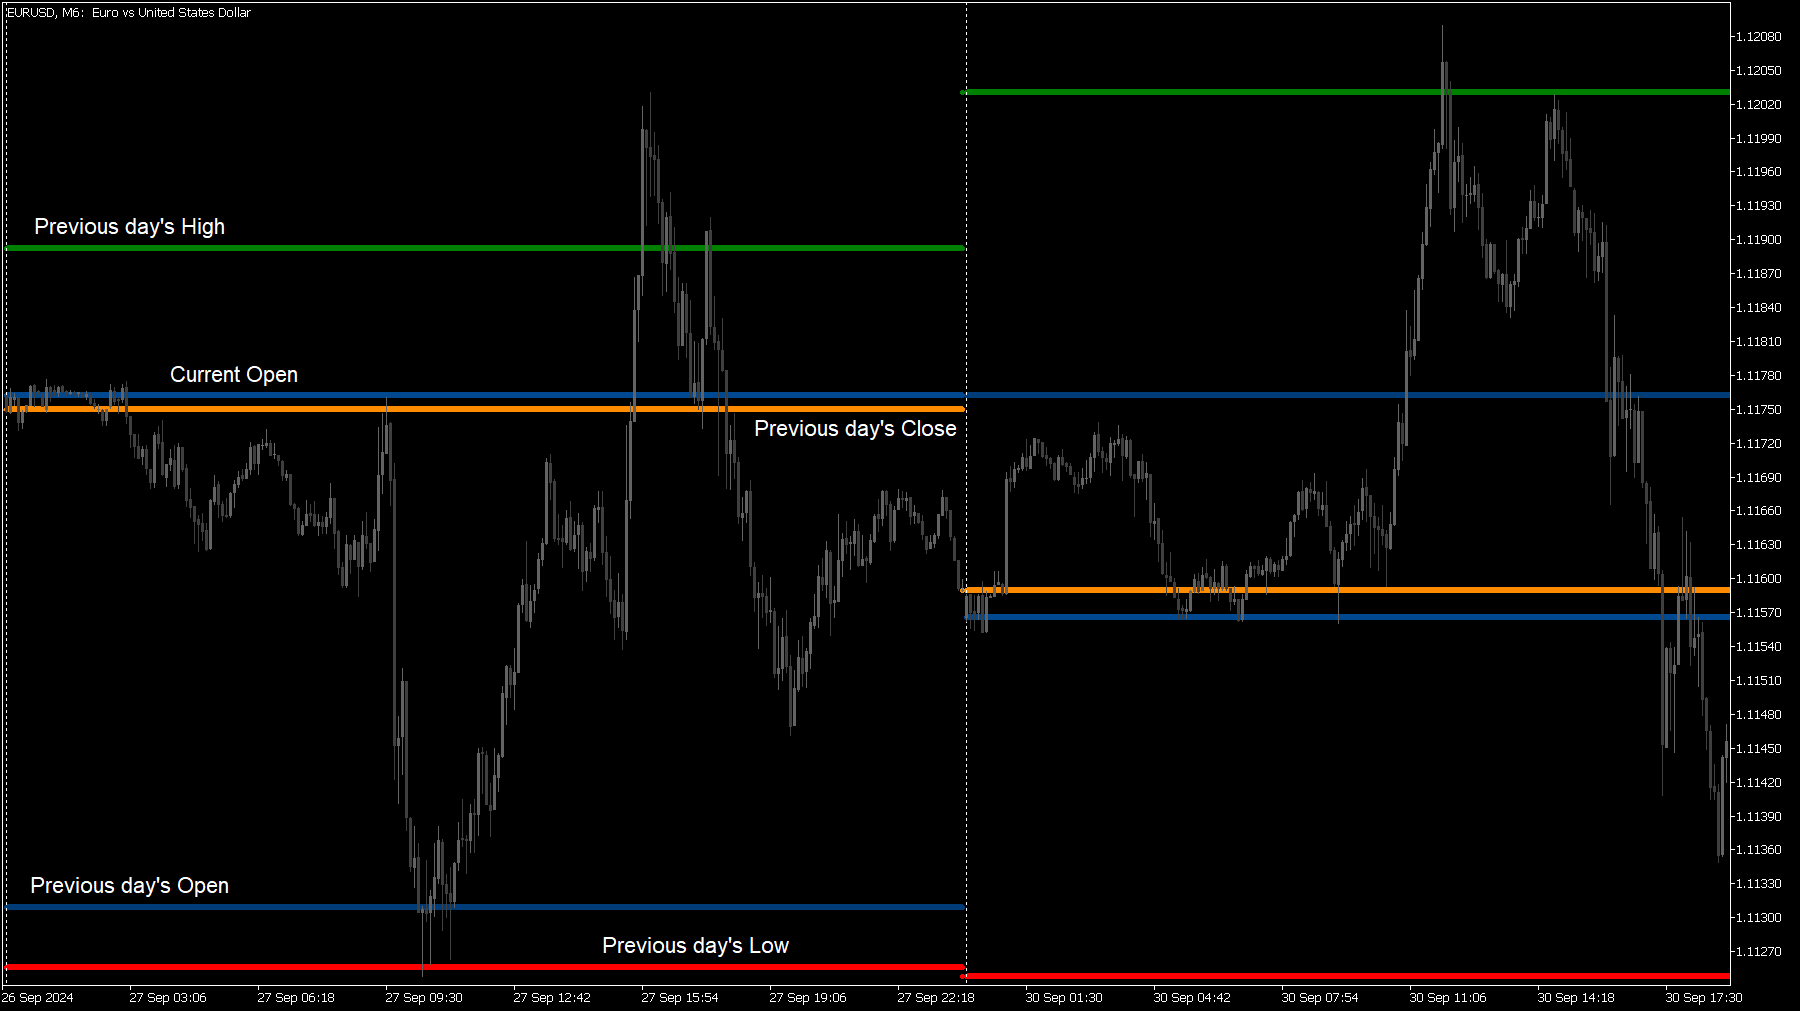
The 'Daily OHLC Levels Visualizer' is an indicator that displays the previous day's open, high, low and close levels as well as today's opening price in customizable color and style and optionally 2 vertical lines at customizable times to indicate a trading session.
Main features of the Daily OHLC Levels Visualizer
- OHLC Display
- Shows previous day's Open, High, Low, and Close prices
- Additionally visualizes the current day's opening price
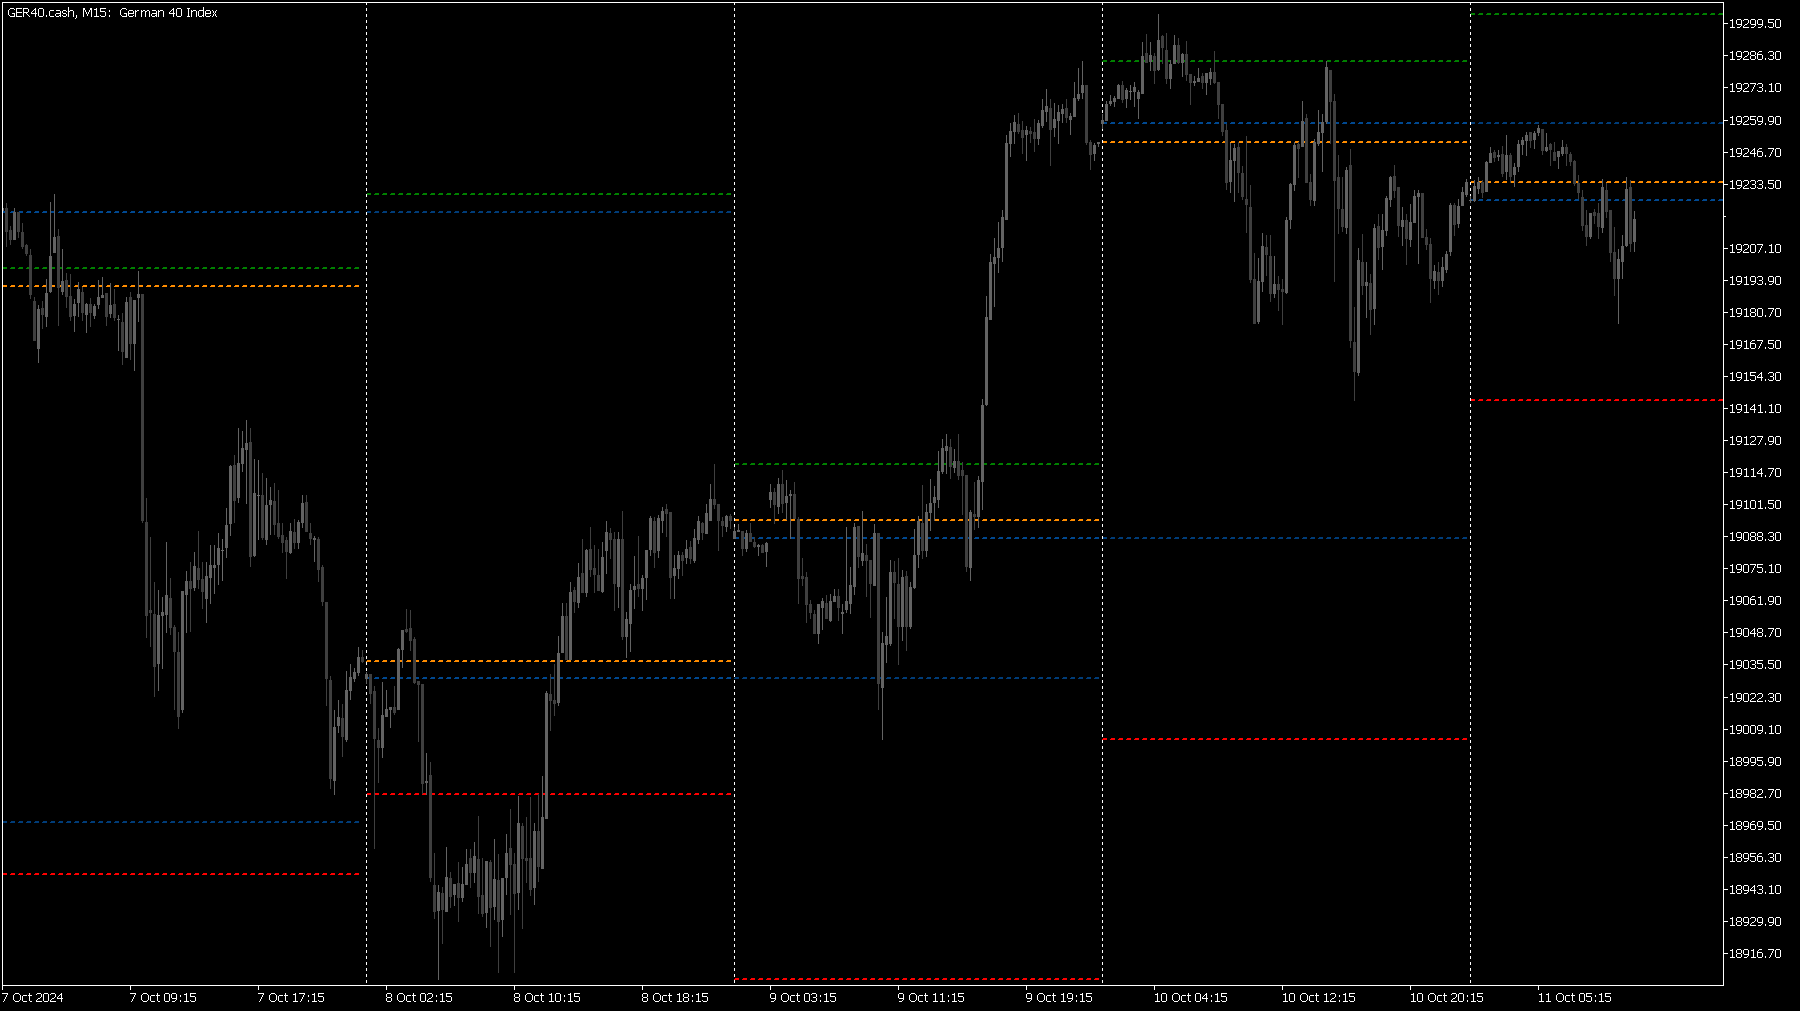
- Supports display of a customizable number of past days
- Highly customizable
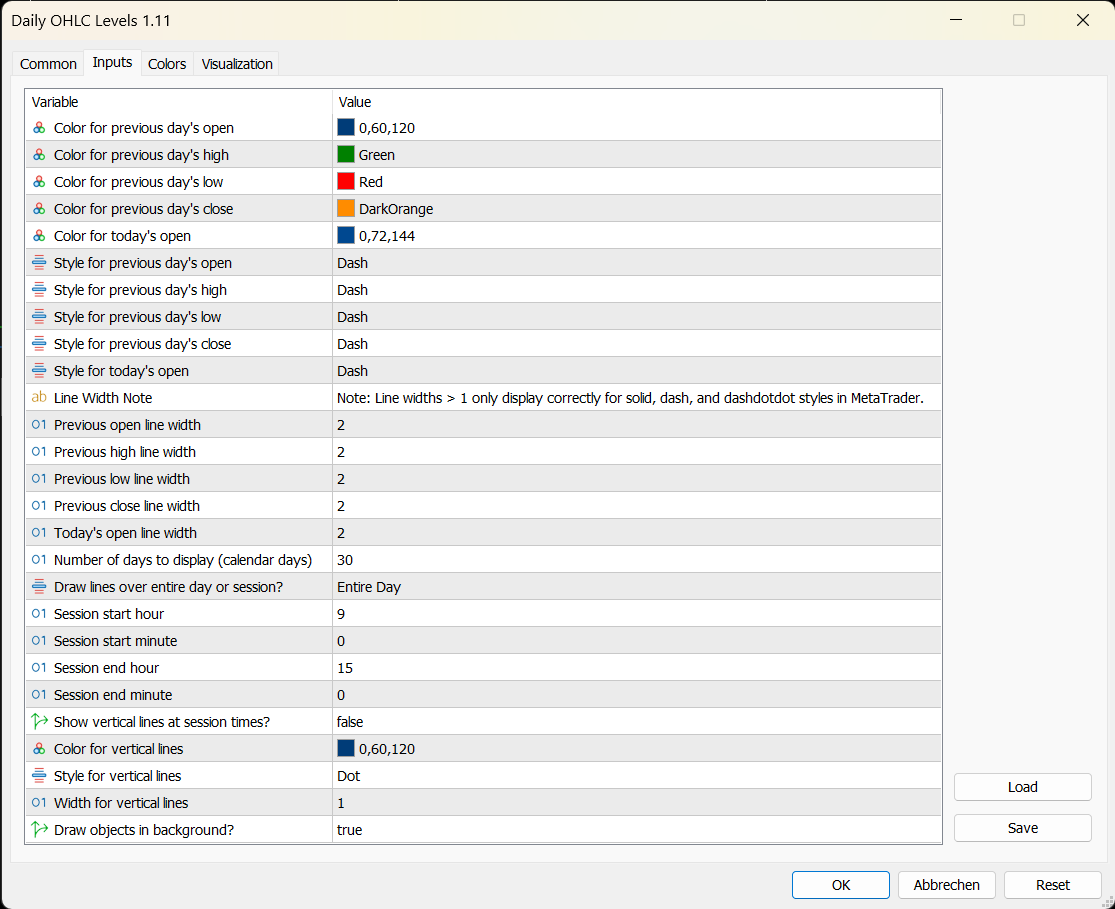
- Individual color selection for each OHLC level
- Flexible line styles (solid, dashed, dotted, etc.) and width
- Adjustable line length: Full day or user-defined times
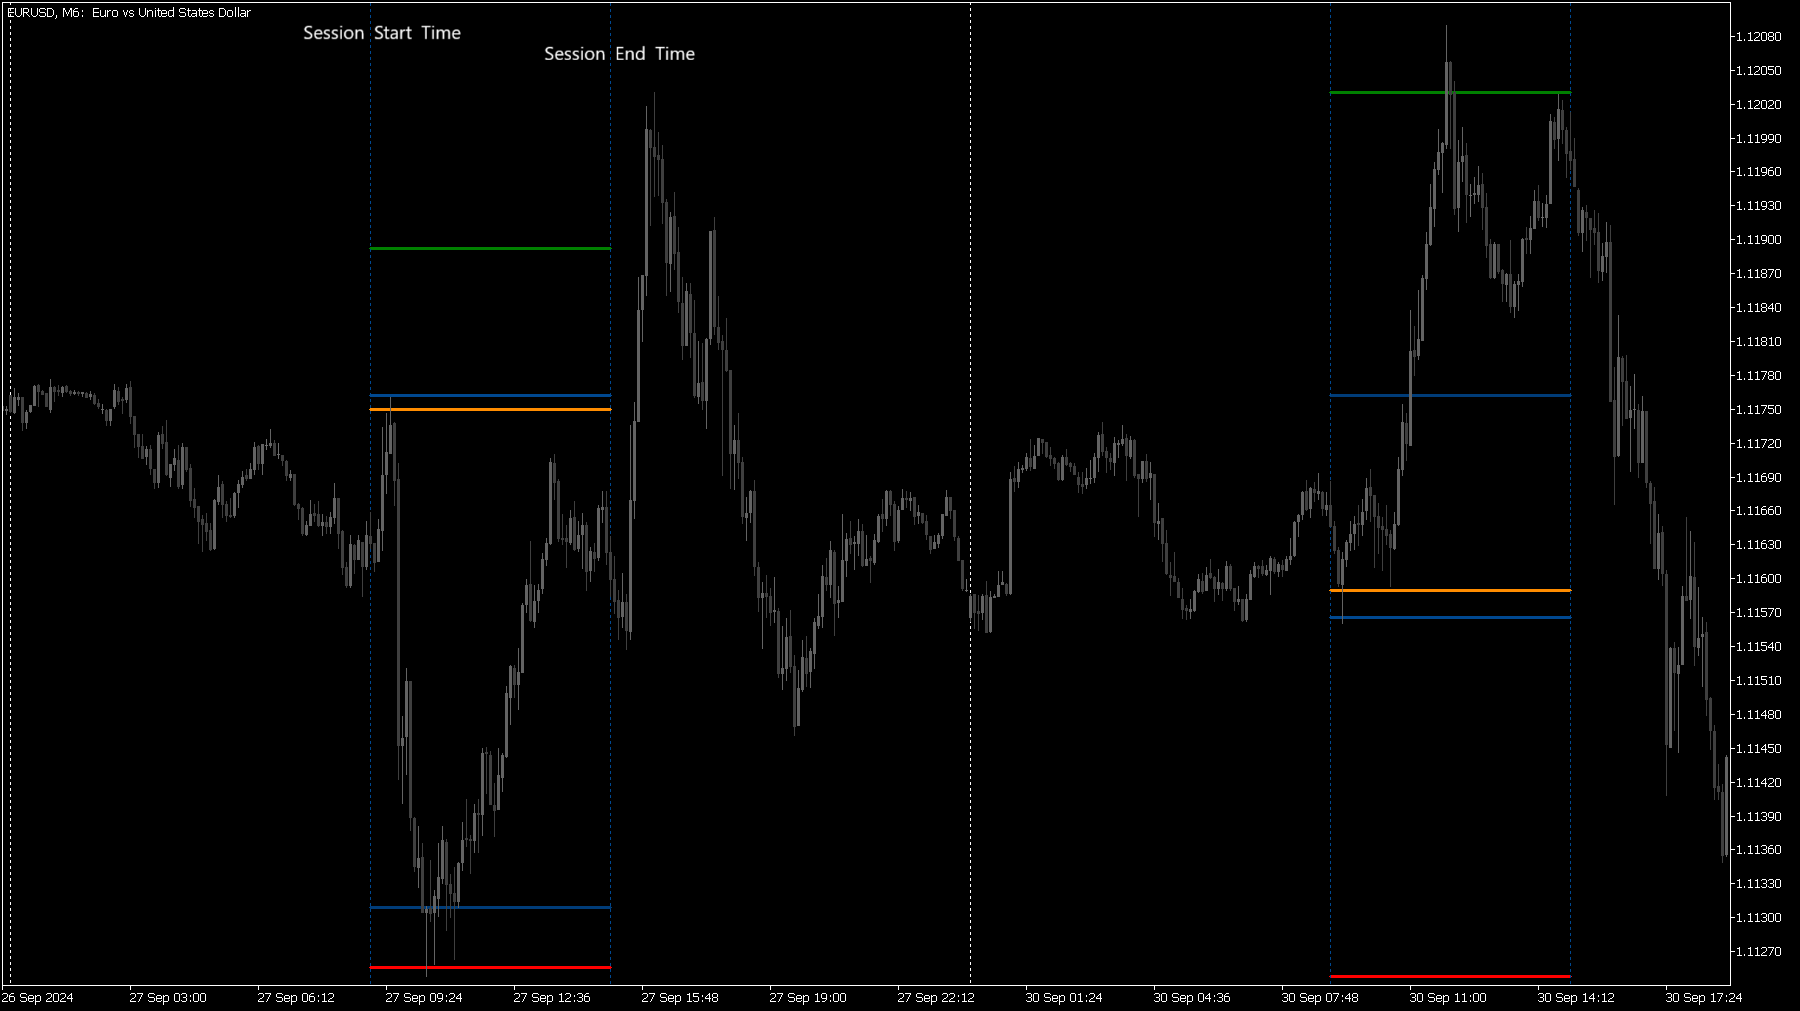
- Session Visualization
- Option to display vertical lines for session start and end times
- Customizable colors and styles for vertical lines (session time lines)
- User-friendly and flexible
- Ideal for day traders
- Clear, uncluttered charts
- Option to draw lines in the background
- Enhanced market analysis
- Recognize important support and resistance at a glance
- Helps identify liquidity zones (also relevant for ICT or SMC traders)
- Can be used to support various trading styles and strategies
- Identify trend reversals and breakouts more easily
- Optimize your entry and exit points
Why you should choose this indicator
- Increase your trading accuracy through clear visualization of important price levels that institutional and other large market participants (Smart Money) pay attention to
- Save time in preparation and backtesting through automated OHLC (open high low close) level display
- Easily customize the indicator to fit your personal preferences
Instructions
- Load the indicator on your preferred chart
- Adjust the settings to your liking (colors, styles, session times if applicable)
- Enjoy trading and good luck!