Gann Box MT5
- 지표
- Frederic Jacques Collomb
- 버전: 1.0
- 활성화: 5
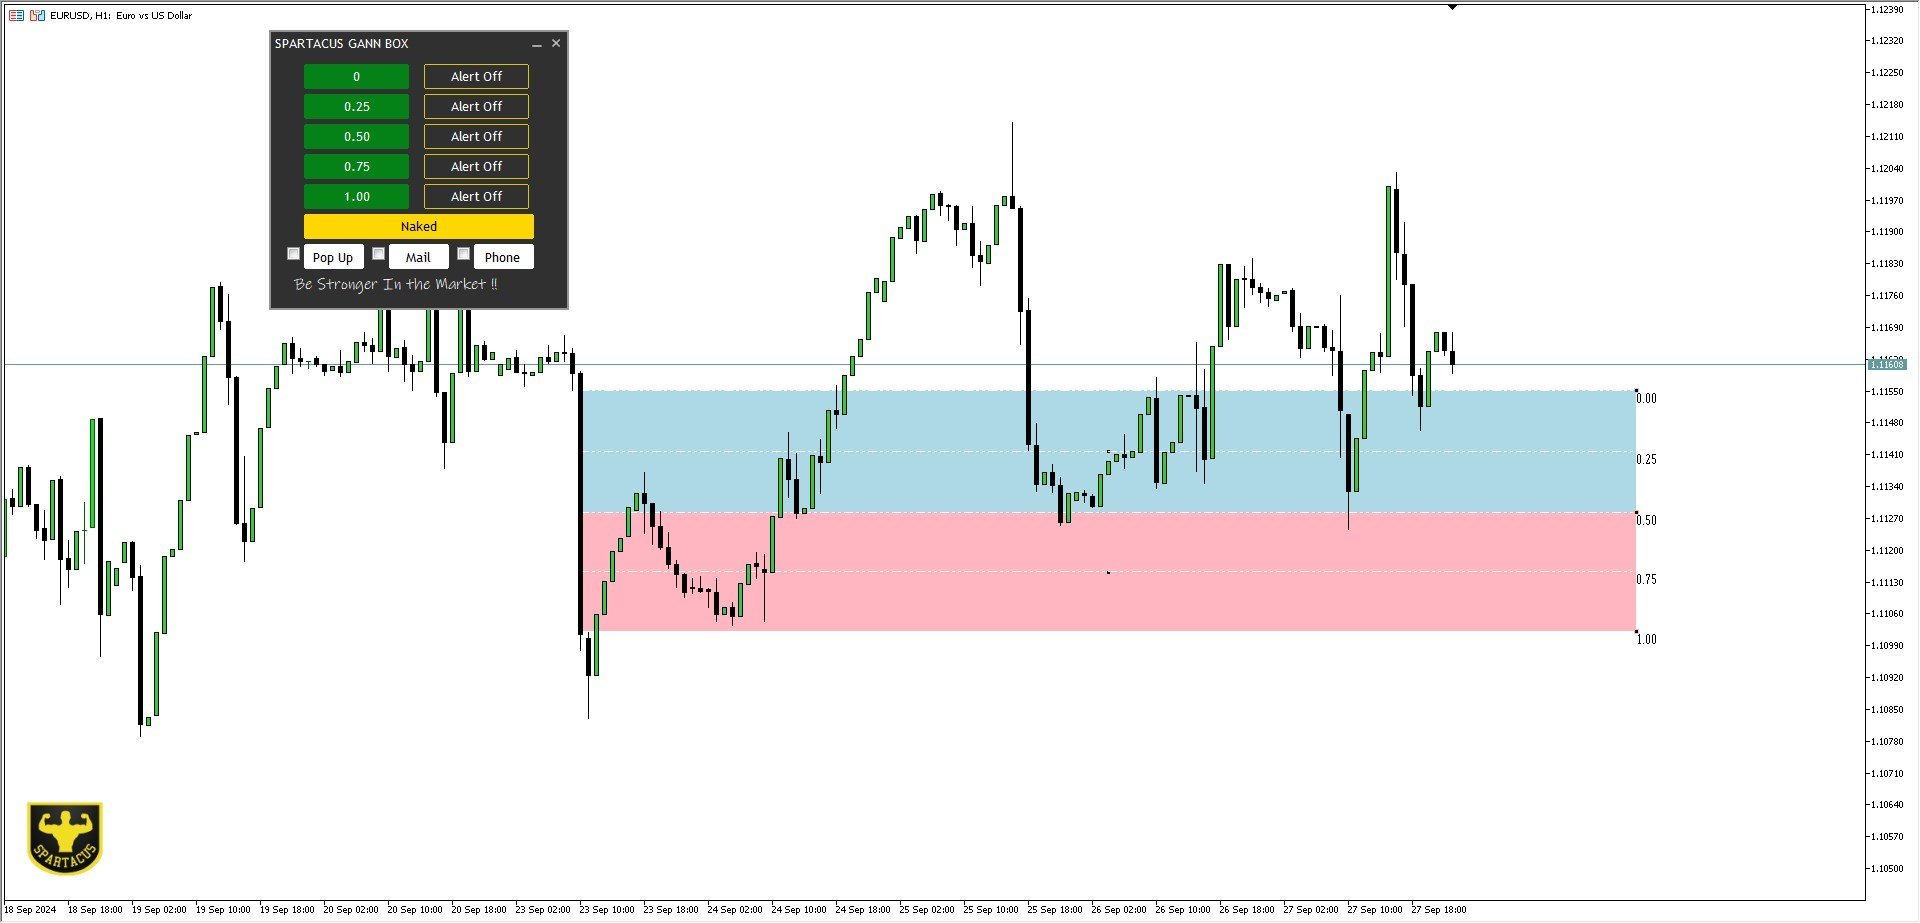
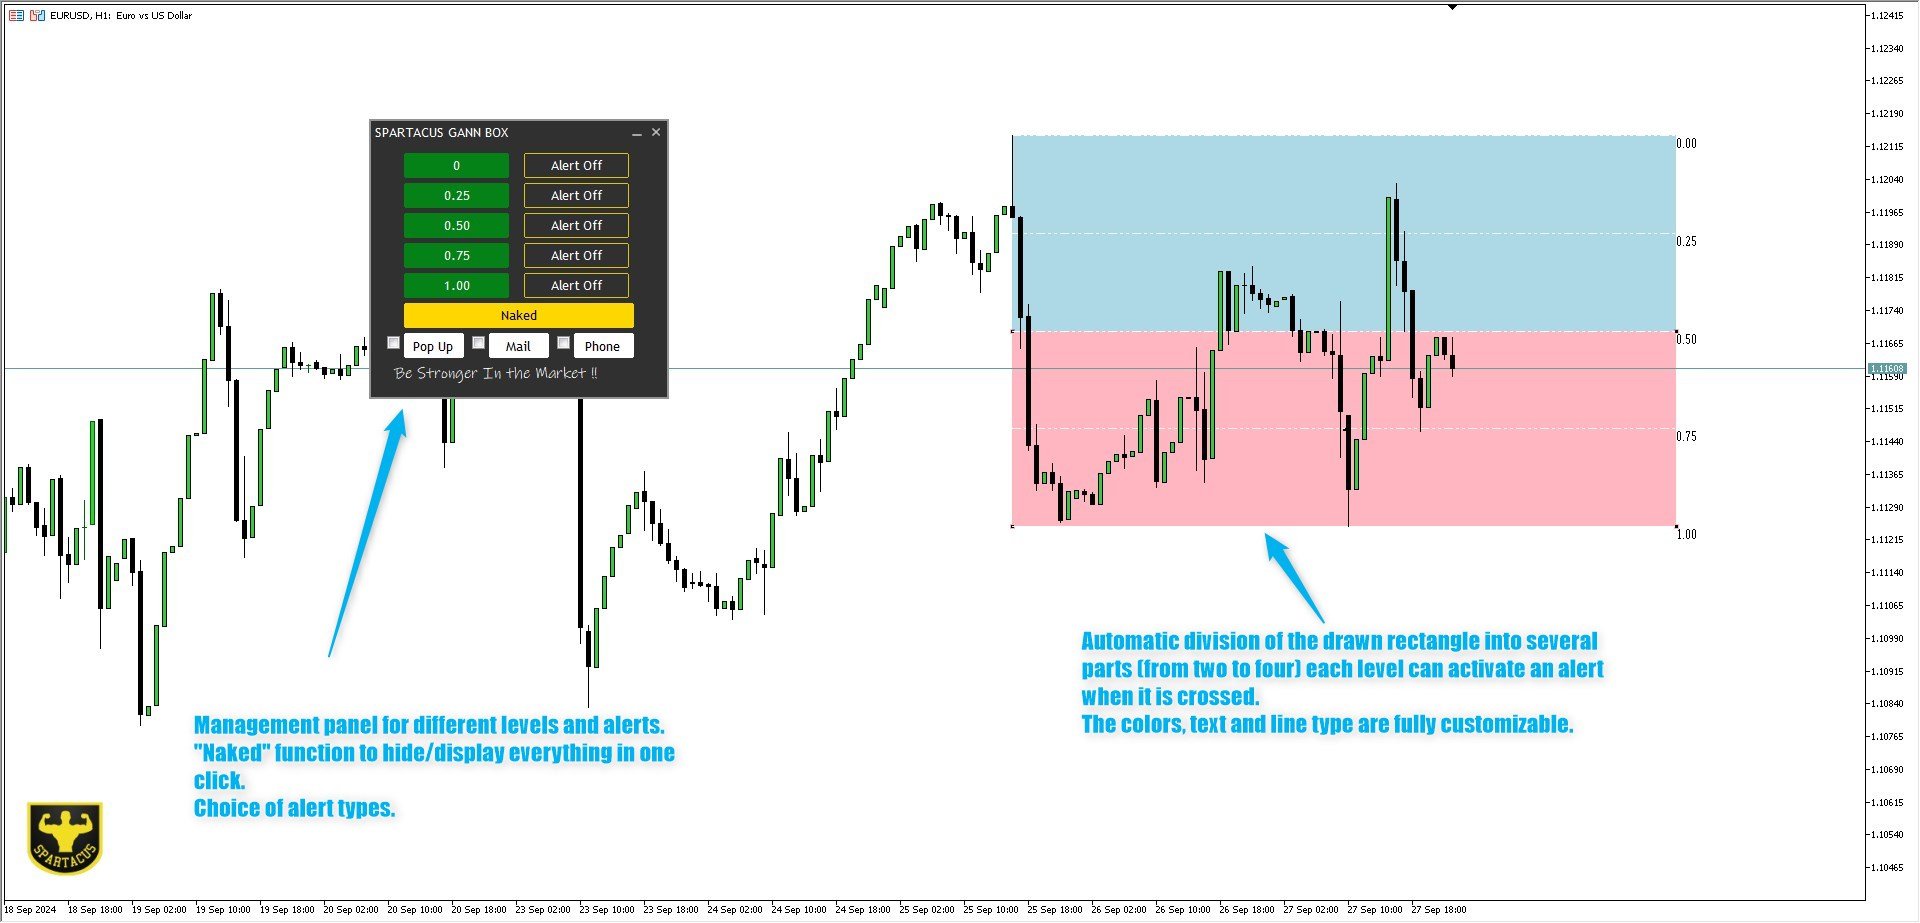
Gann Box 지표는 트레이더가 시장의 핵심 수준을 식별하고 활용할 수 있도록 설계된 강력하고 다재다능한 도구입니다. 이 지표는 차트에 직사각형을 그릴 수 있게 해주며, 자동으로 전략적 수준인 0, 0.25, 0.50, 0.75, 1로 여러 영역으로 나뉩니다. 가격이 이 중 하나의 수준에 도달하면 경고가 활성화되어 거래 결정을 내리는 데 귀중한 도움을 제공합니다. 그리신 영역에 대한 시장의 변화를 즉시 알 수 있습니다. 영역을 그리려면 간단한 직사각형을 그리고 이름을 GannBox로 바꾸기만 하면 됩니다.
이 지표는 지지 및 저항, 공급 및 수요 개념을 사용하는 트레이더, ICT 기술을 사용하는 트레이더, 또는 공정 가치 갭 (FVG) 전문가 등 모든 유형의 트레이더를 위해 설계되었습니다.
일일 거래자, 스윙 거래자 또는 포지션 거래자이든, Gann Box는 시장의 움직임을 더 잘 이해하고 예측하는 데 도움을 주어 반응성과 성과를 향상시킵니다.
MT4 버전
Gann Box는 다중 시간 프레임 지표입니다: H1과 같은 더 큰 시간 프레임에 그릴 수 있으며, 15분과 같은 더 작은 시간 프레임에서 포지션을 취할 수 있도록 하여 더 정확하고 빠른 거래를 가능하게 합니다.
유연성 외에도 이 도구는 직관적인 관리 패널을 통해 차트에서 직접 완전히 사용자 정의할 수 있습니다. 이 패널은 귀하의 선호도에 따라 각 수준을 활성화하거나 비활성화하고 관련 경고를 활성화하거나 비활성화할 수 있게 해줍니다. 트레이더는 이메일, 팝업 또는 푸시 알림과 같은 세 가지 유형의 경고 중에서 선택할 수 있어 중요한 신호를 놓치는 일이 없습니다.
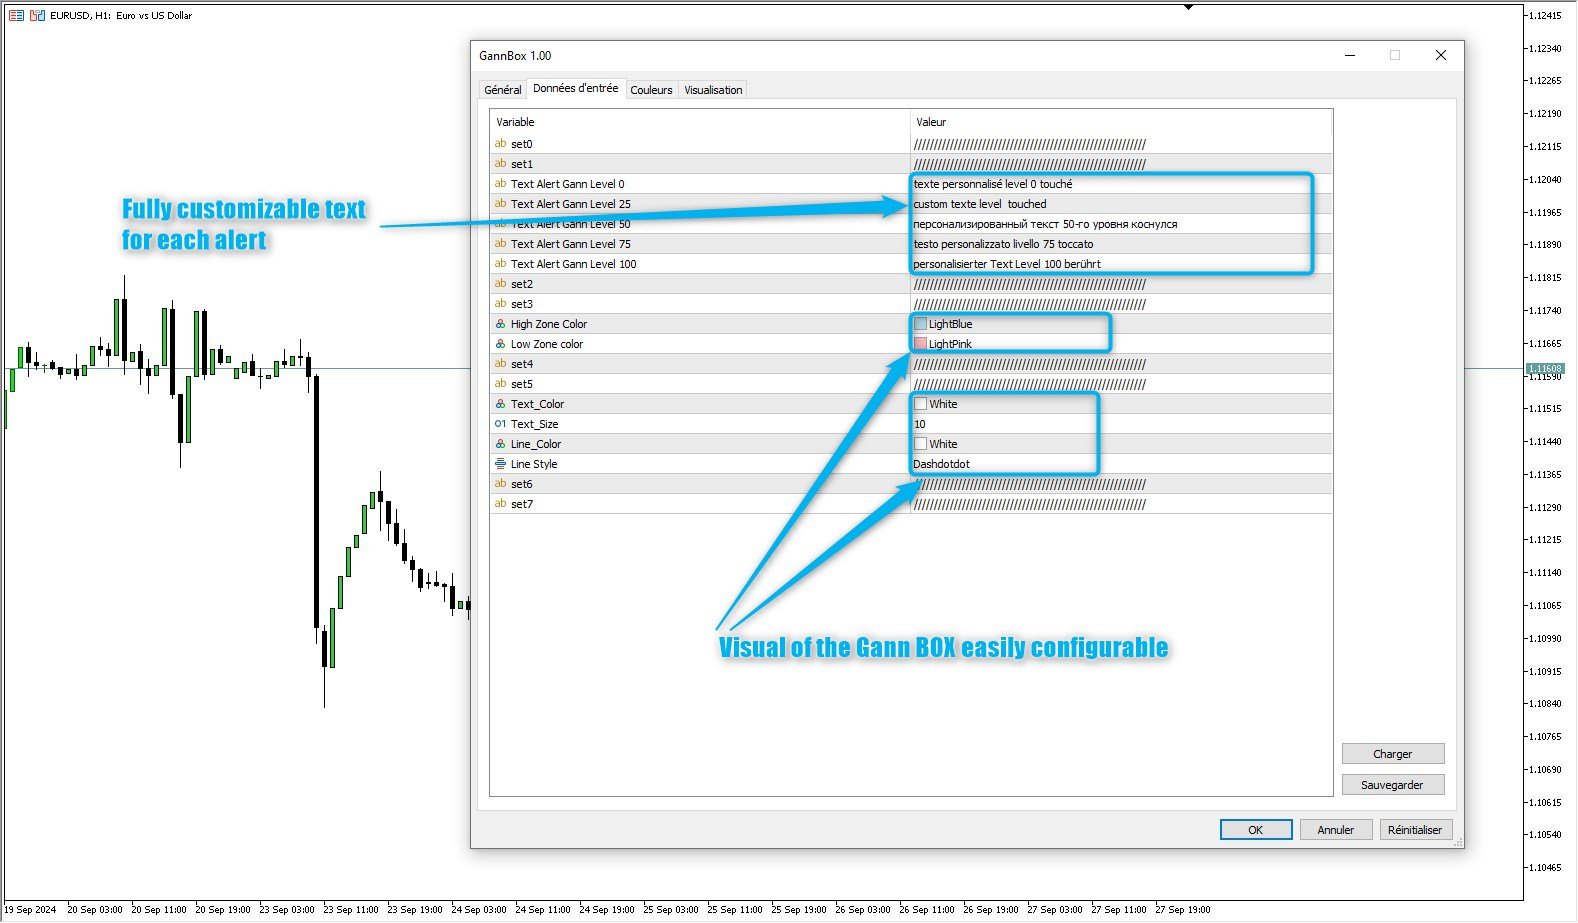
마지막으로, Gann Box는 완전한 사용자 정의 기능을 제공합니다. 텍스트의 크기와 색상을 수정하고, 다양한 영역의 색상을 조정하며, 경고 텍스트를 완전히 개인화하여 귀하의 특정 요구 사항에 완벽하게 부합하도록 할 수 있습니다.
SPARTACUS©2024