• 미리보기
  • 리뷰
  • 코멘트

Forex Scalper Indicator for MT4

Forex Scalper Indicator – 금융 시장에서 수익을 창출하는 정밀 도구

MT4용 Forex Scalper Indicator는 시장에서 최대한의 정밀도로 스캘핑하려는 모든 트레이더에게 완벽한 동반자입니다. 정확한 데이터에 기반한 분석 덕분에 이 지표는 빠른 의사 결정을 내리는 데 이상적인 적시의 정확한 신호를 제공합니다.

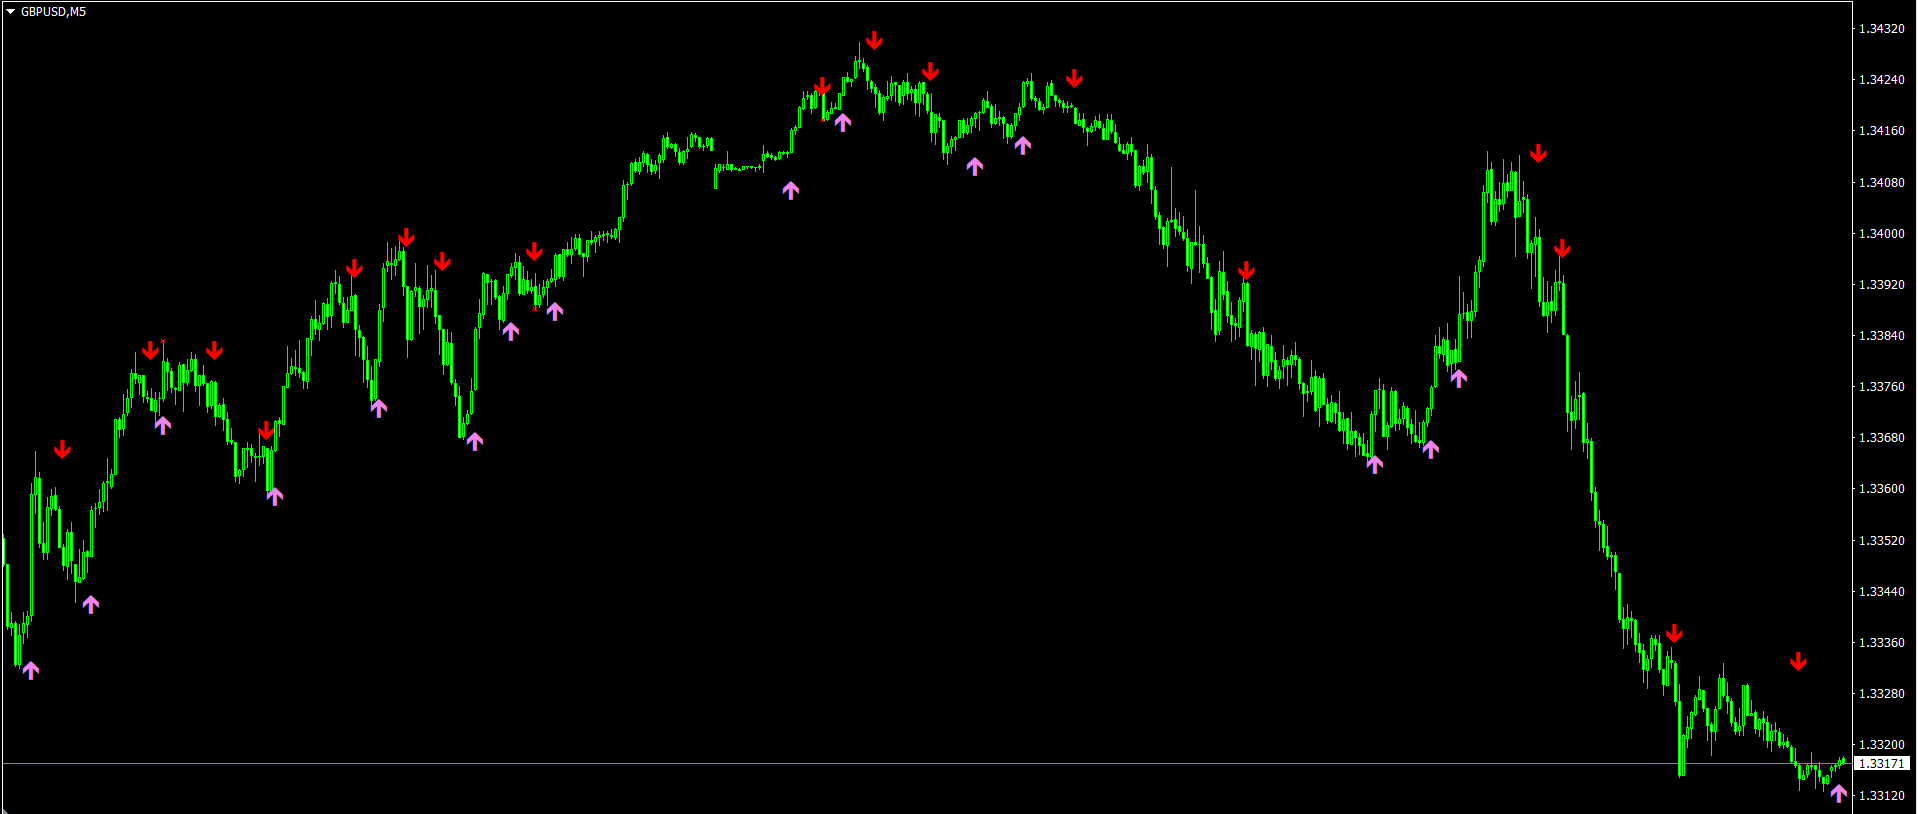
맞춤형 정밀도 차트에 표시되는 각 화살표는 신중한 계산을 기반으로 하며 최고의 진입 및 종료 기회를 제공합니다. 이들은 임의의 신호가 아닌 실시간으로 시장을 분석하는 정확한 지침입니다.

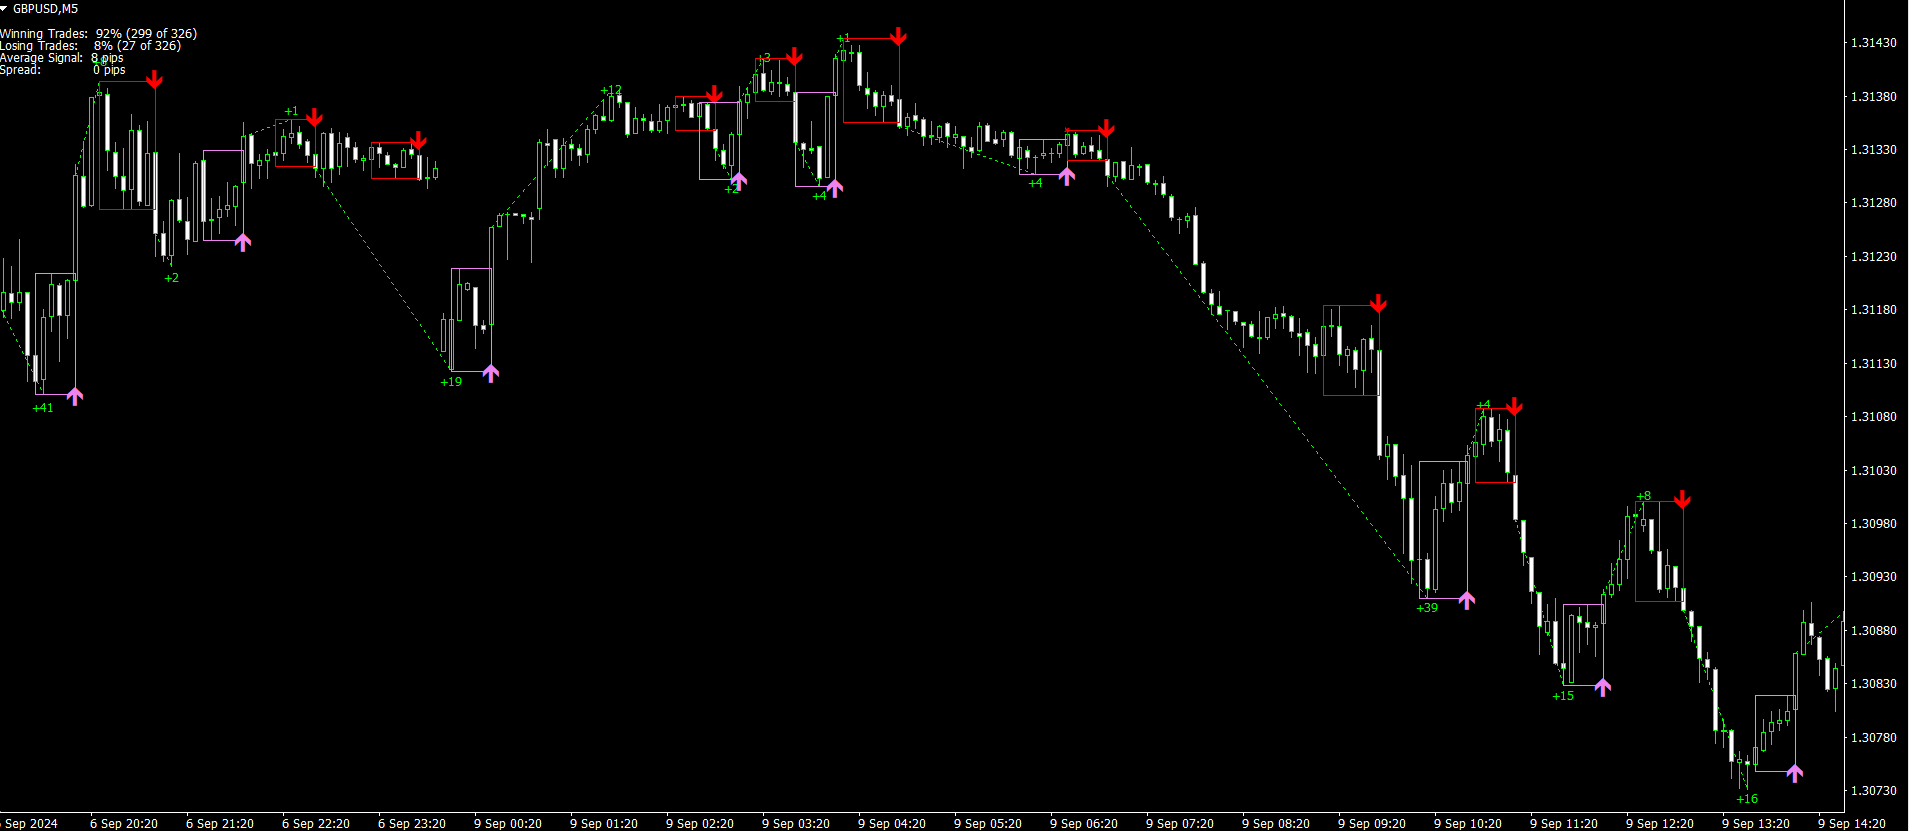
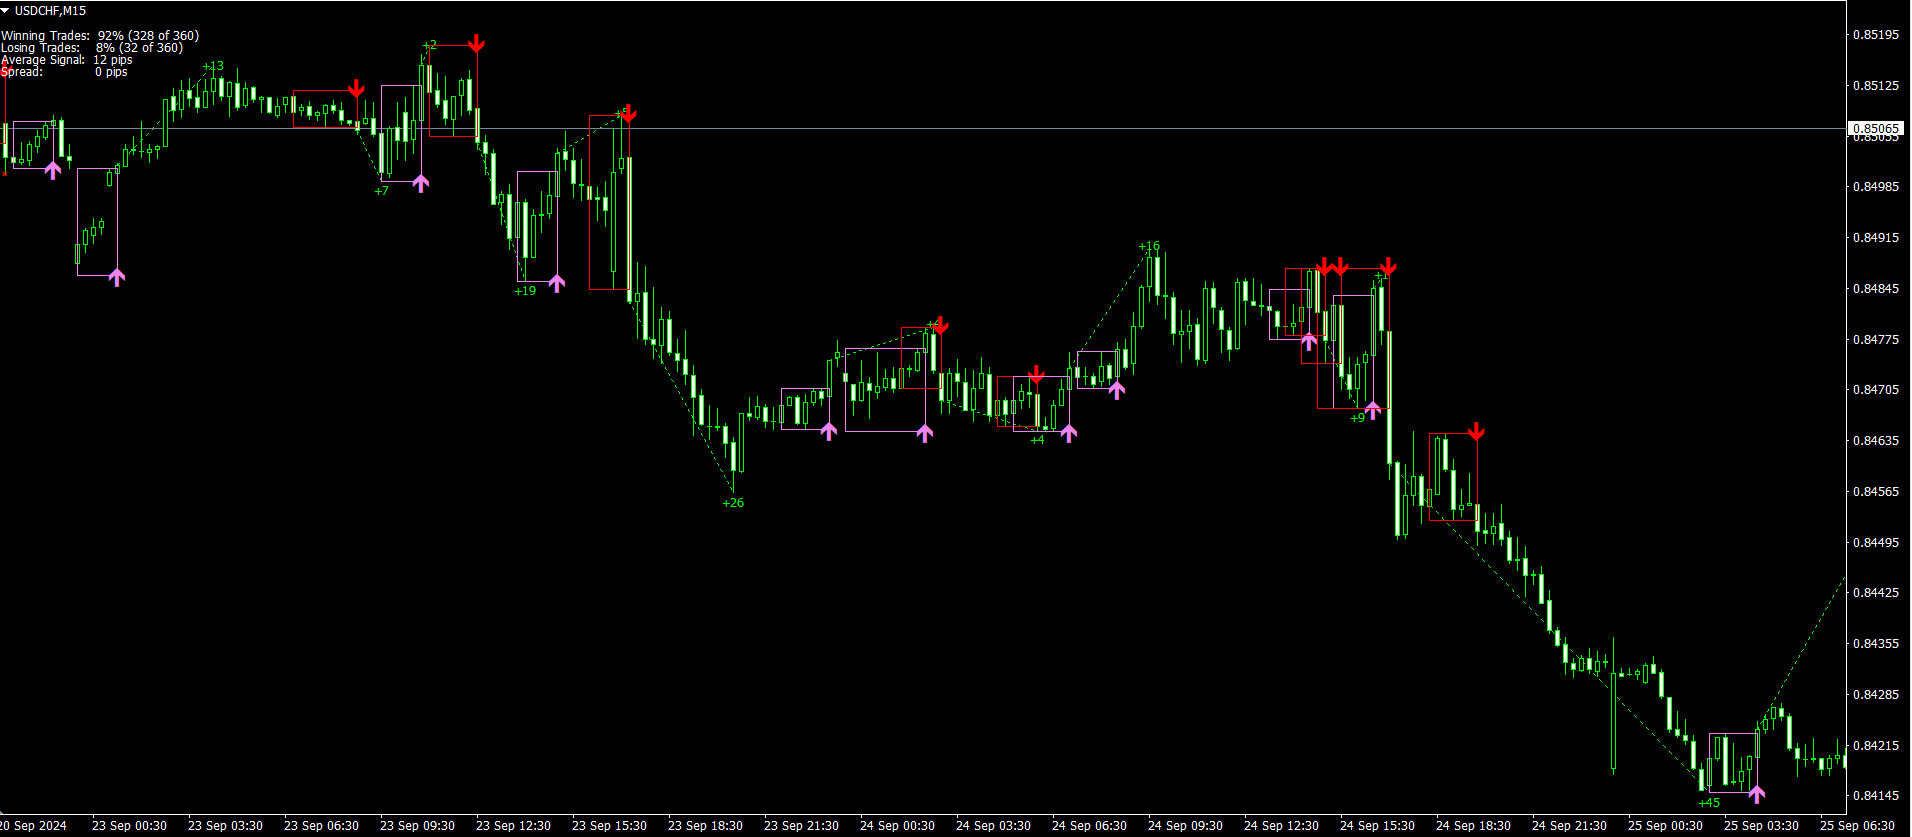
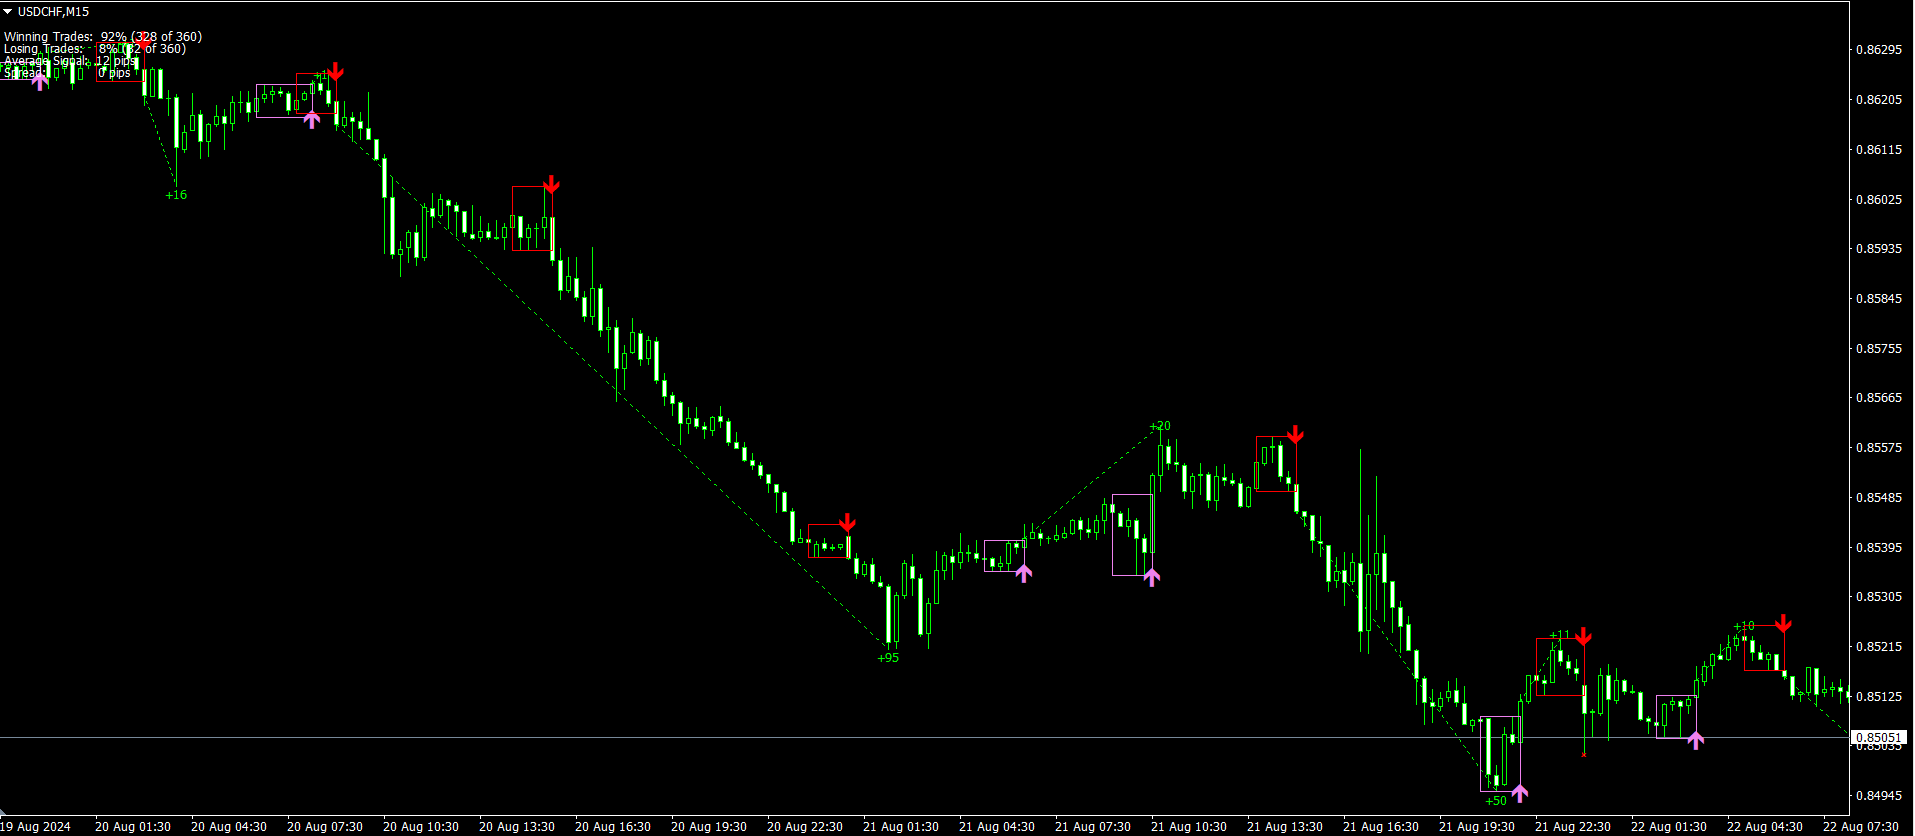
전환점의 정확한 감지 이 지표는 가격의 잠재적인 전환점을 높은 정확도로 식별하여 트레이딩에 필수적인 도구가 됩니다. 신뢰할 수 있는 데이터를 기반으로 생성된 신호 덕분에 시장의 가장 변동성이 큰 시기에도 수익을 극대화할 수 있습니다.

깨끗하고 읽기 쉬운 인터페이스 스크린샷에서 볼 수 있듯이 Forex Scalper Indicator는 차트에 명확하고 깔끔한 화살표를 직접 표시하여 신호를 쉽게 읽고 해석할 수 있도록 합니다. 가장 작은 움직임을 포착하거나 더 결정적인 신호를 기다리고 있는 경우에도 이 지표는 정확하고 즉각적인 통찰력을 보장합니다.

Forex Scalper Indicator를 선택해야 하는 이유는 무엇입니까?

정확한 데이터에 기반한 신뢰할 수 있는 정확한 신호

더 낮은 시간 프레임에서 스캘핑 전략에 이상적

MT4에서 설치 및 구성하기 쉬움

모든 수준의 트레이더에게 완벽함


지금 Forex Scalper Indicator를 얻어 거래의 정확도를 향상시키십시오! 정확한 데이터에 기반한 더 많은 정보에 입각한 거래 기회를 놓치지 마십시오.
추천 제품
We present you the indicator "Candle closing counter", which will become your indispensable assistant in the world of trading. That’s why knowing when the candle will close can help: If you like to trade using candle patterns, you will know when the candle will be closed. This indicator will allow you to check if a known pattern has formed and if there is a possibility of trading. The indicator will help you to prepare for market opening and market closure. You can set a timer to create a p
Blahtech Market Profile
Blahtech Limited
4.56 (16)
Was: $249  Now: $99   Market Profile defines a number of day types that can help the trader to determine market behaviour. A key feature is the Value Area, representing the range of price action where 70% of trading took place. Understanding the Value Area can give traders valuable insight into market direction and establish the higher odds trade. It is an excellent addition to any system you may be using. Blahtech Limited presents their Market Profile indicator for the MetaTrader community. Ins
KT Renko Patterns MT4
KEENBASE SOFTWARE SOLUTIONS
2.33 (3)
KT Renko Patterns scans the Renko chart brick by brick to find some famous chart patterns that are frequently used by traders across the various financial markets. Compared to the time-based charts, patterns based trading is easier and more evident on Renko charts due to their uncluttered appearance. KT Renko Patterns features multiple Renko patterns, and many of these patterns are extensively explained in the book titled Profitable Trading with Renko Charts by Prashant Shah. A 100% automate
Super Reversal Pattern
Parfait Mujinga Ndalika
Super Reversal Pattern Indicator Unlock the power of advanced pattern recognition with our Super Reversal Pattern Indicator. Designed for traders seeking precision and reliability, this indicator identifies one of the most effective reversal patterns in technical analysis, offering a significant edge in your trading strategy. Key Features: Non-Repainting Accuracy: Enjoy the confidence of non-repainting technology. Once a Super Reversal Pattern is detected, it remains static, providing consis
Shark Deal Book
Philip Pankaj Suthagar
4 (3)
Term  "shark"  in the business world denotes a high volume investor who just made a good investment in a highly Potential business deal.So, sharks are the ones who make the market move. In our case, if an American shark bought a Japanese company, he/she has to convert American dollars into Japanese yen to make the deal. So, the demand for the Japanese yen will increase sharply. Thus USD/JPY will go short rapidly if the deal was from the shark. Another example, In the case of forex, if fed increa
Introduction to Chart Pattern MT Chart Pattern MT is a chart pattern scanner to detect the triangle pattern, falling wedge pattern, rising wedge pattern, channel pattern and so on. Chart Pattern MT uses highly sophisticated chart pattern detection algorithm. However, we have designed it in the easy to use with intuitive user interface. Chart Pattern MT will show all the patterns in your chart in the most efficient format for your trading. You do not have to do tedious manual pattern detection an
캔들의 종가를 예측하는 지표입니다. 지표는 주로 D1 차트에서 사용하기 위한 것이. 이 지표는 전통적인 외환 거래와 바이너리 옵션 거래 모두에 적합합니다. 지표는 독립형 거래 시스템으로 사용하거나 기존 거래 시스템에 추가로 사용할 수 있습니다. 이 표시기는 현재 양초를 분석하여 양초 본체 내부의 특정 강도 요인과 이전 양초의 매개변수를 계산합니다. 따라서 지표는 시장 움직임의 추가 방향과 현재 양초의 종가를 예측합니다. 이 방법 덕분에 지표는 단기 및 중장기 거래 모두에 적합합니다. 지표를 사용하면 시장 상황을 분석하는 동안 지표가 생성할 잠재적 신호의 수를 설정할 수 있습니다. 표시기 설정에는 이를 위한 특별한 매개변수가 있습니다. 또한 인디케이터는 새로운 신호에 대해 차트의 메시지 형태, 이메일 및 PUSH 알림 형태로 알릴 수 있습니다. 구매 후 저에게 꼭 써주세요! 나는 당신에게 지표와 거래에 대한 나의 추천을 줄 것입니다! 또한 보너스를 받으세요!
M W Pattern Pro
Noiros Tech
4.14 (7)
M & W Pattern Pro is an advanced scanner for M and W patters , it uses extra filters to ensure scanned patterns are profitable. The indicator can be used with all symbols and time frames. The indicator is a non repaint indicator with accurate statistics calculations. To use , simply scan the most profitable pair using the statistics dashboard accuracy , then enter trades on signal arrow and exit at the TP and SL levels. STATISTICS : Accuracy 1 : This is the percentage of the times price hit
PipTick VSA MT4
Michal Jurnik
1 (2)
The   Volume Spread Analysis indicator   is based on the original Volume Spread Analysis method. It was designed for quick and easy recognition of VSA patterns. Even though this indicator looks very simple, it is the most sophisticated tool we've ever made. It is a really powerful analytical tool that generates very reliable trading signals. Because it is very user-friendly and understandable, it is suitable for every type of trader, regardless of his experience. What is VSA? VSA - Volume Spr
The Supply and Demand Zones indicator is one of the best tools we have ever made. This great tool automatically draws supply and demand zones, the best places for opening and closing positions. It has many advanced features such as multi timeframe zones support, displaying the width of zones, alert notifications for retouched zones, and much more. Because of market fractality, this indicator can be used for any kind of trading. Whether you are a positional, swing, or intraday trader does not ma
A technical indicator that calculates its readings on trading volumes. In the form of a histogram, it shows the accumulation of the strength of the movement of the trading instrument. It has independent calculation systems for bullish and bearish directions. Works on any trading instruments and time frames. Can complement any trading system. The indicator does not redraw its values, the signals appear on the current candle. It is easy to use and does not load the chart, does not require additi
The Th3Eng PipFinite indicator is based on a very excellent analysis of the right trend direction with perfect custom algorithms. It show the true direction and the best point to start trading. With StopLoss point and Three Take Profit points. Also it show the right pivot of the price and small points to order to replace the dynamic support and resistance channel, Which surrounds the price. And Finally it draws a very helpful Box on the left side on the chart includes (take profits and Stop loss
Daily FIBO Pro
Mark Thimoty Evangelista
BERG Daily FIBO Pro로 트레이딩 잠재력을 극대화하세요 BERG Daily FIBO Pro 는 MetaTrader 4 (MT4) 플랫폼을 위해 특별히 설계된 강력하고 커스터마이징 가능한 피보나치 되돌림 지표입니다. 숙련된 트레이더든, 초보자든 상관없이 이 지표는 중요한 지지 및 저항 레벨을 식별하고, 시장 분석을 강화하며, 트레이딩 전략을 최적화하는 데 필요한 필수 도구입니다. 왜 BERG Daily FIBO Pro를 선택해야 할까요?   정밀한 피보나치 분석:   전일의 고가와 저가를 기준으로 자동 계산된 피보나치 되돌림 레벨로 시장에서 우위를 점하세요.   BERG Daily FIBO Pro 는 0%, 23.6%, 38.2%, 50%, 61.8%, 78.6%, 100%의 레벨을 그려, 잠재적인 시장 전환점을 쉽게 식별할 수 있도록 도와줍니다.   지능형 알림 시스템:   가격이 피보나치 레벨에 도달하면 사용자 지정 알림으로 기회를 놓치지 않습니다. 시각적
Cosmic Diviner X Planet
Olena Kondratenko
4 (2)
This unique multi-currency strategy simultaneously determines the strength of trends and market entry points, visualizing this using histograms on the chart. The indicator is optimally adapted for trading on the timeframes М5, М15, М30, Н1. For the convenience of users, the indicator renders the entry point (in the form of an arrow), recommended take profit levels (TP1, TP2 with text labels) and the recommended Stop Loss level. The take profit levels (TP1, TP2) are automatically calculated for
Quantum Heiken Ashi PRO MT4
Bogdan Ion Puscasu
4.33 (6)
소개       Quantum Heiken Ashi PRO   차트 시장 동향에 대한 명확한 통찰력을 제공하도록 설계된 Heiken Ashi 양초는 노이즈를 필터링하고 잘못된 신호를 제거하는 기능으로 유명합니다. 혼란스러운 가격 변동에 작별을 고하고 더 매끄럽고 신뢰할 수 있는 차트 표현을 만나보세요. Quantum Heiken Ashi PRO를 정말 독특하게 만드는 것은 전통적인 촛대 데이터를 읽기 쉬운 색상 막대로 변환하는 혁신적인 공식입니다. 빨간색과 녹색 막대는 각각 약세와 강세 추세를 우아하게 강조하여 잠재적 진입점과 퇴장점을 매우 정확하게 파악할 수 있습니다. Quantum EA 채널:       여기를 클릭하세요 MT5 버전:       여기를 클릭하세요 이 놀라운 지표는 다음과 같은 몇 가지 주요 이점을 제공합니다. 선명도 향상: Heiken Ashi 바는 가격 변동을 완화하여 시장 추세를 보다 명확하게 나타내므로 유리한 거래 기회를 쉽게 식별할 수 있
Market Shaver
Remi Passanello
시장 면도기   마켓 스캘퍼 이 표시기는 RPTrade Pro 솔루션 시스템의 일부입니다. Market Scalper는 Price Action, Dynamic Support 및 Resistance를 사용하는 일일 추세 지표입니다. 누구나 사용할 수 있도록 설계되었으며 거래의 절대 초보자도 사용할 수 있습니다. 다시 칠하지 마십시오. 표시는 닫기에서 닫기로 제공됩니다. 단독으로 사용하도록 설계되어 다른 표시기가 필요하지 않습니다. 명확하고 간단한 표시를 제공합니다. 어떻게 작동합니까 Market Shaver는 Dual TimeFrames 시스템을 사용하고 있습니다. 주요 추세는 더 높은 TF가 취하는 반면 더 빠른 것은 거래를 마감하는 데 사용됩니다. 거래는 하나씩 표시되며 동시에 두 거래가 없습니다. Market Shaver는 다음을 나타냅니다. 거래를 할 때 그것을 멈출 때, 이익 또는 손실. 무역 보상 올바른 기말 TF를 설정하는 데 도움이 되는 많은 통계 시장
Gold Bricks FX USES THE TREND WAVE INDICATOR AND IT CAN IDENTIFY THE BEGINNING AND THE END OF A NEW WAVE TREND MOVEMENT. AS AN OSCILLATOR, THE INDICATOR IDENTIFIES THE OVERBOUGHT AND OVERSOLD ZONES. IT WORKS GREAT TO CATCH THE SHORT TERM PRICE REVERSALS AND USES A MARTINGALE STRATEGY TO CLOSE ALL TRADES IN PROFIT. USE DEFAULT SETTINGS ON H1 OR HIGHER TIME FRAME ON ANY PAIR FOR MORE ACCURATE TRADES WHY THIS EA : Smart entries calculated by 4 great strategies The EA can be run on even a
This is a new strategy for SUPPLY DEMAND areas It is based on a calculation using the tick volume to detect the big price action in market for both bear /bull actions this smart volume action candles are used to determine the supply and demand areas prices in between main supply and demand lines indicate sideway market  up arrows will be shown when prices moves above the main supply and the secondary supply lines Down arrows will be shown when prices moves below the main demand and the secondary
Forex Gump
Andrey Kozak
2.4 (5)
Forex Gump is a fully finished semi-automatic trading system. In the form of arrows, signals are displayed on the screen for opening and closing deals. All you need is to follow the instructions of the indicator. When the indicator shows a blue arrow, you need to open a buy order. When the indicator shows a red arrow, you need to open a sell order. Close orders when the indicator draws a yellow cross. In order to get the most effective result, we recommend using the timeframes H1, H4, D1. There
Mean Reversion Supply Demand Indicator Mean Reversion Supply Demand is the indicator to detect the important supply demand zone in your chart. The concept of supply demand trading relies on the quantity mismatching between buying and selling volumes in the financial market. Typically, supply demand zone serves to predict the turning point. The wave pattern, for any supply demand zone to work as an successful trade, looks like the price must touch the base zone, move away and then return to zone
Master scalping M1
Nataliia Marchuk
Master Scalping M1 is an innovative indicator that uses an algorithm to quickly and accurately determine the trend.The indicator calculates the time of opening and closing positions, the indicator's algorithms allow you to find the ideal moments to enter a deal (buy or sell an asset), which increase the success of transactions for most traders. Benefits of the indicator: Easy to assemble, does not overload the chart with unnecessary information. Can be used as a filter for any strategy. Works on
Owl smart levels
Sergey Ermolov
4.34 (35)
MT5 버전  |   FAQ Owl Smart Levels Indicator 는   Bill Williams 의 고급 프랙탈, 시장의 올바른 파동 구조를 구축하는 Valable ZigZag, 정확한 진입 수준을 표시하는 피보나치 수준과 같은 인기 있는 시장 분석 도구를 포함하는 하나의 지표 내에서 완전한 거래 시스템입니다. 시장과 이익을 취하는 장소로. 전략에 대한 자세한 설명 표시기 작업에 대한 지침 고문-거래 올빼미 도우미의 조수 개인 사용자 채팅 ->구입 후 나에게 쓰기,나는 개인 채팅에 당신을 추가하고 거기에 모든 보너스를 다운로드 할 수 있습니다 힘은 단순함에 있습니다! Owl Smart Levels   거래 시스템은 사용하기 매우 쉽기 때문에 전문가와 이제 막 시장을 연구하고 스스로 거래 전략을 선택하기 시작한 사람들 모두에게 적합합니다. 전략 및 지표에는 눈에 보이지 않는 비밀 공식 및 계산 방법이 없으며 모든 전략 지표는 공개되어 있습니다. Owl Smart Lev
Fibonacci retracement and extension line drawing tool Fibonacci retracement and extended line drawing tool for MT4 platform is suitable for traders who use  golden section trading Advantages: There is no extra line, no too long line, and it is easy to observe and find trading opportunities Trial version: https://www.mql5.com/zh/market/product/35884 Main functions: 1. Multiple groups of Fibonacci turns can be drawn directly, and the relationship between important turning points
Volume Profile Indicator for MT4 Gain a trading edge with the "Volume Profile" indicator for MetaTrader 4 (MT4). This advanced technical analysis tool allows you to precisely identify key support and resistance levels based on transaction volume. Easily visualize market areas of high interest, where trading volumes are highest, and use this information to make more informed trading decisions. Key Features: Clear and detailed visualization : The indicator displays volume histograms directly on th
VR Cub
Vladimir Pastushak
VR Cub 은 고품질 진입점을 얻는 지표입니다. 이 지표는 수학적 계산을 용이하게 하고 포지션 진입점 검색을 단순화하기 위해 개발되었습니다. 지표가 작성된 거래 전략은 수년 동안 그 효율성을 입증해 왔습니다. 거래 전략의 단순성은 초보 거래자라도 성공적으로 거래할 수 있다는 큰 장점입니다. VR Cub은 포지션 개시 지점과 이익 실현 및 손절매 목표 수준을 계산하여 효율성과 사용 편의성을 크게 높입니다. 간단한 거래 규칙을 이해하려면 아래 전략을 사용한 거래 스크린샷을 살펴보세요. 설정, 세트 파일, 데모 버전, 지침, 문제 해결 등은 다음에서 얻을 수 있습니다. [블로그] 다음에서 리뷰를 읽거나 작성할 수 있습니다. [링크] 버전 [MetaTrader 5] 진입점 계산 규칙 포지션 개설 진입점을 계산하려면 VR Cub 도구를 마지막 최고점에서 마지막 최저점까지 늘려야 합니다. 첫 번째 지점이 두 번째 지점보다 빠른 경우, 거래자는 막대가 중간선 위에서 마감될 때까지 기다립
PZ Penta O MT4
PZ TRADING SLU
The Penta-O is a 6-point retracement harmonacci pattern which usually precedes big market movements. Penta-O patterns can expand and repaint quite a bit. To make things easier this indicator implements a twist: it waits for a donchian breakout in the right direction before signaling the trade. The end result is an otherwise repainting indicator with a very reliable trading signal. The donchian breakout period is entered as an input. [ Installation Guide | Update Guide | Troubleshooting | FAQ | A
Supply and Demand Indicator + FREE Currency Strength Meter ADD-ON Looking for a powerful tool that can help you identify the most reactive zones in the forex market? Our supply and demand indicator for MetaTrader 4 and 5 is exactly what you need. With its advanced algorithms and real-time analysis, this indicator helps traders of all experience levels make informed trading decisions. The supply and demand indicator is a cutting-edge tool that helps traders identify areas where buyers and seller
This indicator allows to analyze a chart using the rule of supple and demand. You will see zones of sales and purchases and determine the most profitable points to open positions. The indicator is based on the principle of market fractality. Chart zones show places where a strong buyer or seller has made the price reverse and change its direction. The indicator has several types of zones calculation. Color and type of zones displaying are set as desired. The zone width can be displayed in pips.
Price Breakout pattern Scanner is the automatic scanner for traders and investors. It can detect following patterns automatically from your chart. Head and Shoulder - Common tradable pattern. Reverse Head and Shoulder - This pattern is the reverse formation of the Head and Shoulder. Double Top - When the price hits resistance level twice and decline toward the support level, the trader can anticipate sudden bearish breakout through the support level. Double Bottom - The double bottom pattern is
PipFinite Exit EDGE
Karlo Wilson Vendiola
4.83 (115)
Did You Have A Profitable Trade But Suddenly Reversed? In a solid strategy, exiting a trade is equally important as entering. Exit EDGE helps maximize your current trade profit and avoid turning winning trades to losers. Never Miss An Exit Signal Again Monitor all pairs and timeframes in just 1 chart www.mql5.com/en/blogs/post/726558 How To Trade You can close your open trades as soon as you receive a signal Close your Buy orders if you receive an Exit Buy Signal. Close your Sell orde
이 제품의 구매자들이 또한 구매함
Atomic Analyst
Issam Kassas
5 (2)
우선적으로 언급할 점은이 거래 지표가 다시 그리지 않고 지연되지 않으며 이를 통해 수동 및 로봇 거래 모두에 이상적이라는 점입니다. 사용자 매뉴얼: 설정, 입력 및 전략. Atomic Analyst는 가격의 강도와 모멘텀을 활용하여 시장에서 더 나은 이점을 찾는 PA Price Action Indicator입니다. 고급 필터를 장착하여 잡음과 거짓 신호를 제거하고 거래 잠재력을 높이는 데 도움이 됩니다. 복잡한 지표의 다중 레이어를 사용하여 Atomic Analyst는 차트를 스캔하고 복잡한 수학적 계산을 간단한 신호와 색상으로 변환하여 초보 트레이더가 이해하고 일관된 거래 결정을 내릴 수 있도록합니다. "Atomic Analyst"는 새로운 및 경험이 풍부한 트레이더를위한 종합적인 거래 솔루션입니다. 프리미엄 지표와 최고 수준의 기능을 하나의 거래 전략에 결합하여 모든 종류의 트레이더에 대한 다재다능한 선택지가되었습니다. 인트라데이 거래 및 스캘핑 전략 : 빠르고 정확한
Enigmera
Ivan Stefanov
5 (3)
에니메라: 시장의 핵심 https://www.enigmera.com 소개 이 지표 및 트레이딩 시스템은 금융 시장에 대한 놀라운 접근 방식입니다. 에니메라는 프랙탈 주기를 사용하여 지지선과 저항선을 정확하게 계산합니다. 진정한 축적 단계를 보여주고 방향과 목표를 제시합니다.  추세에 있든 조정에 있든 작동하는 시스템입니다.  어떻게 작동하나요? 에니메라는 지지선/저항선, 목표선, 편차선의 세 가지 라인으로 구성됩니다. 이 시스템은 과거 데이터를 현재와 미래로 추정하는 일반적인 시장 지표와 달리 현재에 대한 완전한 그림을 제공합니다. 지지선 위에 있으면 실제 지지를 의미하고 저항선 위에 있으면 실제 저항을 의미합니다. 레벨이 깨지면 추세의 변화를 나타냅니다. 다시 그리지 않습니다. 시장이 지속적으로 진화함에 따라 에니메라는 평가 도구를 조정하여 전략을 정기적으로 수정합니다.   이를 통해 모든 시나리오를 철저히 평가할 수 있습니다. 이 시장 지표의 고유성은 분명하며 그 기
현재 20% 할인 ! 초보자 또는 전문가 트레이더를 위한 최고의 솔루션! 이 대시보드 소프트웨어는 28개의 통화 쌍에서 작동합니다. 2가지 주요 지표(Advanced Currency Strength 28 및 Advanced Currency Impulse)를 기반으로 합니다. 전체 Forex 시장에 대한 훌륭한 개요를 제공합니다. 고급 통화 강도 값, 통화 이동 속도 및 모든(9) 시간대의 28 Forex 쌍에 대한 신호를 보여줍니다. 추세 및/또는 스캘핑 기회를 정확히 파악하기 위해 차트의 단일 지표를 사용하여 전체 시장을 볼 수 있을 때 거래가 어떻게 개선될지 상상해 보십시오! 잠재적인 거래를 식별하고 확인하면서 강력한 통화와 약한 통화를 더욱 쉽게 식별할 수 있도록 이 지표에 기능을 내장했습니다. 이 표시기는 통화의 강세 또는 약세가 증가 또는 감소하는지 여부와 모든 시간대에서 수행되는 방식을 그래픽으로 보여줍니다. 추가된 새로운 기능은 현재 시장 조건 변화에 적
Dynamic Forex28 Navigator - 차세대 외환 거래 도구. 현재 49% 할인. Dynamic Forex28 Navigator는 오랫동안 인기 있는 지표의 진화형으로, 세 가지의 힘을 하나로 결합했습니다. 고급 통화 Strength28 지표(695개 리뷰) + 고급 통화 IMPULSE with ALERT(520개 리뷰) + CS28 콤보 신호(보너스). 지표에 대한 자세한 정보 https://www.mql5.com/en/blogs/post/758844 차세대 Strength 지표는 무엇을 제공합니까?  원래 지표에서 좋아했던 모든 것이 새로운 기능과 더 높은 정확도로 강화되었습니다. 주요 기능: 독점적인 통화 Strength 공식.  모든 시간대에 걸쳐 부드럽고 정확한 강도선. 추세와 정확한 진입을 식별하는 데 이상적입니다. 역동적인 시장 피보나치 수준(시장 피보나치).  이 지표에만 있는 고유한 기능. 가격 차트가 아닌 통화 강도에 피보나치가 적용
TPSpro RFI Levels
Roman Podpora
4.82 (22)
지침         러시아   -        영어       표시기와 함께 사용하는 것이 좋습니다   .       -       TPSpro   트렌드 프로 -   MT4 버전         거래에서 핵심 요소는 거래 상품을 매수 또는 매도하기로 결정하는 구역 또는 수준입니다. 주요 업체가 시장에서 자신의 존재를 숨기려는 시도에도 불구하고, 그들은 필연적으로 흔적을 남깁니다. 우리의 과제는 이러한 흔적을 식별하고 올바르게 해석하는 방법을 배우는 것이었습니다. 주요 기능:: 판매자와 구매자를 위한 활성 영역을 표시합니다! 이 지표는 매수 및 매도를 위한 모든 올바른 초기 임펄스 레벨/존을 보여줍니다. 진입점 검색이 시작되는 이러한 레벨/존이 활성화되면 레벨의 색상이 바뀌고 특정 음영으로 채워집니다. 또한 상황을 보다 직관적으로 이해하기 위해 화살표가 나타납니다. 더 높은 시간대의 레벨/존 표시(MTF 모드) 더 높은 시간 간격을 사용하여 레벨/존을 표시하는 기능을 추가했습니다.
Gold Channel XAUUSD
Paulo Rocha
5 (2)
Gold Channel is a volatility-based indicator, developed with a specific timing algorithm for the XAUUSD pair, which consists of finding possible corrections in the market. This indicator shows two outer lines, an inner line (retracement line) and an arrow sign, where the theory of the channel is to help identify overbought and oversold conditions in the market. The market price will generally fall between the boundaries of the channel. If prices touch or move outside the channel it is a tra
Precautions for subscribing to indicator This indicator only supports the computer version of MT4 Does not support MT5, mobile phones, tablets The indicator only shows the day's entry arrow The previous history arrow will not be displayed (Live broadcast is for demonstration) The indicator is a trading aid Is not a EA automatic trading No copy trading function The indicator only indicates the entry position No exit (target profit)  The entry stop loss point is set at 30-50 PIPS Or the front
TrendMaestro
Stefano Frisetti
5 (3)
note: this indicator is for METATRADER4, if you want the version for METATRADER5 this is the link:  https://www.mql5.com/it/market/product/108106 TRENDMAESTRO ver 2.4 TRENDMAESTRO recognizes a new TREND in the bud, he never makes mistakes. The certainty of identifying a new TREND is priceless. DESCRIPTION TRENDMAESTRO identifies a new TREND in the bud, this indicator examines the volatility, volumes and momentum to identify the moment in which there is an explosion of one or more of these data a
NAM Order Blocks
NAM TECH GROUP, CORP.
5 (1)
MT4 Multi-timeframe Order Blocks detection indicator. Features - Fully customizable on chart control panel, provides complete interaction. - Hide and show control panel wherever you want. - Detect OBs on multiple timeframes. - Select OBs quantity to display. - Different OBs user interface. - Different filters on OBs. - OB proximity alert. - ADR High and Low lines. - Notification service (Screen alerts | Push notifications). Summary Order block is a market behavior that indicates order collection
Supply and Demand Dashboard PRO
Bernhard Schweigert
4.8 (20)
현재 20% 할인! 이 대시보드는 여러 기호와 최대 9개의 타임프레임에서 작동하는 매우 강력한 소프트웨어입니다. 주요 지표(최상의 리뷰: 고급 공급 수요)를 기반으로 합니다.   Advanced Supply Demand 대시보드는 훌륭한 개요를 제공합니다. 다음과 같이 표시됩니다.  영역 강도 등급을 포함하여 필터링된 공급 및 수요 값, 영역에 대한/및 영역 내 Pips 거리, 중첩된 영역을 강조 표시하고 모든 (9) 시간 프레임에서 선택한 기호에 대해 4가지 종류의 경고를 제공합니다. 그것은 당신의 개인적인 필요에 맞게 고도로 구성 가능합니다! 당신의 혜택! 모든 트레이더에게 가장 중요한 질문: 시장에 진입하기에 가장 좋은 수준은 무엇입니까? 최고의 성공 기회와 위험/보상을 얻으려면 강력한 공급/수요 영역 내 또는 그 근처에서 거래를 시작하십시오. 손절매를 위한 최적의 장소는 어디입니까? 가장 안전하려면 강력한 수요/공급 구역 아래/위에 정
Indicator : RealValueIndicator Description : RealValueIndicator is a powerful tool designed specifically for trading on the EURUSD pair. This indicator analyzes all EUR and USD pairs, calculates their real currency strength values, and displays them as a single realistic value to give you a head start on price. This indicator will tell you moves before they happen if you use it right. RealValueIndicator allows you to get a quick and accurate overview of the EURUSD currency pair tops and bottoms,
Gann Signal Scaner
Kirill Borovskii
This indicator is based on the Gann Signal indicator and acts as a market scanner. All you need to do is fill in the selected currency pairs in the settings and that’s it. Next, the indicator itself will view all these currency pairs and time frames from M5 to D1 simultaneously. When a new signal appears, the indicator will give you an Alert and also draw the letter N where this new signal will be.
Bomb Bank Signal
Igor Pereira Calil
5 (1)
폭탄 은행 신호: MetaTrader 4의 신뢰도 지표 Bomb Bank Signal은 금융 시장에서 가장 관련성이 높은 추세를 식별하도록 설계된 MetaTrader 4의 강력한 지표입니다. 움직임을 정확하게 예측하는 도구를 찾고 있다면 Bomb Bank가 바로 여러분에게 필요한 동맹입니다. 작동 방식: 이 지표는 거래량 분석, 양초 종가, 대칭 추세 등 세 가지 방법을 결합하여 매수 및 매도 기회를 감지하고 신호를 보냅니다. Bomb Bank는 매수 기회를 포착할 때는 '폭탄'과 같고, 매도 신호를 감지할 때에는 '해골'과 같습니다. 폭탄 은행은 왜 다른가요? 완전한 신뢰성: 폭탄 은행 신호는 신호를 제거하지 않습니다. 일단 신호가 발행되면 그 신호는 계속 유지되므로 기회를 절대 놓치지 않습니다. 극도의 정확성: Bomb Bank는 잘못된 신호를 보내지 않습니다. 시장이 발전함에 따라 조정하면서 실시간으로 업데이트하지만 이전 신호의 투명성은 유지합니다. 실시간
ON Trade Optuma Astro
Abdullah Alrai
5 (4)
물론입니다. 아래는 제공해주신 텍스트의 한국어 번역입니다: MT4용 천문학 지표 소개: 귀하의 최상급 하늘 트레이딩 동반자 트레이딩 경험을 천체의 높이로 끌어올리기 준비가 되셨나요? MT4용 천문학 지표를 소개합니다. 이 혁신적인 도구는 복잡한 알고리즘의 힘을 활용하여 탁월한 천문학적 통찰과 정밀한 계산을 제공합니다. 정보의 우주를 손에 담다: 천문학적 데이터의 보물함을 드러내는 포괄적인 패널을 살펴보세요. 행성의 지오/헬리오센트릭 좌표, 태양/지구 거리, 크기, 길이, 별자리, 황도 좌표 및 적도 좌표, 심지어 수평 좌표 등 각각이 정밀하게 계산되고 아름답게 제시됩니다. 지표에 의해 생성된 수직선은 시간 값에 해당하여 트레이딩 여정에 우주적인 시각을 부여합니다. 행성 라인과 관계: 수정 가능한 스케일과 각도로 차트를 장식하는 행성 라인의 마법을 경험해보세요. 직관적인 컨트롤 패널을 통해 각 행성의 라인의 가시성을 손쉽게 전환할 수 있습니다. 쥰션이나 섹스타일, 사분각, 삼분각, 트
Apollo Pips PLUS SP
Oleg Rodin
5 (4)
제품을 구매하기 전에 아래 정보를 읽어보세요! Apollo Pips PLUS SP는 독특한 제품입니다! 모든 거래 지표에 액세스할 수 있는 새로운 "APOLLO PIPS" 지표와 "슈퍼 팩" 보너스를 받고 싶은 분들을 위한 것입니다! Apollo Pips PLUS SP 제품을 구매하면 실제로 Apollo Pips 표시기의 완전히 새로운 버전을 구매하게 됩니다. 이 버전의 지표에는 개선된 알고리즘과 사용하기 쉬운 매개변수가 있어 모든 시장 및 거래 스타일에서 지표를 사용할 수 있는 기회를 제공합니다. 이 제품의 구매자는 슈퍼 보너스로 다른 모든 표시기에 무료로 액세스할 수 있습니다! 내 모든 거래 도구에 액세스하고 싶었다면 이 제품이 당신에게 딱 맞습니다! :) 하지만 이것이 전부는 아닙니다! :) 이 제품의 모든 구매자는 또한 내 새로운 지표를 무료로 받을 자격이 있습니다! :) 새로운 거래 지표를 사용할 수 있게 되었는데, 귀하는 저의 특별한 "SUPER PACK" 평생 보너스
ON Trade Waves Patterns Harmonic Elliot Wolfe를 소개합니다. 이는 수동 및 자동 방법을 사용하여 다양한 시장 패턴을 감지하기 위해 개발된 고급 지표입니다. 다음은 그 작동 방식입니다: 조화적 패턴: 이 지표는 차트에 나타나는 조화적 패턴을 식별할 수 있습니다. 이러한 패턴은 Scott Carney의 "Harmonic Trading vol 1 및 2"에서 설명한 것처럼 조화적 거래 이론을 연습하는 트레이더에게 중요합니다. 수동으로 그리든 자동 감지를 사용하든 ON Trade Waves Patterns가 도움을 줄 것입니다. 컨트롤 패널: 이 지표에는 사용자 친화적인 컨트롤 패널이 있습니다. 차트 및 시간 프레임 설정을 저장하여 다양한 구성 간에 쉽게 전환할 수 있습니다. 차트 공간을 최대화하려면 최소화할 수도 있습니다. 다른 분석 도구를 사용하는 것을 선호하는 경우 닫기 버튼을 클릭하여 모든 지표 데이터를 숨길 수 있습니다. 템플릿 저장: 설정을 사
RelicusRoad Pro
Relicus LLC
4.64 (103)
이제 $ 147 (몇 가지 업데이트 후 $ 499 증가) - 무제한 계정 (PCS 또는 MACS) RelicusRoad 사용 설명서 + 교육 비디오 + 비공개 Discord 그룹 액세스 + VIP 상태 시장을 보는 새로운 방법 RelicusRoad는 외환, 선물, 암호화폐, 주식 및 지수에 대한 세계에서 가장 강력한 거래 지표로서 거래자에게 수익성을 유지하는 데 필요한 모든 정보와 도구를 제공합니다. 우리는 초보자부터 고급까지 모든 거래자가 성공할 수 있도록 기술적 분석 및 거래 계획을 제공합니다. 미래 시장을 예측할 수 있는 충분한 정보를 제공하는 핵심 거래 지표입니다. 우리는 차트에서 말이 안 되는 여러 지표 대신 완전한 솔루션을 믿습니다. 타의 추종을 불허하는 매우 정확한 신호, 화살표 + 가격 조치 정보를 표시하는 올인원 표시기입니다. 강력한 AI를 기반으로 하는 RelicusRoad는 누락된 정보와 도구를 제공하여 교육하고 성공적인 트레이더인 트레이딩 전문
Dragon Multi Indicator MT4
Mansour Babasafary
5 (4)
3 Indicators in 1 indicator Strategy based on price action Made specifically for the best forex currency pairs Can be used in the best time frame of the market at a very reasonable price This indicator is basically 3 different indicatos . But we have combined these 3 indicators in 1 indicator so that you can use 3 indicators at the lowest price. All three strategies are based on price action. But based on different trends. Long term, medium term and short term Attributes : No repaintin
Quantum Trend Monitor Indicator
QUANTUM TRADING SOFTWARE LIMITED
Currency pairs never go up or down in a straight line. They rise and fall constantly, creating pullbacks and reversals. And with each rise and fall, so your emotions rise and fall. Hope, then fear, then hope. This is when the market will try to frighten you out of a strong position. It is when you are most vulnerable. But not if you have the Quantum Trend Monitor. And here, you even get two indicators for the price of one! The Quantum Trend Monitor has been designed to absorb these temporary pau
Quantum Volume Point of Control Indicator
QUANTUM TRADING SOFTWARE LIMITED
5 (1)
The Quantum VPOC indicator has been developed to expand the two dimensional study of volume and price, to a three dimensional one which embraces time. The volume/price/time relationship then provides real insight to the inner workings of the market and the heartbeat of sentiment and risk which drives the price action accordingly. The Quantum VPOC indicator displays several key pieces of information on the chart as follows: Volume Profile - this appears as a histogram of volume on the vertical pr
AT Forex Indicator MT4
Marzena Maria Szmit
5 (3)
The AT Forex Indicator MT4 is a sophisticated trading tool designed to provide traders with a comprehensive analysis of multiple currency pairs. This   powerful indicator   simplifies the complex nature of the forex market, making it accessible for both novice and experienced traders. AT Forex Indicator uses   advanced algorithms   to detect trends, patterns and is an essential tool for traders aiming to enhance their forex trading performance. With its robust features, ease of use, and reliabl
Volatility Trend System - a trading system that gives signals for entries. The volatility system gives linear and point signals in the direction of the trend, as well as signals to exit it, without redrawing and delays. The trend indicator monitors the direction of the medium-term trend, shows the direction and its change. The signal indicator is based on changes in volatility and shows market entries. The indicator is equipped with several types of alerts. Can be applied to various trading
우선적으로 이 거래 시스템은 다시 그리지 않고, 다시 그리지 않으며, 지연되지 않는 것을 강조할 가치가 있습니다. 이는 전문적인 거래에 이상적입니다. 온라인 강좌, 사용자 매뉴얼 및 데모. "스마트 서포트 앤 레지스턴스 트레이딩 시스템"은 새로운 및 경험 많은 트레이더를 위해 개발된 고급 지표입니다. 이 시스템은 외환 시장에서 정밀도와 신뢰감을 제공합니다. 이 포괄적인 시스템은 일일 거래 전략, 스윙 거래 전략, 지원 및 저항 전략, 캔들스틱 패턴 전략, VWAP 전략, 다중 시간대 추세 전략 등을 포함한 7개 이상의 전략, 10개의 지표 및 다양한 거래 방식을 결합합니다. 이 시스템은 화살표 신호, 진입 및 출구 지점, 거래 경보, 높은 시간대 추세 분석, 실시간 거래 모니터링 및 트렌드 및 볼륨 캔들 색상 제공합니다. 자동 지원 및 저항 감지로 다양한 시장 상황에서 신중한 결정을 돕는 다면적 인 지표입니다. 스마트 서포트 앤 레지스턴스 트레이딩 시스템은 프리미엄 및 강력한
ECM Elite Channel is a volatility-based indicator, developed with a specific time algorithm, which consists of finding possible corrections in the market. This indicator shows two outer lines, an inner line (retracement line) and an arrow sign, where the channel theory is to help identify overbought and oversold conditions in the market. The market price will generally fall between the boundaries of the channel. If prices touch or move outside the channel, it's a trading opportunity. The
An arrow indicator showing price reversals and following the trend. The indicator determines price reversals on the chart and is suitable for scalping on TF 1M-5M and day trading on TF 1H and 4H. Buy and sell arrows are displayed on the chart as entry signals. Diamonds are displayed behind the arrows as a continuation of the signal. They are not repainted and are formed after the candle closes. Red arrows are buy signals. Orange arrows are sell signals. The indicator also contains green pre
Theq HAG
Luis Alberto Vazquez Carpio
5 (6)
THEQ HAG Indicator. - THEQ HAG Indicator has p rofit maximization and loss minimization math algorithm displaying signals . Full description in video and screenshots. - Trading with the Trend with Signals  and Take Profit Alert signals. - This Indicator never recalculates, Repaints, back Repaints, or Delays after bar is closed. - All Timeframes and Currency Pairs.
Pair Trading Station MT4
Young Ho Seo
3.67 (3)
How to use Pair Trading Station Pair Trading Station is recommended for H1 time frame and you can use it for any currency pairs. To generate buy and sell signal, follow few steps below to apply Pair Trading Station to your MetaTrader terminal. When you load Pair Trading Station on your chart, Pair Trading station will assess available historical data in your MetaTrader platforms for each currency pair. On your chart, the amount of historical data available will be displayed for each currency pai
The indicator " ZigZag on Trend " is an assistant in determining the direction of price movement, as well as a calculator of bars and points. It consists of a trend indicator, which follows the price direction by the trend line presented in the form of a zigzag and a counter calculating the number of bars traversed in the direction of the trend and the number of points on the vertical scale. (calculations are carried out by the opening of the bar) The indicator does not redraw. For convenience,
Channel Cluster
Vitalyi Belyh
5 (1)
Cluster indicator working in the price channel. For operation, the indicator builds a channel line - (dashed line). Inside the channel, cluster sections are determined that determine the direction of the price movement - (histograms in two directions), start with large arrows. Small arrows are plotted above / below each histogram - indicator increase volatility. The indicator does not redraw the values. Works on any tools and timeframes. Entrances are made when large arrows appear, inside s
Market Swing Index MSI
Elias Mtwenge
5 (1)
Septermber OFFER 85% OFF next price for unlimited version will be 2500$. This is the only time you can get this institutional and professional indicator at this price for unlimited version. Don't dare to miss this. The tool I am about to introduce to you you can't compare it with other tools due to its strategy and accuracy level in predicting the next price directional movement. This tool is designed for serious traders who have decided to make a difference through trading. Be the next person t
제작자의 제품 더 보기
Ultimate Gold Advisor for MetaTrader 4 – 성공을 보장하는 최첨단 거래 도구! Ultimate Gold Advisor는 단순한 지표 그 이상입니다. MetaTrader 4에서 거래 접근 방식을 혁신적으로 변화시킬 기술의 보석입니다. 가장 까다로운 트레이더의 요구를 충족하도록 설계된 이 최첨단 지표는 외과적 정밀성, 정교한 분석, 강력한 기능을 결합하여 시장에서 무적의 경쟁 우위를 제공합니다. 금 거래에 최적화되어 있지만 다양한 자산에 활용할 수 있는 Ultimate Gold Advisor는 귀하의 진정한 수익 잠재력을 열 수 있는 열쇠입니다. Ultimate Gold Advisor가 모든 트레이더에게 필수적인 이유는 무엇인가요? 탁월한 성능: 최대 89%에 이르는 놀라운 성공률을 자랑하는 이 지표는 단순히 신뢰할 수 있을 뿐만 아니라 매우 효과적입니다. 모든 승리 및 패배 거래가 차트에 명확하게 표시되어 귀하의 전략의 진정한 잠재력을 실시간으로 확인할
Follow Line 지표는 시장 트렌드를 정확하게 식별하고 따라가는 트레이더에게 필수적인 도구입니다. 이 지표는 가격 변동에 따라 동적으로 조정되며, 가격 움직임을 매끄럽고 지속적으로 추적하는 선을 그립니다. 시각적으로 단순하고 트렌드 변화를 신호하는 데 효과적인 Follow Line은 모든 트레이더의 전략에 훌륭한 추가 요소가 됩니다. 주요 특징: 트렌드 추적: Follow Line은 가격을 면밀히 추적하여 트레이더가 진행 중인 시장 트렌드를 쉽게 식별할 수 있도록 합니다. 시각적 단순성: 명확하고 잘 정의된 선으로, 경험이 적은 트레이더도 시장 방향을 빠르게 이해할 수 있습니다. 적응성: 다양한 시간대와 도구에서 작동하여, 데이 트레이딩에서 스윙 트레이딩까지 다양한 거래 전략에 이상적입니다. 사용 방법: 설치: 분석하려는 금융 상품의 차트에 Follow Line 지표를 추가합니다. 설정: 거래 전략에 맞게 지표의 매개변수를 조정합니다. 트렌드 분석: Follow Line 선을
MetaTrader 5 무료 스프레드 지표 이 지표는 MetaTrader 5에서 스프레드에 대한 자세한 분석을 제공합니다. 스프레드는 자산의 매수 가격(Ask)과 매도 가격(Bid) 간의 차이를 나타내므로, 트레이더에게 중요한 매개변수 중 하나입니다. 지표에는 다음이 포함됩니다: 평균 스프레드 : 당일 관찰된 최고 스프레드와 최저 스프레드 간의 평균으로 계산됩니다. 현재 스프레드 : 현재 시장 스프레드를 표시합니다. 최저 스프레드 : 당일 기록된 최저 스프레드 값을 보여줍니다. 최대 스프레드 : 당일 기록된 최대 스프레드 값을 보여줍니다. 이 지표는 시장 상황에 대한 명확하고 즉각적인 뷰를 제공하도록 설계되었으며, 트레이더가 거래 비용을 보다 잘 평가하고 전략에 영향을 미칠 수 있는 스프레드 변동을 식별할 수 있도록 도와줍니다. 제 제품에 관심이 있으시면 다음 페이지를 방문해 보세요: 전문가 자문 : https://www.mql5.com/it/market/product/119456?
FREE
FREE Spread indicator for MetaTrader 4 this indicator includes: -average spread -current spread -minimum spread -maximum spread If you are interested in my products I recommend you visit my page where you can find: Experts Advisors:  https://www.mql5.com/it/market/product/119456?source=Site+Profile indicators:  https://www.mql5.com/it/market/product/120038?source=Site+Profile I hope the spread indicator will be useful to you. https://www.mql5.com/it/users/kappa05
FREE
Enhance Your Trading Strategies with the "Order Block" Indicator for MT4 Discover the "Order Block" Indicator: The "Order Block" Indicator for MT4 is designed to help you precisely identify order blocks in the market by marking the highs and lows of the order block candles. This powerful tool enables you to understand where large institutions place their orders, improving your ability to predict market movements. Key Features: Precise Order Block Detection: Automatically highlights the highs and
IMPORTANT: The indicator will remain at the price of $34.90 until the release of the update scheduled for July 16, 2024. The New Price will be $49.90 (taxes excluded) FVG indicator. If you are an SMC trader this indicator will be very useful to you, it automatically identifies the FVGs on the graph distinguishing them into 2 types: bearish FVGs and bullish FVGs (see the photos to understand better). This indicator works on any Timeframe and on any market you want to use it. If you are interested
Volume Profile Indicator for MT4 Gain a trading edge with the "Volume Profile" indicator for MetaTrader 4 (MT4). This advanced technical analysis tool allows you to precisely identify key support and resistance levels based on transaction volume. Easily visualize market areas of high interest, where trading volumes are highest, and use this information to make more informed trading decisions. Key Features: Clear and detailed visualization : The indicator displays volume histograms directly on th
Presentation of the "Color Range Indicator" The "Color Range Indicator" is a powerful technical analysis tool designed for the MT4 platform, perfect for traders who want a clear and immediate view of market trends. This indicator draws a colored line based on the current trend, making it easier to interpret price movements. Indicator Description: Green line : Indicates an uptrend. Use this signal to consider buying opportunities. Red line : Indicates a downtrend. Use this signal to consider sell
"Real Time MultiIndicator"란 무엇인가요? "Real Time MultiIndicator"는 기술 분석을 단순화하고 최적화하기 위해 설계된 고급 거래 도구입니다. 이 혁신적인 지표는 여러 시간 프레임과 기술 지표에서 신호를 수집하여 하나의 명확하고 읽기 쉬운 표로 표시합니다. 차트를 계속 변경하거나 각 지표를 수동으로 분석하지 않고도 시장에 대한 전체적이고 상세한 통찰을 원하신다면, "Real Time MultiIndicator"가 최적의 솔루션입니다. 왜 "Real Time MultiIndicator"를 선택해야 하나요? 다중 시간 프레임 분석: "Real Time MultiIndicator"는 다양한 시간 프레임에서 시장을 동시에 모니터링할 수 있게 해줍니다. M15에서 H4까지, 이 지표는 각 시간 프레임에서 추세가 상승 중인지 하락 중인지를 명확하게 보여주어 시장의 전체적인 모습을 바탕으로 정보를 기반으로 한 결정을 내릴 수 있도록 도와줍니다. 다양한 지표
9월 1일 일요일까지 77.90달러에서 37.90달러로 할인 "Forex Scanner"란 무엇입니까? "Forex Scanner"는 실시간으로 외환 시장에 대한 포괄적인 개요를 제공하도록 설계된 강력한 거래 도구입니다. 이 고급 지표는 여러 기술 지표와 시간 프레임에서 주요 데이터를 수집하여 거래 기회를 신속하게 식별할 수 있게 해줍니다. 여러 자산과 매개변수를 모니터링하면서 차트를 변경하지 않고자 한다면 "Forex Scanner"는 완벽한 솔루션입니다. "Forex Scanner"를 선택해야 하는 이유는 무엇입니까? 다중 시간대 스캔: "Forex Scanner"는 분 단위에서 시간 단위까지 다양한 시간대에서 시장을 모니터링할 수 있게 해줍니다. 이 도구는 여러 시간 레벨에서 추세 및 거래 신호를 즉시 식별할 수 있도록 도와주며, 완전하고 상세한 시장 뷰에 따라 조치를 취할 수 있게 해줍니다. 다중 지표 통합: 이 지표는 ATR, RSI, 스토캐스틱, ADX, 피벗 및 MA와
Enhanced RSI는 트레이더에게 더 포괄적이고 정확한 시장 분석을 제공하기 위해 설계된 다재다능하고 맞춤화 가능한 기술 지표입니다. 이동 평균, RSI 및 MACD의 최고의 기능을 결합하여 이 지표는 모멘텀과 트렌드 강도에 대한 다차원적 관점을 제공합니다. 주요 특징: 완벽한 하이브리드화: Enhanced RSI는 이동 평균, RSI 및 MACD의 기능을 결합하여 가격 움직임에 대한 보다 완전한 그림을 제공합니다. 최대 유연성: 맞춤화 가능한 기간을 통해 이 지표는 모든 거래 스타일과 시간 프레임에 적응합니다. 다양한 활용: Forex부터 암호화폐, 주식, 지수에 이르기까지 모든 금융 자산에 대해 작동합니다. 분석 지원: Enhanced RSI는 자동 거래 시스템이 아니라 유용한 신호와 확인을 제공하여 기술 분석을 보완하는 도구입니다. 작동 방식: Enhanced RSI는 RSI의 지수 이동 평균을 계산하고 이를 MACD에서 나온 신호와 결합합니다. 그 결과는 과매수 및 과매도
MetaTrader 5용 Dynamic Cycle Indicator – 사이클 트레이딩에서의 당신의 이점! Dynamic Cycle Indicator 는 MetaTrader 5 에서 시장 주기를 정확하게 식별하고 거래 전략을 최적화할 수 있는 궁극적인 도구입니다. 고급 주기 분석 알고리즘을 기반으로, 이 지표는 전환점을 감지하고 향후 가격 움직임을 예측하는 데 있어 전례 없는 이점을 제공합니다. Dynamic Cycle Indicator가 독특한 이유는 무엇입니까? 완벽한 주기 식별 : 시장의 변동을 정밀하게 분석하여, 지표는 주기를 자동으로 감지하고 차트에 명확한 기호로 전환점을 표시합니다. 이러한 포인트는 최적의 진입 및 종료 시점을 식별하는 데 필수적입니다. 즉각적인 시각적 신호 : 차트의 빨간색 및 파란색 화살표는 피크 및 저점 신호를 명확하게 보여줍니다. 이러한 시각적 지표는 방향 변화에 대한 예측을 보다 자신 있게 할 수 있게 하여 타이밍 정확도를 높입니다. 해석의 용이성
OB Indicator
Nicola Capatti
Order Block indicator, highs and lows; the indicator focuses mainly on OBs, on the chart they are represented with a horizontal line on the minimum and maximum of that candle. While for the maximums and minimums only one line is marked (see the images to understand better). The indicator is for MT5, it works on all Timeframes, on any Forex Pair, on any index and on crypto markets. (For any information on the indicator do not hesitate to contact me). Limited time discount (50%) 74.90$ -> 38.60$
Expert Advisor for scalping; This EA was built for monthly profitability. Works on any asset: Forex, Indices, Crypto and Stocks. Perfectly usable in MT5 tester and usable on any TimeFrame. The EA has various inputs available to customize operations: -Lots -Risk% (0 = Fix) -OrderDist (the distance between one order and another, the distance is calculated in points not pips) -TP (in points) -Sl (in points) -TrailingStopTrigger(the trailing stop trigger point in points) -TrailingStop(distance from
Highs, Lows and Bos Indicator for MT5; The indicator works on any type of market and on all TimeFrames. It also works on the MetaTrader5 Tester. the main function of the indicator is to identify the highs and lows by marking them with a point above/below the candle, then with a horizontal line it marks the Bos. It is very simple and intuitive, there are only 2 inputs: -the color of the maximums -the color of the minima For any other information do not hesitate to contact me.
Panel Info Trade For MT5; The indicator has 2 main objects: -An icon chart that you can change Timeframe, zoom, Forex Pair, crypto....the position of the graph can be modified via the (x;y) inputs. The chart is perfectly usable in the MT5 tester. If the graph isn't for you and doesn't help you with anything, you can press the button on the top right to make it smaller. -the second object is a dynamic control panel where you can change plots, place sl and tp, BE, close partial... (if you watch th
통화 강도 지수 (Currency Strength Index - CSI) 지표 지표를 활성화하기 전에 "TRUE"로 설정하여 페어를 표시하도록 하십시오 통화 강도 지수 (Currency Strength Index - CSI) 지표는 주요 통화의 상대 강도를 측정하는 데 사용되는 강력한 도구입니다. 이 지표는 거래자가 특정 시점에서 가장 강한 통화와 가장 약한 통화를 식별하는 데 도움을 주어 더 정보에 기반한 거래 결정을 내릴 수 있게 합니다. 주요 특징: 비교 분석: 역사적 및 현재 데이터를 기반으로 다양한 통화의 강도를 비교합니다. 거래 신호: 상대적인 강도를 기준으로 최적의 통화 쌍을 식별하는 데 도움이 됩니다. 사용자 정의: 사용자는 계산 기간 및 기타 매개변수를 구성하여 자신의 거래 전략에 맞출 수 있습니다. 직관적인 시각화: 정보를 명확하고 시각적으로 제시하여 데이터 해석을 용이하게 합니다. 사용 방법: 설치: 원하는 통화 쌍의 차트에 CSI 지표를 추가하십시오. 설정: 계
In the world of trading, the key to success lies in having the right tools at the right time. Our innovative Volume Profile indicator was developed with one goal in mind: to provide traders with unprecedented access to vital market activity information. This cutting-edge tool allows you to not only see where and when volumes are traded but also to understand market depth with clarity never seen before. Main Features: Temporal Flexibility: Set the analysis range up to 1800 minutes to perfectly ma
Maximize Your Trading Opportunities with the "Auto Trendlines" Indicator Discover the "Auto Trendlines" Indicator: "Auto Trendlines" is the essential tool for every technical trader. This indicator automatically plots trend lines, pinpointing support and resistance levels with surgical precision. It's ideal for those looking to capitalize on market breakouts and reversals. Key Features: Automatic Trendline Plotting: Identifies and draws crucial trend lines without manual intervention. Advanced C
AutoFibo for MT5
Nicola Capatti
Optimize Your Trading Decisions with the "autoFibo" Indicator Discover the "autoFibo" Indicator: "autoFibo" is the essential analysis tool for traders who want to fully leverage Fibonacci levels without the hassle of manual plotting. This indicator automates the Fibonacci retracement process, providing instant visual access to key support and resistance zones. Key Features: Automatic Fibonacci Retracement: Automatically plots Fibonacci levels, making it easy to identify support and resistance zo
Enhance Your Trading Performance with the "Better Volume" Indicator Discover the "Better Volume" Indicator: The "Better Volume" is the essential market volume analysis tool for traders aiming to stand out. It analyzes tick volumes with unprecedented accuracy, featuring an advanced moving average function (PERIOD_MA) and customizable buy and sell alerts. Key Features: Advanced Volume Analysis: Recognize volume peaks signaling crucial price movements. Intuitive Buy and Sell Alerts: Stay one step a
SuperTrend 는 트렌드 방향을 식별하고 진입 및 종료 신호를 생성하기 위해 거래에서 가장 효과적이고 널리 사용되는 기술 지표 중 하나입니다. 변동성과 트렌드를 기반으로 하는 이 지표는 시장 상황에 동적으로 적응하여 트레이더에게 명확한 시각적 참고 자료를 제공합니다. 주요 특징: 트렌드 탐지: SuperTrend는 시장 트렌드를 따라가며 하락 트렌드에서는 가격 위에, 상승 트렌드에서는 가격 아래에 선을 그립니다. 사용 용이성: 직관적인 그래픽 표현 덕분에 경험이 적은 트레이더도 쉽게 해석할 수 있습니다. 진입/종료 신호: 가격이 SuperTrend 라인을 위로 교차할 때 매수 신호를 생성하고 아래로 교차할 때 매도 신호를 생성합니다. 적응성: 다양한 시간 프레임과 도구에서 작동하여 일간 거래부터 스윙 거래에 이르기까지 다양한 거래 스타일에 맞게 다재다능합니다. 사용 방법: 설치: 분석하려는 금융 상품의 차트에 SuperTrend를 추가합니다. 설정: 거래 전략에 맞게 주기 및
새로운 통합 지표 - 3 in 1 시장 분석과 투자 전략을 향상시킬 거래 도구를 찾고 계십니까? 저희는 최고의 지표 세 가지를 강력하고 편리한 하나의 솔루션으로 결합하여, 거래에서 최고의 가치를 얻을 수 있도록 했습니다. 1. 오더 블록 지표 (이전에 32.90$에 판매됨) 오더 블록 지표는 시장에서 중요한 기관의 관심 영역을 식별하는 데 필수적인 도구입니다. 이 지표는 오더 블록 캔들의 고점과 저점을 표시하며, 이는 가격 반전이나 추세 지속이 발생할 수 있는 중요한 영역을 나타냅니다. 단독으로 사용될 때, 오더 블록 지표는 잠재적인 지지 및 저항 영역을 식별하여 더 나은 거래 결정을 내릴 수 있도록 도와줍니다. 링크: https://www.mql5.com/it/market/product/121633?source=Site+Market+MT5+Search+Rating006%3aorderblock+indicator 2. FVG 지표 (이전에 34.90$에 판매됨) FVG 지표는 공정 가
FVG for MT5
Nicola Capatti
"Fair Value Gap" (FVG) 인디케이터 - 시장 불균형의 힘을 발견하세요 트레이딩 세계는 숨겨진 기회로 가득 차 있지만, 적절한 도구를 가진 사람만이 이를 효과적으로 식별하고 활용할 수 있습니다. 우리의 FVG 인디케이터 는 이를 돕기 위해 설계되었습니다. 시장을 읽는 능력을 향상시키고 최적의 진입 및 퇴출 포인트를 찾고자 하는 트레이더에게 FVG 인디케이터는 완벽한 동반자입니다. Fair Value Gap (FVG)이란 무엇인가요? Fair Value Gap의 개념은 가격 차트에 "갭"을 생성하는 공급과 수요 사이의 불균형을 나타냅니다. 이 갭은 가격이 이 불균형을 채우기 위해 다시 돌아올 수 있는 영역을 나타내며, 이 영역은 잠재적으로 가치 있는 트레이딩 기회입니다. 이러한 갭은 가격이 급격히 움직일 때 발생하며, 향후 시장 행동을 이해하는 열쇠가 될 수 있습니다. 왜 FVG 인디케이터가 중요한가요? FVG 인디케이터는 차트에서 이 불균형 영역을 쉽게 식별하고 가격이
"Schaff RSX"란 무엇입니까? "Schaff RSX"는 상대 강도 지수(RSX)의 효율성을 Schaff 사이클의 정밀성과 결합하여 시장에 진입하고 퇴출할 최고의 순간을 쉽게 식별할 수 있는 독특한 지표를 만듭니다. 이는 숨겨진 거래 기회를 감지하는 레이더를 보유하는 것과 같으며, 다른 트레이더가 무시할 수 없는 경쟁 우위를 제공합니다. 왜 "Schaff RSX"를 선택해야 합니까? 명확하고 직관적인 시각적 단순성 : "Schaff RSX"의 색상과 라인은 시장이 과매수 또는 과매도 상태에 있을 때를 명확하게 보여줍니다. 더 이상 직관이나 운에 의존할 필요가 없습니다. 정확하고 신뢰할 수 있는 정보가 바로 앞에 있습니다. 완벽하게 사용자 정의 가능 : 각 트레이더는 자신의 전략을 가지고 있으며, "Schaff RSX"는 귀하의 전략에 완벽하게 적응합니다. 원하는 결과를 정확하게 얻기 위해 매개변수를 원하는 대로 구성할 수 있습니다. 모든 거래 스타일에 적합 : 귀하가 데이 트레
MetaTrader 5용 **"Positions Manager"**는 포지션 관리를 효율적이고 자동화된 방식으로 최적화하려는 트레이더에게 필수적인 도구입니다. 이 고급 도구는 트레이더가 자신의 작업을 제어하고 위험 관리를 개선하며 Break Even 및 Trailing Stop과 같은 기능을 통해 잠재적인 수익을 극대화할 수 있도록 설계되었습니다. 주요 기능: 자동 Break Even: Break Even을 활성화하는 옵션을 통해 "Positions Manager"는 시장이 트레이더에게 유리하게 움직일 때 이익을 보호할 수 있습니다. 활성화를 위한 핍(pip) 거리를 설정하고 수수료를 충당하기 위한 추가 핍을 추가할 수 있습니다. 동적 Trailing Stop: Trailing Stop을 활성화하여 시장 움직임을 추적하고 수익을 보호하십시오. 이 기능은 가격 움직임에 따라 자동으로 조정되어 시장이 유리한 한 포지션을 유지하고 트렌드가 반전될 때 자동으로 포지션을 종료할 수 있습니다.
Smart Fractals Indicator - MT5 거래를 위한 강화된 프랙탈 Smart Fractals는 당신이 알고 있는 클래식 프랙탈 지표의 진화입니다. MetaTrader 5를 위해 특별히 설계된 이 지표는 단순히 시장의 전통적인 반전 지점을 식별하는 것에 그치지 않고, 더 나아가 거래를 보다 효율적이고 수익성 있게 만들어 줍니다. 우리는 프랙탈의 기본 개념을 바탕으로 더 똑똑하고 기능적인 도구로 변환시켰습니다. 주요 특징: 매수 및 매도 신호: 전통적인 프랙탈이 시장의 전환점을 나타내는 것 외에도, Smart Fractals는 노란색과 보라색 화살표로 차트에 직접 표시되는 매수 및 매도 신호를 포함합니다. 이러한 신호는 보다 자신감을 가지고 포지션에 진입할 수 있게 해줍니다. 개선된 시각화: 각 프랙탈은 명확하고 직관적으로 표시되며, 사용자가 설정할 수 있는 색상을 통해 '상승' 및 '하락' 프랙탈을 구분할 수 있습니다. 또한 시장 구조의 붕괴를 나타내는 구조적 돌파 (
필터:
리뷰 없음
리뷰 답변