Relative Gap Index RGI
- 지표
- Avydel Talbo Doctolero
- 버전: 1.6
- 활성화: 5
The Relative Gap Index (RGI) is a powerful new tool designed for traders looking to identify market momentum and potential trend reversals with ease. Developed by Avydel Talbo, the RGI offers a fresh perspective on price action, making it an essential addition to your trading toolkit.
Key Features:
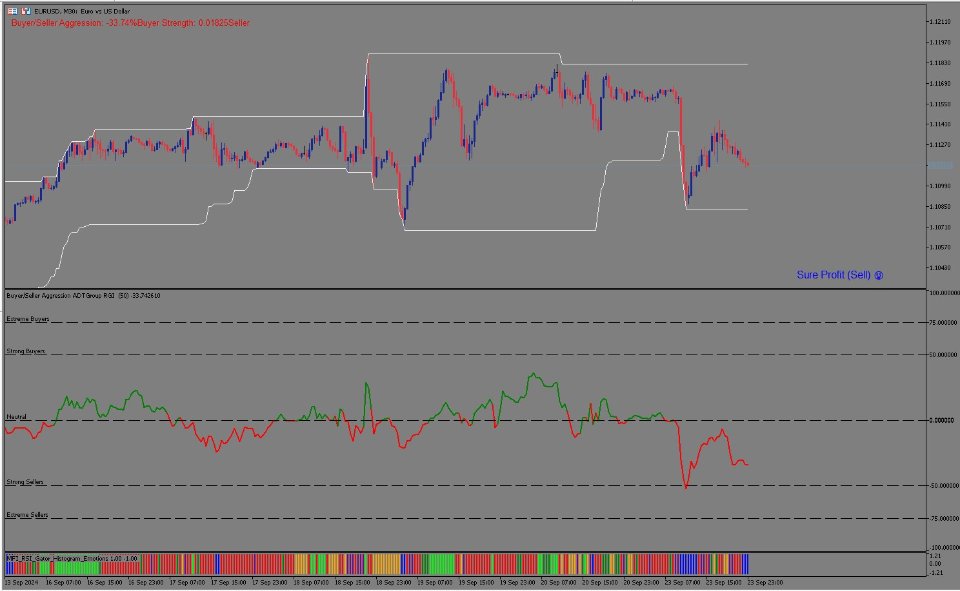
- User-Friendly Scale: The RGI operates on a -100 to 100 scale, allowing you to quickly assess market conditions.
- Instant Color Signals:
- Green Line: Indicates bullish momentum when the RGI is above zero.
- Red Line: Signals bearish momentum when the RGI is below zero.
- Critical Level Lines:
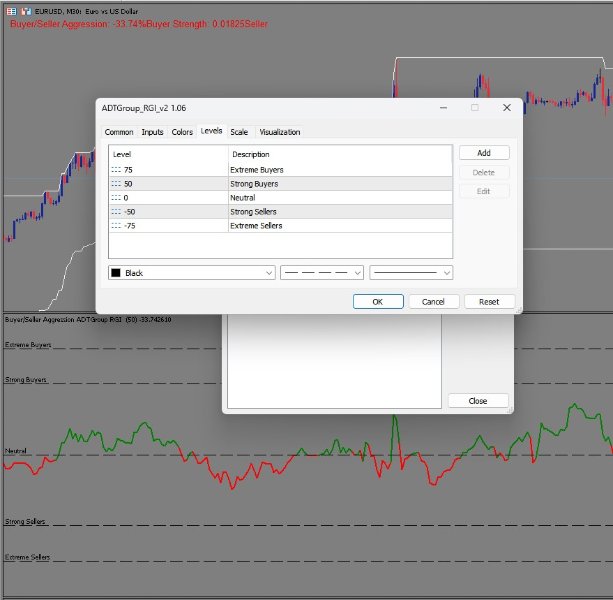
- 80 and -80: Highlight potential overbought and oversold conditions.
- 0: Serves as a neutral midpoint for trend analysis.
- Versatile Application: Suitable for any asset and timeframe, making it ideal for day traders and swing traders alike.
- Trend Confirmation: Use the RGI alongside other indicators to validate your trading signals and enhance your strategy.
How to Use the RGI:
- When the line is green and above 0, it suggests a strong upward trend.
- When the line is red and below 0, it indicates a downward trend.
- Watch for potential reversals when the RGI approaches the 80 or -80 levels.


