Swap Information Hunter Indicator
- 지표
- Qui Tuot Nguyen
- 버전: 1.0
- 활성화: 5
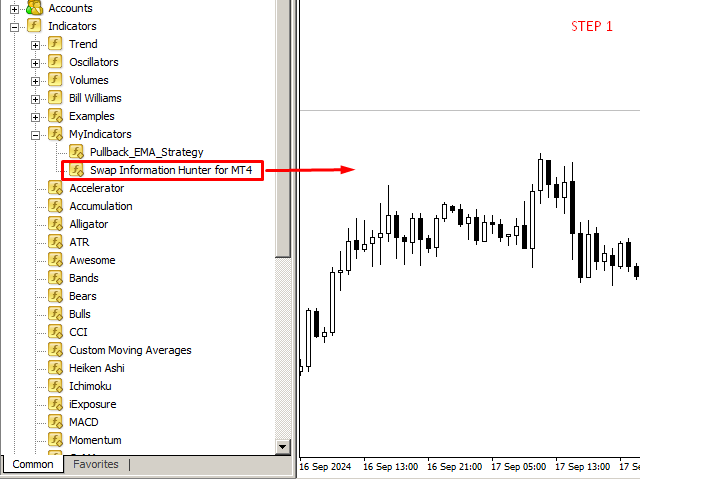
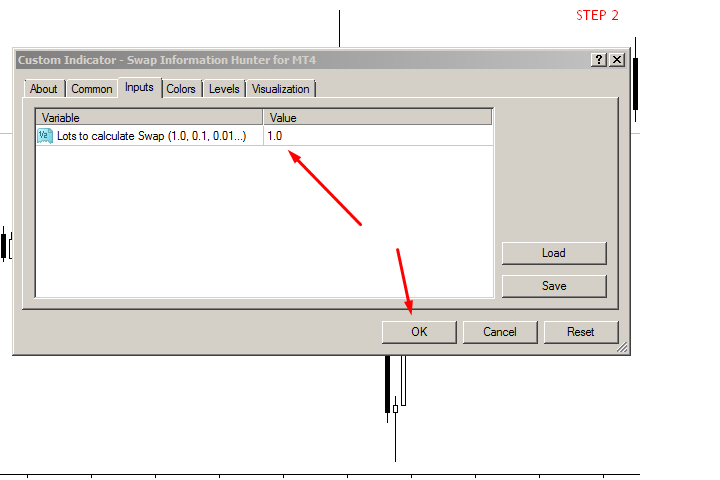
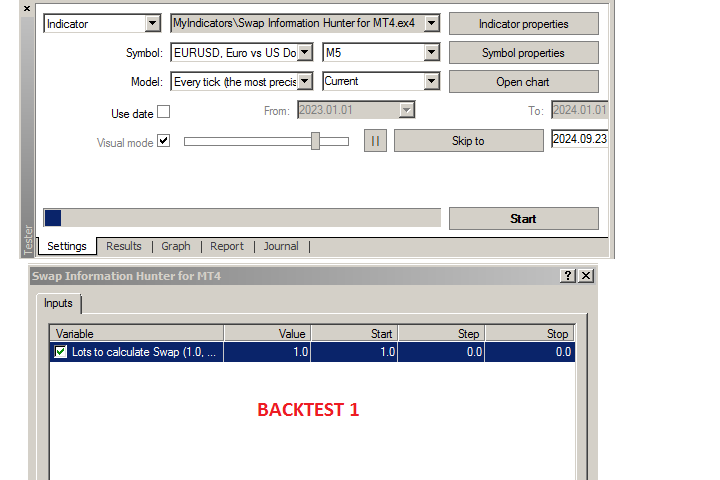
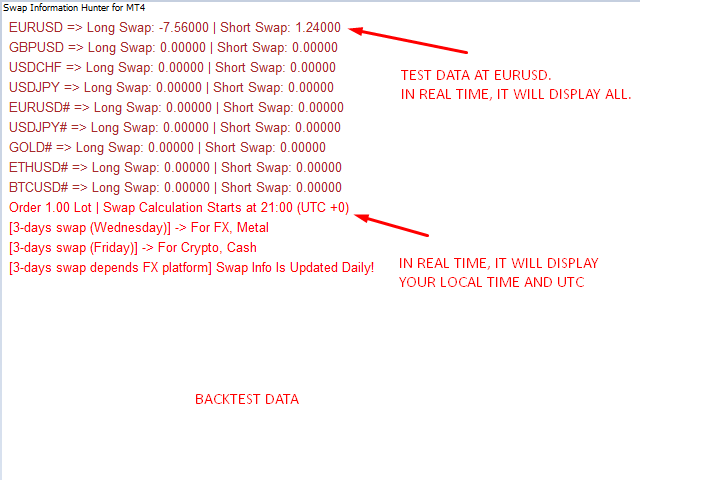
이 도구는 귀하의 거래 플랫폼에서 사용 가능한 모든 통화 쌍에 대한 자세한 스왑 비율을 표시하도록 설계되었습니다. 이를 통해 거래자는 시각적으로 향상된 별도의 창에서 매수 및 매도 스왑 값을 모두 빠르게 볼 수 있습니다. 이 도구는 로트 크기에 대한 사용자 정의 입력을 제공하여 현재 스왑 비율과 거래량을 기반으로 정확한 계산을 보장합니다. 또한 표준 및 주말 조정 요율을 모두 고려하여 스왑 수수료가 적용되는 시점을 제공합니다. 참고: 스왑 정보는 거래 플랫폼에 따라 매일 변경됩니다.
-------------------------------------------------------------------------------------------------------------------------------------------------------------
이 도구는 귀하의 거래 플랫폼에서 사용 가능한 모든 통화 쌍에 대한 자세한 스왑 비율을 표시하도록 설계되었습니다. 이를 통해 거래자는 시각적으로 향상된 별도의 창에서 매수 및 매도 스왑 값을 모두 빠르게 볼 수 있습니다. 이 도구는 로트 크기에 대한 사용자 정의 입력을 제공하여 현재 스왑 비율과 거래량을 기반으로 정확한 계산을 보장합니다. 또한 표준 및 주말 조정 요율을 모두 고려하여 스왑 수수료가 적용되는 시점을 제공합니다. 참고: 스왑 정보는 거래 플랫폼에 따라 매일 변경됩니다.