Asia Dealing Range with STDV
- 지표
- Jacobus Nicolaas Van Staden
- 버전: 1.8
Asia Range STDV Indicator
This Indicator is designed not only to identify the Asia session trading range and Standard Deviation levels but also to assist traders in creating a systematic entry and exit strategy based on the higher timeframe daily trend. The indicator supports both bullish and bearish scenarios, allowing traders to focus on key moments when the Asia range's high or low is "swept" (broken) in line with the confirmed trend.
Strategy Overview:
1. Confirming the Daily Trend (Bullish or Bearish):
- Bullish Trend: The user confirms that the higher timeframe (daily) is in an uptrend, meaning the market has been making higher highs and higher lows.
- Bearish Trend: The user confirms that the higher timeframe (daily) is in a downtrend, meaning the market has been making lower highs and lower lows.
- This trend confirmation becomes the primary filter for deciding the trade direction and whether to focus on the Asia range low or Asia range high being swept.
2. Bullish Example – Buy Setup (Asia Low Sweep):
- Wait for the Asia Low to be Swept: In a bullish daily trend, the focus is on the Asia session low. Once price sweeps below this low (a stop hunt or liquidity grab below the Asia range), this creates a potential buy setup.
- 15-Minute Market Structure Shift: After the sweep, the user waits for a 15-minute market structure shift (e.g., a break of a recent swing high). This confirms the potential for the market to reverse and move higher.
- Stop Loss: Place the stop loss below the -1 or -2 Standard Deviation levels, which are plotted below the Asia range. This gives the trade room to develop while keeping the stop loss at a logical level below where the sweep occurred.
- Take Profit: The target can be set at any positive Standard Deviation level (+1, +2, +3, or +4 STDV), which are plotted above the Asia range.
3. Bearish Example – Sell Setup (Asia High Sweep):
- Wait for the Asia High to be Swept: In a bearish daily trend, the focus is on the Asia session high. Once price sweeps above this high (a stop hunt or liquidity grab above the Asia range), this creates a potential sell setup.
- 15-Minute Market Structure Shift: After the sweep, the user waits for a 15-minute market structure shift (e.g., a break of a recent swing low). This confirms the potential for the market to reverse and move lower.
- Stop Loss: Place the stop loss above the +1 or +2 Standard Deviation levels, which are plotted above the Asia range. This protects the trade if the market continues to rally after the sweep.
- Take Profit: The target can be set at any negative Standard Deviation level (-1, -2, -3, or -4 STDV), which are plotted below the Asia range.
Key Components of the Strategy:
1. Daily Timeframe Trend Confirmation:
- Before taking any trades, the trader must confirm whether the higher timeframe daily trend is bullish or bearish. This trend confirmation filters out counter-trend trades and aligns the strategy with the broader market movement.
2. Asia Range Sweep:
- In a bullish scenario, the trader waits for the Asia low to be swept (price breaks below it), and in a bearish scenario, they wait for the Asia high to be swept (price breaks above it).
- A sweep suggests a potential liquidity grab (where stop-losses of previous positions are triggered), creating an opportunity for a reversal.
3. 15-Minute Market Structure Shift:
- Once the sweep occurs, the trader looks for a shift in the 15-minute market structure in the direction of the main trend. In a bullish case, this would be a break of a swing high, signaling that buyers have regained control. In a bearish case, it would be a break of a swing low, signaling that sellers have regained control.
4. Risk Management:
- Stop Loss: The stop loss is placed at logical levels that correspond to either the -1 or -2 Standard Deviation for bullish trades or the +1 or +2 Standard Deviation for bearish trades. This ensures that the stop is set beyond the Asia range extremes, accounting for possible volatility.
- Take Profit: The take profit can be set at any positive STDV for bullish trades or negative STDV for bearish trades, depending on how far the trader expects the market to move in the direction of the main trend.
Indicator Outputs:
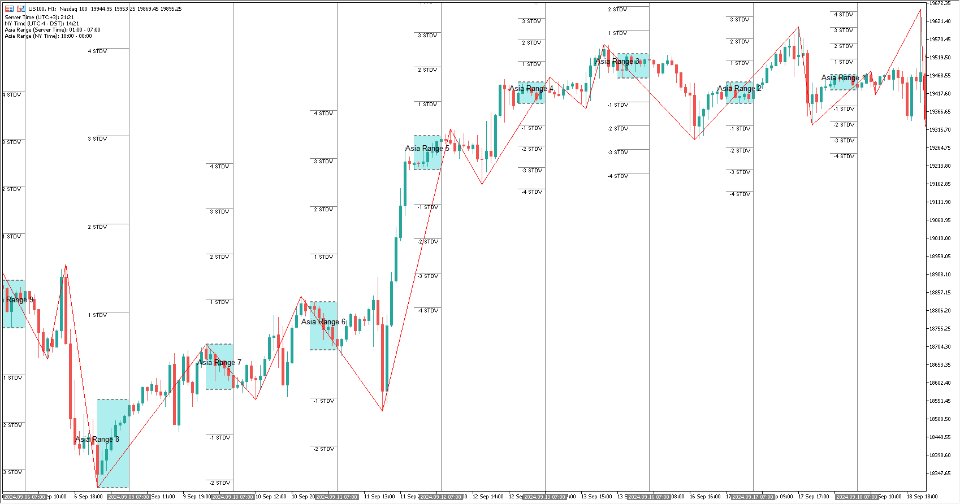
- Asia Range High and Low: Two horizontal lines representing the high and low of the Asia session, which is from 18:00 (previous day) to 00:00 (current day) New York time.
- Asia Range Rectangle: A rectangle visually filling the area between the Asia session high and low to help easily identify the range.
- Standard Deviation Levels: 1st, 2nd, 3rd, and 4th standard deviations plotted both above and below the Asia range, providing key areas to set stop-losses and take profits.
- Multiple Session Visualization: The indicator can display multiple previous Asia sessions (as defined by a user parameter) along with their respective standard deviations and vertical session end lines.
- Vertical Session End Line: A vertical line marking the end of the Asia session (at midnight NY time), helping the trader visually differentiate between sessions.
- Chart Comment: Displays the server and NY time, including whether daylight saving is being observed, and the Asia session start and end times in both server and NY time.
How to Use:
- Determine the Trend: Look at the daily chart to confirm whether the market is in a bullish or bearish trend.
- Wait for a Sweep: Once the Asia range is established, wait for the high or low to be swept based on the direction of the trend.
- Look for Market Structure Shift: After the sweep, switch to the 15-minute timeframe and look for a shift in market structure (either a break of a swing high for buys or a swing low for sells).
- Place Entry, Stop Loss, and Take Profit: Enter the trade, set your stop loss at the nearest standard deviation level, and target the next opposite standard deviation level for take profit.


