• 미리보기
  • 리뷰
  • 코멘트

Smart Fractal for MT5

Smart Fractals Indicator - MT5 거래를 위한 강화된 프랙탈

Smart Fractals는 당신이 알고 있는 클래식 프랙탈 지표의 진화입니다. MetaTrader 5를 위해 특별히 설계된 이 지표는 단순히 시장의 전통적인 반전 지점을 식별하는 것에 그치지 않고, 더 나아가 거래를 보다 효율적이고 수익성 있게 만들어 줍니다. 우리는 프랙탈의 기본 개념을 바탕으로 더 똑똑하고 기능적인 도구로 변환시켰습니다.

주요 특징:

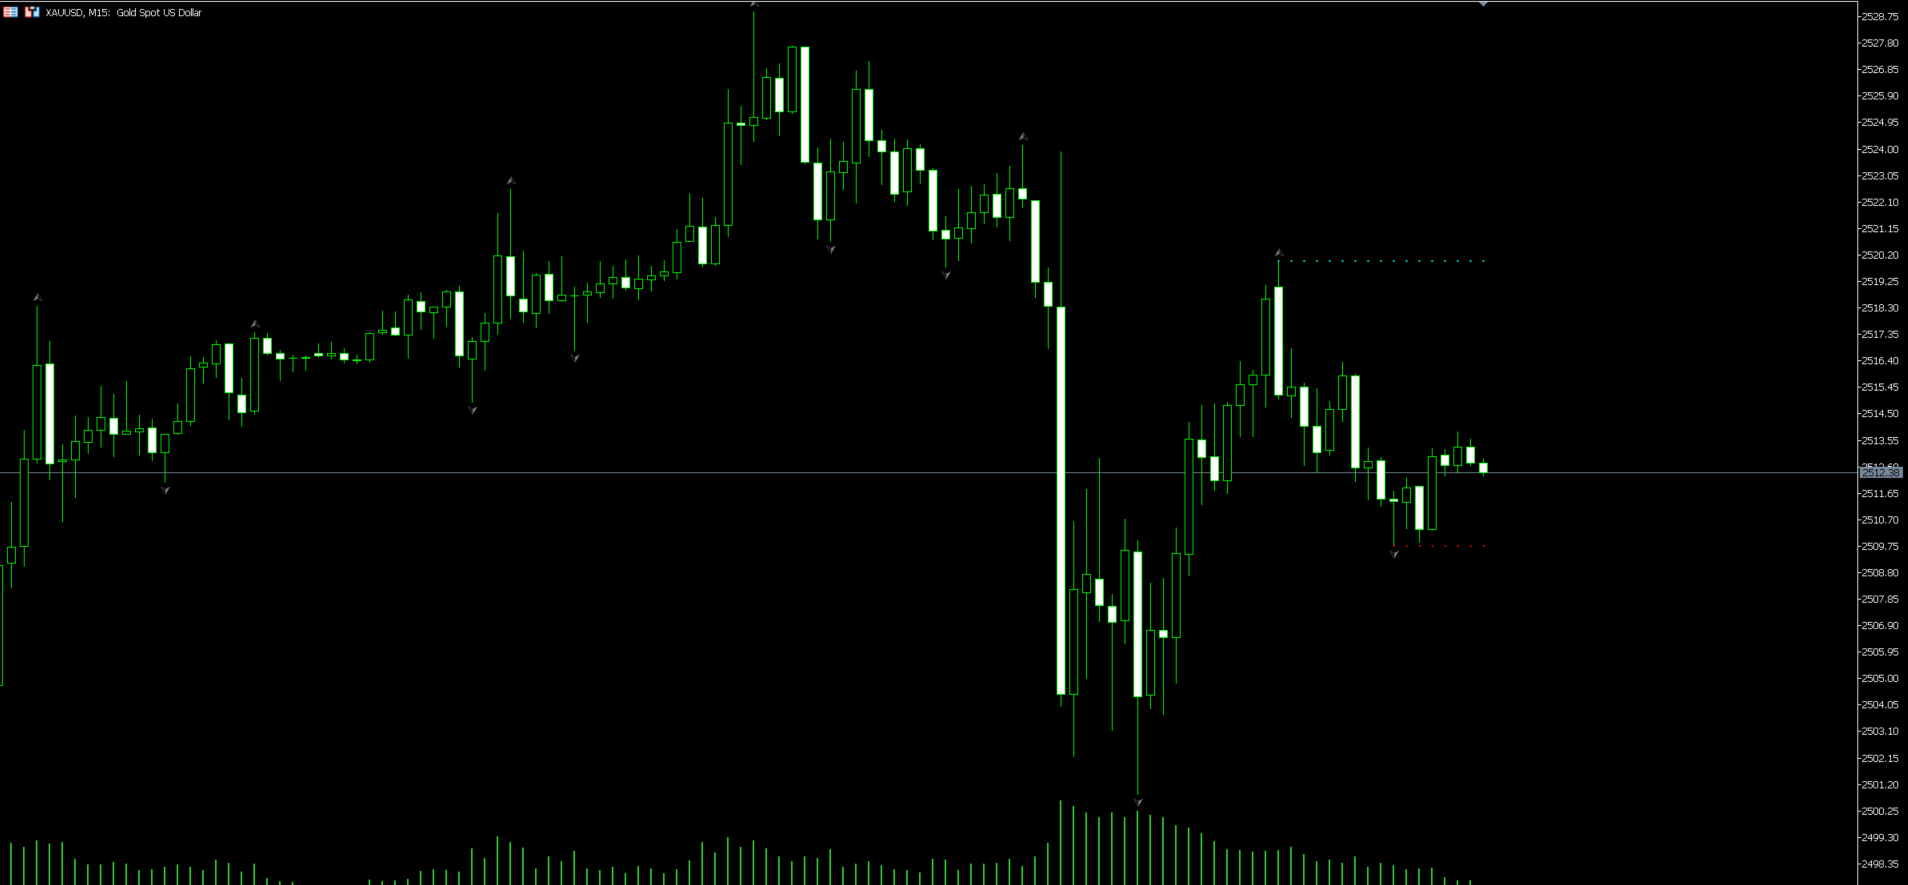
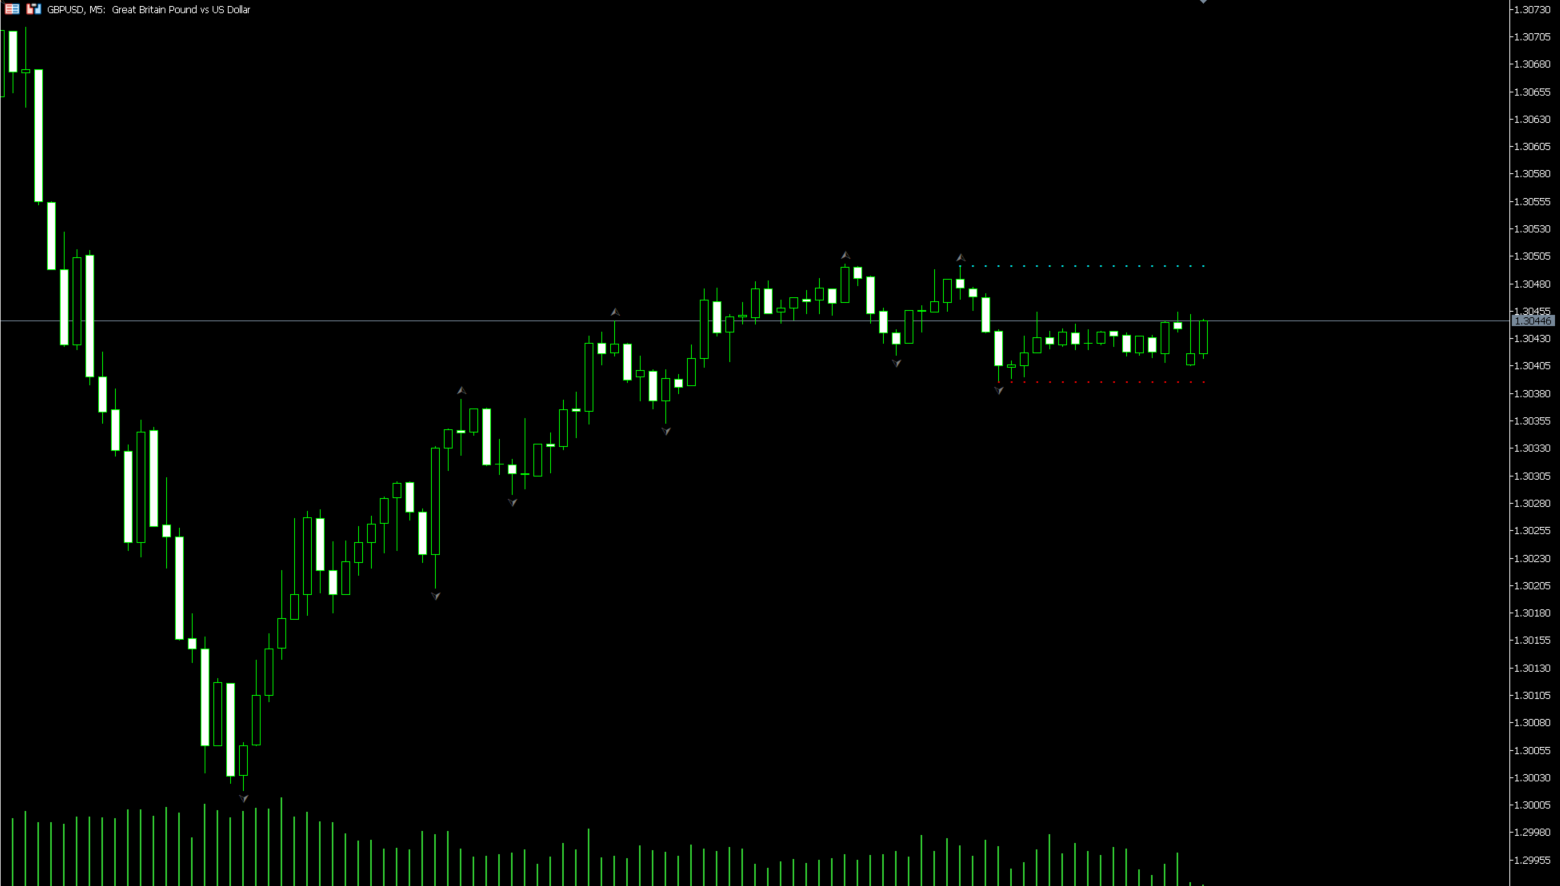
  • 매수 및 매도 신호: 전통적인 프랙탈이 시장의 전환점을 나타내는 것 외에도, Smart Fractals는 노란색과 보라색 화살표로 차트에 직접 표시되는 매수 및 매도 신호를 포함합니다. 이러한 신호는 보다 자신감을 가지고 포지션에 진입할 수 있게 해줍니다.

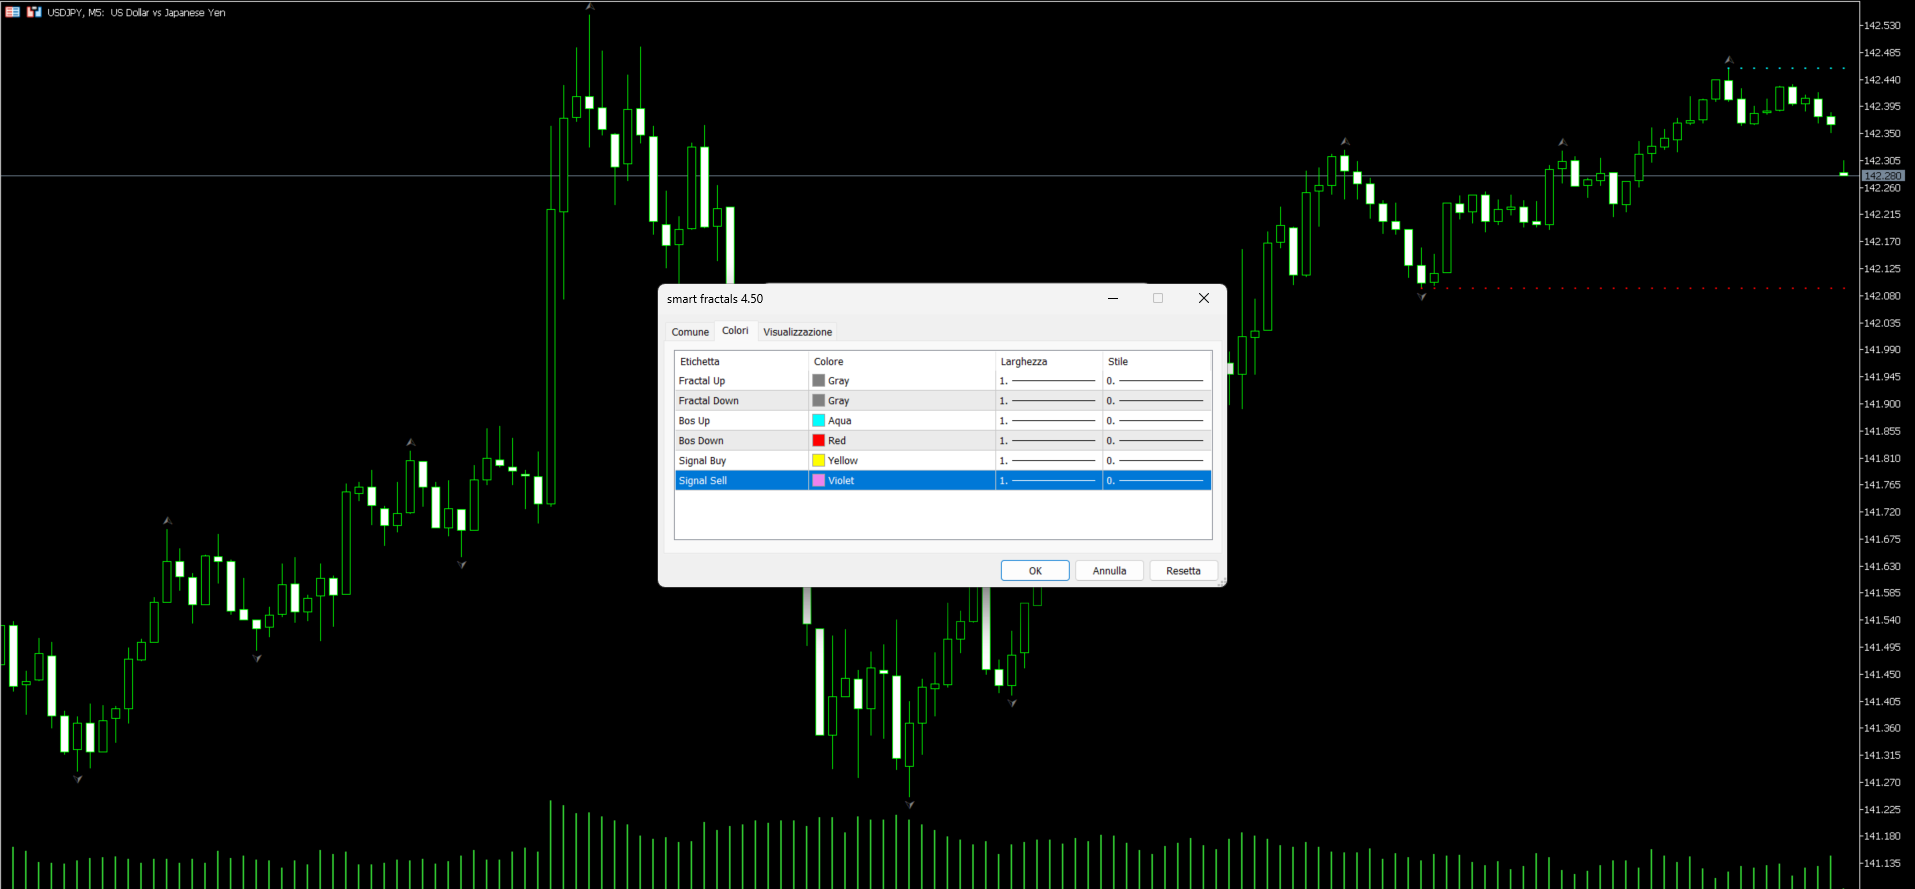
  • 개선된 시각화: 각 프랙탈은 명확하고 직관적으로 표시되며, 사용자가 설정할 수 있는 색상을 통해 '상승' 및 '하락' 프랙탈을 구분할 수 있습니다. 또한 시장 구조의 붕괴를 나타내는 구조적 돌파 (BOS)는 방향의 유효성을 확인하기 위해 실시간으로 표시됩니다.

  • 색상 및 스타일 커스터마이징: 다양한 신호에 대해 색상과 스타일을 선택해 시각적 선호도에 맞게 지표를 조정할 수 있습니다. 이미지에서 보여지듯이, 지표는 차트 분석을 보다 명확하고 빠르게 수행할 수 있도록 구성할 수 있습니다.

  • 다용성과 정밀성: 모든 시간 프레임과 주요 자산 (외환, 지수, 암호화폐 등)에서 작동하며, 정확하고 최신의 신호를 제공합니다.

Smart Fractals를 선택해야 하는 이유?

기술 분석을 바탕으로 거래 결정을 내리는 경우, Smart Fractals는 당신의 거래 질을 한 단계 끌어올릴 도구입니다. 전통적인 프랙탈을 식별할 뿐만 아니라, 추가된 매수 및 매도 신호 덕분에 경쟁력을 가질 수 있습니다. 잘못된 신호의 위험을 줄이고, 실시간으로 정확한 신호를 제공하는 지표로 거래 타이밍을 개선하십시오.

기회를 놓치지 말고, Smart Fractals로 프랙탈의 모든 잠재력을 활용하세요. 지금 구입해서 당신의 거래를 더 스마트하게 만드세요!


추천 제품
Introduction to Smart Renko The main characteristics of Renko Charting concern price movement. To give you some idea on its working principle, Renko chart is constructed by placing a brick over or below when the price make the movement beyond a predefined range, called brick height. Therefore, naturally one can see clear price movement with less noise than other charting type. Renko charting can provide much clearer trend direction and it helps to identify important support and resistance level
Renko Graph
Iurii Tokman
Renko Graph   렌코 그래프 현재 가격이 있는 위치의 메인 차트 창에 있는 Renko 표시기. 표시기는 일반 시세 차트의 배경에 대해 직사각형("벽돌") 형태로 가격 변동을 표시합니다. 설정에 지정된 포인트 수만큼 가격의 상승 움직임은 이전 다음 직사각형 위에 추가하고 아래로 움직임(이전 직사각형 아래)을 추가하여 표시됩니다. 표시기는 주요 추세를 시각적으로 식별하도록 설계되었습니다. 기본 추세를 평균화할 때 주요 지원 및 저항 수준을 식별하는 데 사용됩니다. 이 보기는 작은 가격 변동("소음")을 고려하지 않으므로 실제로 중요한 움직임에 집중할 수 있습니다. 가격 변동이 지정된 임계값 수준을 초과한 경우에만 위 또는 아래의 새 지표 값이 표시됩니다. 크기는 설정에서 설정되며 항상 동일합니다. 예를 들어 기본 사이즈가 10포인트이고 가격이 20포인트 오른 경우 2개의 지표 값이 작성됩니다. 표시기의 장점은 벽돌 중 하나가 형성 시간을 나타낼 수 있다는 것입니다. 가격이 범위
Renko Plus
Eadvisors Software Inc.
With Renko Plus you can use the features in the Indicator functionality, just add it to the Metatrader5 chart.             The Renko chart is a type of chart, developed by the Japanese, that is constructed using price movement rather than standardized prices and time intervals like most charts. It is believed to be named after the Japanese word for bricks, "renga", as the graphic looks like a series of bricks.             A new brick is created when the price moves a specified p
Fibo Expertt
Ignacio Agustin Mene Franco
Fibo expert! It is an automatic fibonacci indicator. adapting to any temporality, to catch those rebounds, or the path of that trend, special to make longs in H1 or H4 clear the trend, but it also works for scalp in m1 up to m15 works for all forex pairs and for all pairs of synthetic indices, ideal for volatility 75 in synthetics no more to enjoy good profit World Investor.
The indicator is designed to work on any trading platform. The program is based on proprietary algorithms and W.D.Ganna's mathematics, allowing you to calculate target levels of price movement based on three points with the highest degree of certainty. It is a great tool for stock trading. The indicator has three buttons: NEW - call up a triangle for calculation. DEL - delete the selected triangle. DELS - completely remove all constructions. The probability of achieving the goals is more than 80
Robust median Renko style indicator for creating custom charts resembling Median Renko, Mean Renko, Turbo Renko and Better Renko candles as well as vanilla Renko with wicks plus Point-O charts. This all in one package provides all of the signals needed by day traders, scalpers, and even long-term traders. Main characteristics The indicator is an overlay on the main chart so it is possible to utilize one-click trading and order manipulation directly on the custom charts. Visual order placement
Gino Renko
Stephane, Andr Valette
1 (1)
Another renko-based indicator. It returns different usable values ​​for an EA, and is directly displayed on the main chart. Its setting is very simple: The size of the renko The number of bars taken into account The falling color The color on the rise Returned values: Buffer 0 : Value of the middle Buffer 1 : Value of the Top Buffer 2 : Value of the Bottom Buffer 3 : Direction of renko (0.0 for top ; 1.0 for bottom) Buffer 4 : Ratio of the renko, for example, if it is twice, 3 times, ro more of
Trend Channel mt5
Tatiana Savkevych
Trend Channel is a Forex trend arrow indicator for identifying potential entry points. I like it, first of all, because it has a simple operating mechanism, adaptation to all time periods and trading tactics. Created based on a regression channel with filters. We display the signals of the Trend Channel indicator on the price function chart using a mathematical approach. How it works: when the price breaks through the overbought/oversold zone (channel levels), a buy or sell signal is generate
Trend Direction ADX indicator for MT5
Renaud Herve Francois Candel
Trend Direction ADX indicator Trend Direction ADX is part of a serie of indicators used to characterize market conditions. Almost any strategy only work under certain market conditions. Therefore it is important to be able to characterize market conditions at any time: trend direction, trend strength, volatility, etc.. Trend Direction ADX is an indicator to be used to characterize trend direction: trending up trending down ranging Trend Direction ADX is based on ADX standard indicator.
All about time and price by ICT. This indicator provides a comprehensive view of ICT killzones, Silver Bullet times, and ICT Macros, enhancing your trading experience.  In those time windows price either seeks liquidity or imbalances and you often find the most energetic price moves and turning points. Features: Automatic Adaptation: The ICT killzones intelligently adapt to the specific chart you are using. For Forex charts, it follows the ICT Forex times: In EST timezone: Session: Asia: 20h00-0
Advanced 4xZeovo MT5 Indicator (MetaTrader 5)   Product Description  4xZeovo is a powerful trading indicator system monitoring 24/7 financial markets. Metatrader5 tool designed to find the best buying/selling opportunities and notifies the user.    Making life easy for traders in helping with the two most difficult decisions with the use of advanced innovate trading indicators aiming to encourage users to hold the winning positions and take profit at the best times.    Equipped with a unique tra
Owl Smart Levels MT5
Sergey Ermolov
4.07 (28)
MT4 버전  |  FAQ Owl Smart Levels Indicator 는 Bill Williams 의 고급 프랙탈, 시장의 올바른 파동 구조를 구축하는 Valable ZigZag, 정확한 진입 수준을 표시하는 피보나치 수준과 같은 인기 있는 시장 분석 도구를 포함하는 하나의 지표 내에서 완전한 거래 시스템입니다. 시장과 이익을 취하는 장소로. 전략에 대한 자세한 설명 표시기 작업에 대한 지침 고문-거래 올빼미 도우미의 조수 개인 사용자 채팅 ->구입 후 나에게 쓰기,나는 개인 채팅에 당신을 추가하고 거기에 모든 보너스를 다운로드 할 수 있습니다 힘은 단순함에 있습니다! Owl Smart Levels 거래 시스템은 사용하기 매우 쉽기 때문에 전문가와 이제 막 시장을 연구하고 스스로 거래 전략을 선택하기 시작한 사람들 모두에게 적합합니다. 전략 및 지표에는 눈에 보이지 않는 비밀 공식 및 계산 방법이 없으며 모든 전략 지표는 공개되어 있습니다. Owl Smart Levels를
Matreshka
Dimitr Trifonov
5 (1)
Matreshka self-testing and self-optimizing indicator: 1. Is an interpretation of the Elliott Wave Analysis Theory. 2. Based on the principle of the indicator type ZigZag, and the waves are based on the principle of interpretation of the theory of DeMark. 3. Filters waves in length and height. 4. Draws up to six levels of ZigZag at the same time, tracking waves of different orders. 5. Marks Pulsed and Recoil Waves. 6. Draws arrows to open positions 7. Draws three channels. 8. Notes support and re
Cumulative Vol Bands
Thalles Nascimento De Carvalho
CVB Cumulative Volume Bands: 누적 거래량으로 트레이드를 강화하세요! CVB Cumulative Volume Bands 는 누적 거래량에 기반한 정확한 신호를 찾는 트레이더를 위해 설계된 고급 지표입니다. 이 지표는 누적 거래량 밴드를 사용하여 시장의 매수 및 매도 압력을 명확하게 읽고, 반전 및 강력한 가격 변동을 식별하는 데 도움을 줍니다. 주요 특징: 누적 거래량 분석 : 거래량을 기반으로 주요 압력 지점을 감지합니다. 명확한 진입/퇴출 신호 : 실시간으로 기회를 포착하세요. 쉬운 해석 : 사용자 친화적인 인터페이스와 간단한 시각적 표현. 모든 자산 및 시간 프레임에 적합 : 모든 시장에서 언제든지 사용 가능합니다. CVB Cumulative Volume Bands 로 한 발 앞서 나가며 자신감을 가지고 트레이딩 결정을 개선하세요! 피드백을 남기시고 개선에 도움을 주세요!
Market Imbalance MT5
Scott Edward Merritt
What Is Market Imbalance? Market Imbalance, also known as "IPA" or Improper Price Action, is when price moves so quick in one direction with no orders on the other side of the market to mitigate the price movement. We all know Big Banks, or "Smart Money", can move the market by placing huge orders which in turn can move price significantly. They can do this because Big Banks are the  top 10 Forex traders in the world . But unfortunately, the Big Banks cannot leave these orders in drawdown and mu
This indicator uses a mathematical calculation algorithm . This algorithm calculates the remainder between the updated model and the actual values and produces the possible progress of the graph on the graph. It is not a super prophet in trading, but it is very good for the trader when entering the market and to analyze it before entering. Applicable for all currencies. Данный индикатор использует алгоритм математических вычислений . Данный алгоритм вычисляет остаток между обновленной моделью и
BOS CHoCH and FVG
Saksham Solanki
Contact me for any queries or custom orders, if you want to use this in an EA. Key Features: Pattern Recognition : Identifies Fair Value Gaps (FVGs) Spots Break of Structure (BOS) points Detects Change of Character (CHoCH) patterns Versatile Application : Optimized for candlestick charts Compatible with any chart type and financial instrument Real-Time and Historical Analysis : Works seamlessly with both real-time and historical data Allows for backtesting strategies and live market analysis Vis
FREE
KT ROC Divergence MT5
KEENBASE SOFTWARE SOLUTIONS
KT ROC divergence shows the regular and hidden divergences build between the price and Rate of change oscillator. Rate of change (ROC) is a pure momentum oscillator that calculates the change of percentage in price from one period to another. It compares the current price with the price "n" periods ago. ROC = [(Close - Close n periods ago) / (Close n periods ago)] * 100 There is an interesting phenomenon associated with ROC oscillator. In ROC territory there is no upward limit, but there is a do
O Alpha B3 Renko Trader  é um robô especialista para negociação no Bovespa B3  (miniíndice e minidólar) que une a análise de candlesticks do gráfico Renko (calculado internamente, sem imagens gráficas) com a estratégia Alpha B3 . O robô permite configurar, para os sinais de entrada, o tamanho do brick do gráfico Renko, bem como um número de candlesticks para análise. Além disso, você deve configurar os stops fixos, em pontos. O robô permite também a configuração de funções, tais como número de c
Renko Profesional
Ignacio Agustin Mene Franco
Renko Professional, Safari pack indicator 2 . On this occasion it has the professional renko indicator, which has the strategy of support, resistance, bullish green line and bearish red line. It marks the entry points and accumulation points very well! It works for all seasons! For the forex markets and synthetic indices ! Works for all pairs! Good profit!
Rejection Block Trader
Usiola Oluwadamilol Olagundoye
FREE EA   for   GOLD ,   M1 Gold  Trader   can be found here:  https://www.mql5.com/en/market/product/120543 FREE to Use until June 3, 2024, $65 afterwards Timeframe : M5 Only. Symbol : XAUUSD Check the comment section for the .set file Introducing the "Rejection Block EA," a specialized trading solution meticulously crafted for trading GOLD (XAU/USD) with unparalleled precision and efficiency on the 5 minute timeframe. This expert advisor leverages the power of rejection candle blocks iden
AlphaBot
Piotr Stepien
5 (6)
Alpha BOT  is a professional automatic trading system designed and optimized for the MT5 platform and multi currency pair. The principle of operation is based on support and resistance, uses pullback of currency pairs and deep machine learning, the EA independently adjusts to market volatility. Tested in sample and in out of sample with positive results since 2010y. Currency pair: AUDCAD,NZDCAD,AUDNZD. Requirements: Leverage 1:30 or higher  Minimum deposit 500 USD, recomended 1000 USD (
KDJ Index 4   交易实用必备工具指标 波浪自动计算指标,通道趋势交易 完美的趋势-波浪自动计算通道计算 , MT4版本 完美的趋势-波浪自动计算通道计算 , MT5版本 本地跟单复制交易 Easy And Fast Copy , MT4版本 Easy And Fast Copy , MT5版本 本地跟单复制交易 模拟试用 Easy And Fast Copy , MT4 模拟账号运行 Easy And Fast Copy , MT5 模拟账号运行 "Cooperative QQ:556024  "  "Cooperation wechat:556024"  "Cooperative email:556024@qq.com" 强烈推荐趋势指标, 波浪的标准自动计算   和   波浪的标准自动计算MT5版本     KDJ指标又叫 随机指标 ,是一种相当新颖、实用的技术分析指标,它起先用于期货市场的分析,后被广泛用于股市的中短期趋势分析,是期货和股票市场上最常用的技术分析工具。 随机指标KDJ一般是用于股票分析的统计体系,根据统计学原理,通过一个特定的周期(常为9日、9周等
We have turned one application of the RSI indicator into a separate indicator, represented by red and green bars, which is incredibly simple and effective. By simply inputting the parameters for the RSI, you can obtain the RSI indicator represented by red and green bars. The application of the RSI indicator has been expanded into a powerful new indicator, visually presented through red and green bars, undoubtedly an innovative move in the field of financial technical analysis. The design of t
Renko indicator helps develop Renko charts on different symbols. Advantages Drag and drop the indicator on M1 timeframe of the symbol chart Realtime updates Indicator can be used for Expert Advisors and technical analysis Backtest your strategy using Renko indicator Parameters BOX SIZE: Input the number of box size. The box size reflects the difference of the symbol price. So, a 50 box size would reflect a 5 pip value difference in a currency pair symbol Show Wicks: If true , high or low of
One of the most famous phrases in the trading world is "The Trend Is Your Friend". Trading following the current trend is one of the most successful ways in terms of probability. The hard part of it is to recognize when the market is trending or not. that's the role of our indicator we called The Trend Is Your Friend Until It Is Not. Apart from its big name it is really easy to use and see when the market is trending or ranging. Through a little window of 3 colors you will identify if the ma
Very special indicator of Joe Dinapoli which is a derivative from traditional MACD indicator. It shows the precise price, at which MACD will show line crossing and trend shifting. Also, this level is known one period ahead of time.You can constantly reassess your current position by looking at this studying a variety of timeframes. When you are in a trade, you have a feel for how much time you have for the trade to go your way by looking at the distance between the MACD Predictor line and the
Smooth Patterns
Roman Vashchilin
Trading patterns on Forex is considered to be the highest level of trading, since it usually requires years of mastering various patterns (shapes and candle combinations) and the ways they affect the price. Patterns are different combinations of Japanese candles on a chart, shapes of classical technical analysis, as well as any regularities of the market behavior repeating many times under the same conditions. After the patterns appear on a chart, the price starts behaving in a certain way allow
Supertrend indicator uses a combination of a moving average and average true range to detect the trend of a trading instrument. Supertrend indicator for MetaTrader 5 easily shows the trend as a line following the price. Triple SuperTrend Histo indicator  calculate  three supertrends to show the trend as a histogram. Changing the color from red to green means you can BUY , from green to red means you can SELL . Description of the method of drawing a histogram. The price is above the EMA 20
Alpha Striker SMC KING is unique Expert Advisor that continues the Alpha Striker series of  expert advisors. Innovative methods of the programme's approach to trading, and promising performance results are possible thanks to the use of modern technologies and methods. The Alpha Striker SMC KING is a fully automated EA designed to trade currencies only. Working pairs recommended EURUSD. Expert showed stable results on currencies in 2022-2024 period. No dangerous methods of money management used,
이 제품의 구매자들이 또한 구매함
TPSpro RFI Levels MT5
Roman Podpora
4.7 (10)
Reversal First Impulse levels (RFI)      INSTRUCTIONS        RUS       -       ENG              R ecommended to use with an indicator   -   TPSpro  TREND PRO -  Version MT4                 A key element in trading is zones or levels from which decisions to buy or sell a trading instrument are made. Despite attempts by major players to conceal their presence in the market, they inevitably leave traces. Our task was to learn how to identify these traces and interpret them correctly. Main functi
TPSproTREND PrO MT5
Roman Podpora
4.89 (9)
TPSpro TREND PRO  - is a trend indicator that automatically analyzes the market and provides information about the trend and each of its changes, as well as giving signals for entering trades without redrawing! The indicator uses each candle, analyzing them separately. referring to different impulses - up or down impulse. Exact entry points into transactions for currencies, crypto, metals, stocks, indices!  Version MT4               DETAILED DESCRIPTION               R ecommended to use with an
Atomic Analyst MT5
Issam Kassas
4.56 (18)
우선적으로 언급할 점은이 거래 지표가 다시 그리지 않고 지연되지 않으며 이를 통해 수동 및 로봇 거래 모두에 이상적이라는 점입니다. 사용자 매뉴얼: 설정, 입력 및 전략. Atomic Analyst는 가격의 강도와 모멘텀을 활용하여 시장에서 더 나은 이점을 찾는 PA Price Action Indicator입니다. 고급 필터를 장착하여 잡음과 거짓 신호를 제거하고 거래 잠재력을 높이는 데 도움이 됩니다. 복잡한 지표의 다중 레이어를 사용하여 Atomic Analyst는 차트를 스캔하고 복잡한 수학적 계산을 간단한 신호와 색상으로 변환하여 초보 트레이더가 이해하고 일관된 거래 결정을 내릴 수 있도록합니다. "Atomic Analyst"는 새로운 및 경험이 풍부한 트레이더를위한 종합적인 거래 솔루션입니다. 프리미엄 지표와 최고 수준의 기능을 하나의 거래 전략에 결합하여 모든 종류의 트레이더에 대한 다재다능한 선택지가되었습니다. 인트라데이 거래 및 스캘핑 전략 : 빠르고 정확한
Atbot
Zaha Feiz
4.97 (31)
AtBot: 작동 방식 및 사용 방법 ### 작동 방식 MT5 플랫폼용 "AtBot" 지표는 기술 분석 도구의 조합을 사용하여 매수 및 매도 신호를 생성합니다. 01:37 단순 이동 평균(SMA), 지수 이동 평균(EMA), 평균 진폭 범위(ATR) 지수를 통합하여 거래 기회를 식별합니다. 또한 Heikin Ashi 캔들을 사용하여 신호의 정확성을 향상시킬 수 있습니다. 구매 후 리뷰를 남기면 특별 보너스 선물을 받게 됩니다. ### 주요 기능: - 비재표시: 신호는 플로팅 후 변경되지 않습니다. - 비재작성: 신호는 일관되며 변경되지 않습니다. - 지연 없음: 지연 없이 시기적절한 신호를 제공합니다. - 다양한 시간대: 거래 전략에 맞게 모든 시간대에서 사용할 수 있습니다. ### 운영 단계: #### 입력 및 설정: - firstkey (TrendValue): 추세 감지의 민감도를 조정합니다. - Secondkey (SignalValue): 매수/매도 신호 생성의 민감도를 정의
우선 이 거래 시스템이 리페인팅, 리드로잉 및 레이그 인디케이터가 아니라는 점을 강조하는 것이 중요합니다. 이는 수동 및 로봇 거래 모두에 이상적인 것으로 만듭니다. 온라인 강좌, 설명서 및 프리셋 다운로드. "스마트 트렌드 트레이딩 시스템 MT5"은 새로운 및 경험이 풍부한 트레이더를 위해 맞춤형으로 제작된 종합적인 거래 솔루션입니다. 10개 이상의 프리미엄 인디케이터를 결합하고 7개 이상의 견고한 거래 전략을 특징으로 하여 다양한 시장 조건에 대한 다목적 선택이 가능합니다. 트렌드 추종 전략: 효과적인 트렌드 추이를 타기 위한 정확한 진입 및 손절 관리를 제공합니다. 반전 전략: 잠재적인 트렌드 반전을 식별하여 트레이더가 범위 시장을 활용할 수 있게 합니다. 스캘핑 전략: 빠르고 정확한 데이 트레이딩 및 단기 거래를 위해 설계되었습니다. 안정성: 모든 인디케이터가 리페인팅, 리드로잉 및 레이그가 아니므로 신뢰할 수 있는 신호를 보장합니다. 맞춤화: 개별 거래 선호도를 고려한 맞춤
Gold Stuff mt5
Vasiliy Strukov
4.92 (161)
Gold Stuff mt5는 금을 위해 특별히 설계된 추세 지표이며 모든 금융 상품에서도 사용할 수 있습니다. 표시기가 다시 그려지지 않고 지연되지 않습니다. 권장 기간 H1. 설정 및 개인 보너스를 받으려면 구매 후 즉시 저에게 연락하십시오!     강력한 지원 및 트렌드 스캐너 표시기의 무료 사본을 받으실 수 있습니다. 메시지를 보내주세요. 나!   설정 화살표 그리기 - 켜기 끄기. 차트에 화살표 그리기. 경고 - 가청 경고를 끕니다. 이메일 알림 - 켜기 끄기. 이메일 알림. Puch-notification - 켜기 끄기. 푸시 알림. 다음으로 색 영역을 조정합니다. Gold Stuff mt5는 금을 위해 특별히 설계된 추세 지표이며 모든 금융 상품에서도 사용할 수 있습니다. 표시기가 다시 그려지지 않고 지연되지 않습니다. 권장 기간 H1. 설정 및 개인 보너스를 받으려면 구매 후 즉시 저에게 연락하십시오!   설정 화살표 그리기 - 켜기 끄기. 차트에
Entry Points Pro for MT5
Yury Orlov
4.46 (123)
다시 색을 칠하지 않고 거래에 진입할 수 있는 정확한 신호를 제공하는 MT5용 지표입니다. 외환, 암호화폐, 금속, 주식, 지수 등 모든 금융 자산에 적용할 수 있습니다. 매우 정확한 추정값을 제공하고 매수와 매도의 가장 좋은 시점을 알려줍니다. 하나의 시그널로 수익을 내는 지표의 예와 함께 비디오 (6:22)시청하십시오! 대부분의 거래자는 Entry Points Pro 지표의 도움으로 첫 거래 주 동안 트레이딩 결과를 개선합니다. 저희의   Telegram Group 을 구독하세요! Entry Points Pro 지표의 좋은점. 재도색이 없는 진입 신호 신호가 나타나고 확인되면(시그널 캔들이 완성된 경우) 신호는 더 이상 사라지지 않습니다. 여타 보조지표의 경우 신호를 표시한 다음 제거되기 때문에 큰 재정적 손실로 이어집니다. 오류 없는 거래 게시 알고리즘을 통해 트레이드(진입 또는 청산)를 할 이상적인 순간을 찾을 수 있으며, 이를 통해 이를 사용하는 모든 거래자의
Trend Screener Pro MT5
STE S.S.COMPANY
4.87 (61)
트렌드 표시기, 트렌드 트레이딩 및 필터링을 위한 획기적인 고유 솔루션, 하나의 도구 안에 내장된 모든 중요한 트렌드 기능! Forex, 상품, 암호 화폐, 지수 및 주식과 같은 모든 기호/도구에 사용할 수 있는 100% 다시 칠하지 않는 다중 시간 프레임 및 다중 통화 표시기입니다. Trend Screener는 차트에 점이 있는 화살표 추세 신호를 제공하는 효율적인 지표 추세 추종 지표입니다. 추세 분석기 표시기에서 사용할 수 있는 기능: 1. 트렌드 스캐너. 2. 최대 이익 분석이 있는 추세선. 3. 추세 통화 강도 측정기. 4. 경고가 있는 추세 반전 점. 5. 경고가 있는 강력한 추세 점. 6. 추세 화살표 Trend Screener Indicator가 있는 일일 분석 예, 일일 신호 성능...등은 여기에서 찾을 수 있습니다. 여기를 클릭하십시오. LIMITED TIME OFFER : Trend Screener Indicator는 50$ 및 평생 동안만 사용할 수 있습니다
FX Power MT5 NG
Daniel Stein
5 (5)
모닝 브리핑 여기 mql5 와 텔레그램에서 FX Power MT5 NG 는 오랫동안 인기 있는 통화 강도 측정기인 FX Power의 차세대 버전입니다. 이 차세대 강도 측정기는 무엇을 제공합니까? 기존 FX Power에서 좋아했던 모든 것 PLUS GOLD/XAU 강도 분석 더욱 정밀한 계산 결과 개별 구성 가능한 분석 기간 더 나은 성능을 위한 사용자 정의 가능한 계산 한도 특별 멀티더 많은 것을보고 싶은 사람들을위한 특별한 다중 인스턴스 설정 모든 차트에서 좋아하는 색상을위한 끝없는 그래픽 설정 수많은 알림 옵션, 중요한 것을 다시는 놓치지 않도록 Windows 11 및 macOS 스타일의 둥근 모서리가 있는 새로운 디자인 마법처럼 움직이는 인디케이터 패널 FX 파워 키 특징 모든 주요 통화의 완전한 강세 이력 모든 시간대에 걸친 통화 강세 이력 모든 브로커 및 차트에서 고유 계산 결과 100% 신뢰할 수있는 실시간100 % 신뢰할 수있는 실시간 계산-> 다시 칠하지 않음
IX Power MT5
Daniel Stein
4.17 (6)
IX Power는   마침내 FX Power의 탁월한 정밀도를 외환이 아닌 기호에도 적용했습니다. 좋아하는 지수, 주식, 원자재, ETF, 심지어 암호화폐까지 단기, 중기, 장기 추세의 강도를 정확하게 파악할 수 있습니다. 단말기가 제공하는   모든 것을 분석할   수 있습니다. 사용해 보고 트레이딩   타이밍이 크게 향상되는   것을 경험해 보세요. IX Power 주요 특징 단말기에서 사용 가능한 모든 거래 심볼에 대해 100% 정확한 비재도장 계산 결과 제공 사전 구성 및 추가적으로 개별 구성 가능한 강도 분석 기간의 드롭다운 선택 가능 이메일, 메시지, 모바일 알림을 통한 다양한 알림 옵션 제공 EA 요청을 위한 액세스 가능한 버퍼 더 나은 성능을 위한 사용자 지정 가능한 계산 한도 더 많은 것을 보고 싶은 사용자를 위한 특별 다중 인스턴스 설정 모든 차트에서 좋아하는 색상을 위한 무한한 그래픽 설정 가능 Windows 11 및 macOS 스타일의 둥
Advanced Supply Demand MT5
Bernhard Schweigert
4.5 (14)
현재 33% 할인! 초보자나 전문 트레이더를 위한 최고의 솔루션! 이 보조지표는 우리가 다수의 독창적 기능과 새로운 공식을 통합한 독특하고 고품질이며 저렴한 거래 도구입니다. 이 업데이트를 통해 이중 시간대를 표시할 수 있습니다. 더 높은 TF를 표시할 수 있을 뿐만 아니라 차트 TF와 더 높은 TF 모두를 표시할 수 있습니다: 중첩 영역 표시. 모든 Supply Demand 트레이더들이 좋아할 것입니다. :) 중요한 정보 공개 Advanced Supply Demand의 잠재력을 극대화하려면 다음을 방문하십시오. https://www.mql5.com/ko/blogs/post/720245   진입 또는 목표의 명확한 트리거 포인트를 정확히 찾아냄으로 해서 거래가 어떻게 개선될지 상상해 보십시오. 새로운 알고리즘을 기반으로 매수자와 매도자 간의 잠재적인 불균형을 훨씬 더 쉽게 분간할 수 있습니다. 왜냐하면 가장 강한 공급영역과 가장 강한 수요 영역과 과거에 어떻게 진행 되었는지를(이
MetaForecast M5
Vahidreza Heidar Gholami
5 (2)
MetaForecast는 가격 데이터의 조화를 기반으로 모든 시장의 미래를 예측하고 시각화합니다. 시장이 항상 예측 가능한 것은 아니지만 가격에 패턴이 있다면 MetaForecast는 가능한 정확하게 미래를 예측할 수 있습니다. 다른 유사한 제품과 비교했을 때, MetaForecast는 시장 동향을 분석하여 더 정확한 결과를 생성할 수 있습니다. 입력 매개변수 Past size (과거 크기) MetaForecast가 미래 예측을 생성하기 위한 모델을 만드는 데 사용하는 막대의 수를 지정합니다. 모델은 선택한 막대 위에 그려진 노란색 선으로 표시됩니다. Future size (미래 크기) 예측해야 할 미래 막대의 수를 지정합니다. 예측된 미래는 핑크색 선으로 표시되며 그 위에 파란색 회귀선이 그려집니다. Degree (차수) 이 입력은 MetaForecast가 시장에서 수행할 분석 수준을 결정합니다. Degree 설명  0 차수 0의 경우, "Past size" 입력에 모든 봉우리
FX Volume MT5
Daniel Stein
4.93 (14)
모닝 브리핑을 통해 세부 정보와 스크린샷으로 매일 시장 업데이트를 받으세요 여기 mql5 및 텔레그램에서 FX 거래량은 브로커의 관점에서 시장 심리에 대한 실제 통찰력을 제공하는 최초이자 유일한 거래량 지표입니다. 브로커와 같은 기관 시장 참여자가 외환 시장에서 어떤 포지션을 취하고 있는지에 대한 훌륭한 통찰력을 COT 보고서보다 훨씬 빠르게 제공합니다. 차트에서 이 정보를 직접 확인하는 것은 트레이딩의 진정한 판도를 바꾸고 획기적인 솔루션입니다. 다음과 같은 고유한 시장 데이터 인사이트의 이점 비율 는 통화의 매수/매도 포지션 비율을 백분율로 표시 비율 변화 는 선택한 기간 내 매수 비율과 비율 변화를 표시 총 거래량 는 해당 통화의 총 거래량(롱 및 숏)을 로트 단위로 보여줍니다 Volumes Long 는 해당 통화의 모든 롱 포지션의 거래량을 보여줍니다 Volumes Short 는 해당 통화의 모든 숏 포지션의 거래량을 보여줍니다 Net Long 는 순 롱 포지션의 거래량
우선적으로, 이 거래 도구는 전문적인 거래에 이상적인 비-다시 그리기 및 지연되지 않는 지표입니다.  온라인 강좌, 사용자 매뉴얼 및 데모. 스마트 가격 액션 컨셉트 인디케이터는 신규 및 경험 많은 트레이더 모두에게 매우 강력한 도구입니다. Inner Circle Trader Analysis 및 Smart Money Concepts Trading Strategies와 같은 고급 거래 아이디어를 결합하여 20가지 이상의 유용한 지표를 하나로 결합합니다. 이 인디케이터는 스마트 머니 컨셉트에 중점을 두어 대형 기관의 거래 방식을 제공하고 이동을 예측하는 데 도움을 줍니다.  특히 유동성 분석에 뛰어나 기관이 어떻게 거래하는지 이해하는 데 도움을 줍니다. 시장 트렌드를 예측하고 가격 변동을 신중하게 분석하는 데 탁월합니다. 귀하의 거래를 기관 전략에 맞추어 시장의 동향에 대해 더 정확한 예측을 할 수 있습니다. 이 인디케이터는 시장 구조를 분석하고 중요한 주문 블록을 식별하
Quantum Trend Sniper
Bogdan Ion Puscasu
4.79 (48)
소개       Quantum Trend Sniper Indicator는   추세 반전을 식별하고 거래하는 방식을 변화시키는 획기적인 MQL5 지표입니다! 13년 이상의 거래 경험을 가진 숙련된 트레이더 팀이 개발한       Quantum Trend Sniper 표시기       매우 높은 정확도로 추세 반전을 식별하는 혁신적인 방법으로 거래 여정을 새로운 차원으로 끌어올리도록 설계되었습니다. ***Quantum Trend Sniper Indicator를 구입하면 Quantum Breakout Indicator를 무료로 받을 수 있습니다!*** Quantum Trend Sniper Indicator는 추세 반전을 식별하고 세 가지 이익실현 수준을 제안할 때 경고, 신호 화살표를 제공합니다. 초보자 거래자와 전문 거래자 모두에게 적합합니다. Quantum EA 채널:       여기를 클릭하세요 MT4 버전:       여기를 클릭하세요
PZ Divergence Trading MT5
PZ TRADING SLU
4 (5)
Unlock hidden profits: accurate divergence trading for all markets Special Offer: Purchase now to receive free bonuses worth $90! (Read more for details) Tricky to find and scarce in frequency, divergences are one of the most reliable trading scenarios. This indicator finds and scans for regular and hidden divergences automatically using your favourite oscillator. [ Installation Guide | Update Guide | Troubleshooting | FAQ | All Products ] Easy to trade Finds regular and hidden divergences S
Auto Order Block with break of structure based on ICT and Smart Money Concepts (SMC) Futures Break of Structure ( BoS )             Order block ( OB )            Higher time frame Order block / Point of Interest ( POI )    shown on current chart           Fair value Gap ( FVG ) / Imbalance   -  MTF      ( Multi Time Frame )    HH/LL/HL/LH  -  MTF      ( Multi Time Frame )  Choch  MTF      ( Multi Time Frame )  Volume Imbalance     ,  MTF          vIMB Gap’s Power of 3 Equal High
The 1 2 3 Pattern Scanner MT5
Reza Aghajanpour
5 (15)
** All Symbols x All Timeframes scan just by pressing scanner button ** *** Contact me  to send you instruction and add you in "123 scanner group" for sharing or seeing experiences with other users. After 17 years of experience in the markets and programming, Winner indicator is ready. I would like to share with you! Introduction The 123 Pattern Scanner indicator with a special enhanced algorithm is a very repetitive common pattern finder with a high success rate . Interestingly, this Winner in
RelicusRoad Pro MT5
Relicus LLC
5 (17)
이제 $ 147 (몇 가지 업데이트 후 $ 499 증가) - 무제한 계정 (PCS 또는 MACS) RelicusRoad 사용 설명서 + 교육 비디오 + 비공개 Discord 그룹 액세스 + VIP 상태 시장을 보는 새로운 방법 RelicusRoad는 외환, 선물, 암호화폐, 주식 및 지수에 대한 세계에서 가장 강력한 거래 지표로서 거래자에게 수익성을 유지하는 데 필요한 모든 정보와 도구를 제공합니다. 우리는 초보자부터 고급까지 모든 거래자가 성공할 수 있도록 기술적 분석 및 거래 계획을 제공합니다. 미래 시장을 예측할 수 있는 충분한 정보를 제공하는 핵심 거래 지표입니다. 우리는 차트에서 말이 안 되는 여러 지표 대신 완전한 솔루션을 믿습니다. 타의 추종을 불허하는 매우 정확한 신호, 화살표 + 가격 조치 정보를 표시하는 올인원 표시기입니다. 강력한 AI를 기반으로 하는 RelicusRoad는 누락된 정보와 도구를 제공하여 교육하고 성공적인 트레이더인 트레이딩 전문
AW Trend Predictor MT5
AW Trading Software Limited
4.75 (51)
하나의 시스템에서 추세와 고장 수준의 조합입니다. 고급 지표 알고리즘은 시장 노이즈를 필터링하고 추세, 진입점 및 가능한 출구 수준을 결정합니다. 표시기 신호는 통계 모듈에 기록되어 가장 적합한 도구를 선택하여 신호 기록의 효율성을 보여줍니다. 이 표시기는 이익 실현 및 손절매 표시를 계산합니다. 매뉴얼 및 지침 ->   HERE   / MT4 버전 ->   HERE 지표로 거래하는 방법: Trend Predictor로 거래하는 것은 3단계로 간단합니다. 1단계 - 포지션 열기 70% 이상의 성공률로 매수 신호를 받았습니다. 2단계 - StopLoss 결정 반대 신호로 트렁크 선택 3단계 - 이익 실현 전략 정의 전략 1: TP1 도달 시 전체 포지션 청산 전략 2: TP1 도달 시 포지션의 50% 청산 및 TP2 도달 시 나머지 50% 청산 전략 3: 추세 반전 시 전체 포지션 청산 이익: 결과를 다시 그리지 않음, 신호는 엄격하게 양초가 닫힐 때 어드바이저에서 사용할 수 있습니
Easy Buy Sell Signal Alert
Franck Martin
4.33 (6)
Easy By Sell is a market indicator for opening and closing positions. It becomes easy to track market entries with alerts. It indicates trend reversal points when a price reaches extreme values ​​and the most favorable time to enter the market. it is as effective as a Fibonacci to find a level but it uses different tools such as an algorithm based on ATR indicators and Stochastic Oscillator. You can modify these two parameters as you wish to adapt the settings to the desired period. My othe
이 대시보드는 선택한 심볼에 대해 사용 가능한 최신 고조파 패턴을 표시하므로 시간을 절약하고 더 효율적으로 사용할 수 있습니다 /   MT4 버전 . 무료 인디케이터:   Basic Harmonic Pattern 인디케이터 열 Symbol :   선택한 심볼이 나타납니다 Trend :   강세 또는 약세 Pattern :   패턴 유형(가틀리, 나비, 박쥐, 게, 상어, 사이퍼 또는 ABCD) Entry :   진입 가격 SL:   스톱로스 가격 TP1:   1차 테이크프로핏 가격 TP2:   2차 테이크프로핏 가격 TP3:   3차 테이크프로핏 가격 Current price:   현재 가격 Age (in bars):   마지막으로 그려진 패턴의 나이 주요 입력 Symbols :   "28개 주요 통화쌍" 또는 "선택한 심볼" 중에서 선택합니다. Selected Symbols :   쉼표로 구분하여 모니터링하려는 원하는 심볼("EURUSD,GBPUSD,XAUUSD")
TPA True Price Action indicator reveals the true price action of the market makers through 100% non-repainting signals strictly at the close of a candle! TPA shows entries and re-entries, every time the bulls are definitely stronger than the bears and vice versa. Not to confuse with red/green candles. The shift of power gets confirmed at the earliest stage and is ONE exit strategy of several. There are available now two free parts of the TPA User Guide for our customers. The first "The Basics"
Blahtech Market Profile MT5
Blahtech Limited
5 (8)
Was: $249  Now: $99   Market Profile defines a number of day types that can help the trader to determine market behaviour. A key feature is the Value Area, representing the range of price action where 70% of trading took place. Understanding the Value Area can give traders valuable insight into market direction and establish the higher odds trade. It is an excellent addition to any system you may be using. Inspired by Jim Dalton’s book “Mind Over Markets”, this indicator is designed to suit the
ICT, SMC, SMART MONEY CONCEPTS, SMART MONEY, Smart Money Concept, Support and Resistance, Trend Analysis, Price Action, Market Structure, Order Blocks, BOS/CHoCH,   Breaker Blocks ,  Momentum Shift,   Supply&Demand Zone/Order Blocks , Strong Imbalance,   HH/LL/HL/LH,    Fair Value Gap, FVG,  Premium  &   Discount   Zones, Fibonacci Retracement, OTE, Buy Side Liquidity, Sell Side Liquidity, BSL/SSL Taken, Equal Highs & Lows, MTF Dashboard, Multiple Time Frame, BigBar, HTF OB, HTF Market Structure
Matrix Arrow Indicator MT5
Juvenille Emperor Limited
5 (12)
매트릭스 화살표 표시기 MT5 는 외환, 상품, 암호 화폐, 지수, 주식과 같은 모든 기호/도구에 사용할 수 있는 100% 다시 칠하지 않는 다중 기간 표시기를 따르는 고유한 10 in 1 추세입니다.  Matrix Arrow Indicator MT5 는 다음과 같은 최대 10개의 표준 지표에서 정보와 데이터를 수집하여 초기 단계에서 현재 추세를 결정합니다. 평균 방향 이동 지수(ADX) 상품 채널 지수(CCI) 클래식 하이켄 아시 캔들 이동 평균 이동 평균 수렴 발산(MACD) 상대 활력 지수(RVI) 상대 강도 지수(RSI) 포물선 SAR 스토캐스틱 오실레이터 윌리엄스의 백분율 범위 모든 지표가 유효한 매수 또는 매도 신호를 제공하면 강력한 상승/하락 추세를 나타내는 다음 캔들/막대가 시작될 때 해당 화살표가 차트에 인쇄됩니다. 사용자는 사용할 표시기를 선택하고 각 표시기의 매개변수를 개별적으로 조정할 수 있습니다. 매트릭스 화살표 표시기 MT5는 선택한 표시기에서만 정보를 수
금 TMAF MTF - 최고의 주식 기술 지표입니다. 지표 알고리즘은 자산의 가격 움직임을 분석하고 변동성과 잠재적 진입 구간을 반영합니다. 최고의 지표 신호입니다: - 매도 = TMA1의 빨간색 상한선 위의 TMA2의 빨간색 상한선 + 위의 빨간색 프랙탈 인디케이터 + 같은 방향의 노란색 SR 신호 화살표. - 매수 = TMA2의 파란색 하한선 아래 TMA1의 파란색 하한선 + 아래에서 파란색 프랙탈 표시기 + 같은 방향의 아쿠아 SR 신호 화살표. 인디케이터의 장점 1. 이 인디케이터는 높은 정확도로 신호를 생성합니다. 2. 확인 된 화살표 신호는 다시 그려지지 않으며 프랙탈 신호는 절반 기간 동안 다시 그릴 수 있습니다. 3. 모든 브로커의 메타트레이더 5 거래 플랫폼에서 거래할 수 있습니다. 4. 모든 자산(통화, 금속, 암호화폐, 주식, 지수 등)을 거래할 수 있습니다. 5. M30-H1 차트주기(중기 트레이딩)에서 거래하는 것이 좋습니다. 6
Golden Spikes Premium
Kwaku Bondzie Ghartey
Golden Spikes Detector Acknowledgement and Dedications:  The name of this indicator was Inspired by an Original; Mr Grant Koopman; a Knowledgeable and experienced Synthetics trader. I dedicate this indicator to Mr Grant.  Overview: The Golden Spikes Premium is a groundbreaking trading indicator meticulously crafted for the Boom and Crash indices on the Deriv market. Tailored to meet the needs of discerning traders, this powerful tool operates exclusively on the one-minute timeframe, providin
Dark Absolute Trend   is an Indicator for intraday trading. This Indicator is based on   Trend Following  strategy but use also candlestick patterns and Volatility. We can enter in good price with this Indicator, in order to follow the main trend on the current instrument. It is advised to use low spread ECN brokers. This Indicator does   Not repaint   and   N ot lag . Recommended timeframes are M5, M15 and H1. Recommended working pairs: All. I nstallation and  Update Guide   -  Troubleshooting
Support And Resistance Screener는 하나의 지표 안에 여러 도구를 제공하는 MetaTrader에 대한 하나의 레벨 지표입니다. 사용 가능한 도구는 다음과 같습니다. 1. 시장 구조 스크리너. 2. 완고한 후퇴 영역. 3. 약세 후퇴 영역. 4. 일일 피벗 포인트 5. 주간 피벗 포인트 6. 월간 피벗 포인트 7. 고조파 패턴과 볼륨에 기반한 강력한 지지와 저항. 8. 은행 수준 구역. LIMITED TIME OFFER : HV 지원 및 저항 표시기는 50 $ 및 평생 동안만 사용할 수 있습니다. ( 원래 가격 125$ ) MQL5 블로그에 액세스하면 분석 예제와 함께 모든 프리미엄 지표를 찾을 수 있습니다. 여기를 클릭하십시오. 주요 특징들 고조파 및 볼륨 알고리즘을 기반으로 하는 강력한 지원 및 저항 영역. Harmonic 및 Volume 알고리즘을 기반으로 한 강세 및 약세 풀백 영역. 시장 구조 스크리너 일간, 주간 및 월간 피벗 포인트. 실제
제작자의 제품 더 보기
Follow Line 지표는 시장 트렌드를 정확하게 식별하고 따라가는 트레이더에게 필수적인 도구입니다. 이 지표는 가격 변동에 따라 동적으로 조정되며, 가격 움직임을 매끄럽고 지속적으로 추적하는 선을 그립니다. 시각적으로 단순하고 트렌드 변화를 신호하는 데 효과적인 Follow Line은 모든 트레이더의 전략에 훌륭한 추가 요소가 됩니다. 주요 특징: 트렌드 추적: Follow Line은 가격을 면밀히 추적하여 트레이더가 진행 중인 시장 트렌드를 쉽게 식별할 수 있도록 합니다. 시각적 단순성: 명확하고 잘 정의된 선으로, 경험이 적은 트레이더도 시장 방향을 빠르게 이해할 수 있습니다. 적응성: 다양한 시간대와 도구에서 작동하여, 데이 트레이딩에서 스윙 트레이딩까지 다양한 거래 전략에 이상적입니다. 사용 방법: 설치: 분석하려는 금융 상품의 차트에 Follow Line 지표를 추가합니다. 설정: 거래 전략에 맞게 지표의 매개변수를 조정합니다. 트렌드 분석: Follow Line 선을
MetaTrader 5 무료 스프레드 지표 이 지표는 MetaTrader 5에서 스프레드에 대한 자세한 분석을 제공합니다. 스프레드는 자산의 매수 가격(Ask)과 매도 가격(Bid) 간의 차이를 나타내므로, 트레이더에게 중요한 매개변수 중 하나입니다. 지표에는 다음이 포함됩니다: 평균 스프레드 : 당일 관찰된 최고 스프레드와 최저 스프레드 간의 평균으로 계산됩니다. 현재 스프레드 : 현재 시장 스프레드를 표시합니다. 최저 스프레드 : 당일 기록된 최저 스프레드 값을 보여줍니다. 최대 스프레드 : 당일 기록된 최대 스프레드 값을 보여줍니다. 이 지표는 시장 상황에 대한 명확하고 즉각적인 뷰를 제공하도록 설계되었으며, 트레이더가 거래 비용을 보다 잘 평가하고 전략에 영향을 미칠 수 있는 스프레드 변동을 식별할 수 있도록 도와줍니다. 제 제품에 관심이 있으시면 다음 페이지를 방문해 보세요: 전문가 자문 : https://www.mql5.com/it/market/product/119456?
FREE
FREE Spread indicator for MetaTrader 4 this indicator includes: -average spread -current spread -minimum spread -maximum spread If you are interested in my products I recommend you visit my page where you can find: Experts Advisors:  https://www.mql5.com/it/market/product/119456?source=Site+Profile indicators:  https://www.mql5.com/it/market/product/120038?source=Site+Profile I hope the spread indicator will be useful to you. https://www.mql5.com/it/users/kappa05
FREE
Enhance Your Trading Strategies with the "Order Block" Indicator for MT4 Discover the "Order Block" Indicator: The "Order Block" Indicator for MT4 is designed to help you precisely identify order blocks in the market by marking the highs and lows of the order block candles. This powerful tool enables you to understand where large institutions place their orders, improving your ability to predict market movements. Key Features: Precise Order Block Detection: Automatically highlights the highs and
IMPORTANT: The indicator will remain at the price of $34.90 until the release of the update scheduled for July 16, 2024. The New Price will be $49.90 (taxes excluded) FVG indicator. If you are an SMC trader this indicator will be very useful to you, it automatically identifies the FVGs on the graph distinguishing them into 2 types: bearish FVGs and bullish FVGs (see the photos to understand better). This indicator works on any Timeframe and on any market you want to use it. If you are interested
Volume Profile Indicator for MT4 Gain a trading edge with the "Volume Profile" indicator for MetaTrader 4 (MT4). This advanced technical analysis tool allows you to precisely identify key support and resistance levels based on transaction volume. Easily visualize market areas of high interest, where trading volumes are highest, and use this information to make more informed trading decisions. Key Features: Clear and detailed visualization : The indicator displays volume histograms directly on th
Presentation of the "Color Range Indicator" The "Color Range Indicator" is a powerful technical analysis tool designed for the MT4 platform, perfect for traders who want a clear and immediate view of market trends. This indicator draws a colored line based on the current trend, making it easier to interpret price movements. Indicator Description: Green line : Indicates an uptrend. Use this signal to consider buying opportunities. Red line : Indicates a downtrend. Use this signal to consider sell
"Real Time MultiIndicator"란 무엇인가요? "Real Time MultiIndicator"는 기술 분석을 단순화하고 최적화하기 위해 설계된 고급 거래 도구입니다. 이 혁신적인 지표는 여러 시간 프레임과 기술 지표에서 신호를 수집하여 하나의 명확하고 읽기 쉬운 표로 표시합니다. 차트를 계속 변경하거나 각 지표를 수동으로 분석하지 않고도 시장에 대한 전체적이고 상세한 통찰을 원하신다면, "Real Time MultiIndicator"가 최적의 솔루션입니다. 왜 "Real Time MultiIndicator"를 선택해야 하나요? 다중 시간 프레임 분석: "Real Time MultiIndicator"는 다양한 시간 프레임에서 시장을 동시에 모니터링할 수 있게 해줍니다. M15에서 H4까지, 이 지표는 각 시간 프레임에서 추세가 상승 중인지 하락 중인지를 명확하게 보여주어 시장의 전체적인 모습을 바탕으로 정보를 기반으로 한 결정을 내릴 수 있도록 도와줍니다. 다양한 지표
9월 1일 일요일까지 77.90달러에서 37.90달러로 할인 "Forex Scanner"란 무엇입니까? "Forex Scanner"는 실시간으로 외환 시장에 대한 포괄적인 개요를 제공하도록 설계된 강력한 거래 도구입니다. 이 고급 지표는 여러 기술 지표와 시간 프레임에서 주요 데이터를 수집하여 거래 기회를 신속하게 식별할 수 있게 해줍니다. 여러 자산과 매개변수를 모니터링하면서 차트를 변경하지 않고자 한다면 "Forex Scanner"는 완벽한 솔루션입니다. "Forex Scanner"를 선택해야 하는 이유는 무엇입니까? 다중 시간대 스캔: "Forex Scanner"는 분 단위에서 시간 단위까지 다양한 시간대에서 시장을 모니터링할 수 있게 해줍니다. 이 도구는 여러 시간 레벨에서 추세 및 거래 신호를 즉시 식별할 수 있도록 도와주며, 완전하고 상세한 시장 뷰에 따라 조치를 취할 수 있게 해줍니다. 다중 지표 통합: 이 지표는 ATR, RSI, 스토캐스틱, ADX, 피벗 및 MA와
Enhanced RSI는 트레이더에게 더 포괄적이고 정확한 시장 분석을 제공하기 위해 설계된 다재다능하고 맞춤화 가능한 기술 지표입니다. 이동 평균, RSI 및 MACD의 최고의 기능을 결합하여 이 지표는 모멘텀과 트렌드 강도에 대한 다차원적 관점을 제공합니다. 주요 특징: 완벽한 하이브리드화: Enhanced RSI는 이동 평균, RSI 및 MACD의 기능을 결합하여 가격 움직임에 대한 보다 완전한 그림을 제공합니다. 최대 유연성: 맞춤화 가능한 기간을 통해 이 지표는 모든 거래 스타일과 시간 프레임에 적응합니다. 다양한 활용: Forex부터 암호화폐, 주식, 지수에 이르기까지 모든 금융 자산에 대해 작동합니다. 분석 지원: Enhanced RSI는 자동 거래 시스템이 아니라 유용한 신호와 확인을 제공하여 기술 분석을 보완하는 도구입니다. 작동 방식: Enhanced RSI는 RSI의 지수 이동 평균을 계산하고 이를 MACD에서 나온 신호와 결합합니다. 그 결과는 과매수 및 과매도
OB Indicator
Nicola Capatti
Order Block indicator, highs and lows; the indicator focuses mainly on OBs, on the chart they are represented with a horizontal line on the minimum and maximum of that candle. While for the maximums and minimums only one line is marked (see the images to understand better). The indicator is for MT5, it works on all Timeframes, on any Forex Pair, on any index and on crypto markets. (For any information on the indicator do not hesitate to contact me). Limited time discount (50%) 74.90$ -> 38.60$
Expert Advisor for scalping; This EA was built for monthly profitability. Works on any asset: Forex, Indices, Crypto and Stocks. Perfectly usable in MT5 tester and usable on any TimeFrame. The EA has various inputs available to customize operations: -Lots -Risk% (0 = Fix) -OrderDist (the distance between one order and another, the distance is calculated in points not pips) -TP (in points) -Sl (in points) -TrailingStopTrigger(the trailing stop trigger point in points) -TrailingStop(distance from
Highs, Lows and Bos Indicator for MT5; The indicator works on any type of market and on all TimeFrames. It also works on the MetaTrader5 Tester. the main function of the indicator is to identify the highs and lows by marking them with a point above/below the candle, then with a horizontal line it marks the Bos. It is very simple and intuitive, there are only 2 inputs: -the color of the maximums -the color of the minima For any other information do not hesitate to contact me.
Panel Info Trade For MT5; The indicator has 2 main objects: -An icon chart that you can change Timeframe, zoom, Forex Pair, crypto....the position of the graph can be modified via the (x;y) inputs. The chart is perfectly usable in the MT5 tester. If the graph isn't for you and doesn't help you with anything, you can press the button on the top right to make it smaller. -the second object is a dynamic control panel where you can change plots, place sl and tp, BE, close partial... (if you watch th
통화 강도 지수 (Currency Strength Index - CSI) 지표 지표를 활성화하기 전에 "TRUE"로 설정하여 페어를 표시하도록 하십시오 통화 강도 지수 (Currency Strength Index - CSI) 지표는 주요 통화의 상대 강도를 측정하는 데 사용되는 강력한 도구입니다. 이 지표는 거래자가 특정 시점에서 가장 강한 통화와 가장 약한 통화를 식별하는 데 도움을 주어 더 정보에 기반한 거래 결정을 내릴 수 있게 합니다. 주요 특징: 비교 분석: 역사적 및 현재 데이터를 기반으로 다양한 통화의 강도를 비교합니다. 거래 신호: 상대적인 강도를 기준으로 최적의 통화 쌍을 식별하는 데 도움이 됩니다. 사용자 정의: 사용자는 계산 기간 및 기타 매개변수를 구성하여 자신의 거래 전략에 맞출 수 있습니다. 직관적인 시각화: 정보를 명확하고 시각적으로 제시하여 데이터 해석을 용이하게 합니다. 사용 방법: 설치: 원하는 통화 쌍의 차트에 CSI 지표를 추가하십시오. 설정: 계
In the world of trading, the key to success lies in having the right tools at the right time. Our innovative Volume Profile indicator was developed with one goal in mind: to provide traders with unprecedented access to vital market activity information. This cutting-edge tool allows you to not only see where and when volumes are traded but also to understand market depth with clarity never seen before. Main Features: Temporal Flexibility: Set the analysis range up to 1800 minutes to perfectly ma
Maximize Your Trading Opportunities with the "Auto Trendlines" Indicator Discover the "Auto Trendlines" Indicator: "Auto Trendlines" is the essential tool for every technical trader. This indicator automatically plots trend lines, pinpointing support and resistance levels with surgical precision. It's ideal for those looking to capitalize on market breakouts and reversals. Key Features: Automatic Trendline Plotting: Identifies and draws crucial trend lines without manual intervention. Advanced C
AutoFibo for MT5
Nicola Capatti
Optimize Your Trading Decisions with the "autoFibo" Indicator Discover the "autoFibo" Indicator: "autoFibo" is the essential analysis tool for traders who want to fully leverage Fibonacci levels without the hassle of manual plotting. This indicator automates the Fibonacci retracement process, providing instant visual access to key support and resistance zones. Key Features: Automatic Fibonacci Retracement: Automatically plots Fibonacci levels, making it easy to identify support and resistance zo
Enhance Your Trading Performance with the "Better Volume" Indicator Discover the "Better Volume" Indicator: The "Better Volume" is the essential market volume analysis tool for traders aiming to stand out. It analyzes tick volumes with unprecedented accuracy, featuring an advanced moving average function (PERIOD_MA) and customizable buy and sell alerts. Key Features: Advanced Volume Analysis: Recognize volume peaks signaling crucial price movements. Intuitive Buy and Sell Alerts: Stay one step a
SuperTrend 는 트렌드 방향을 식별하고 진입 및 종료 신호를 생성하기 위해 거래에서 가장 효과적이고 널리 사용되는 기술 지표 중 하나입니다. 변동성과 트렌드를 기반으로 하는 이 지표는 시장 상황에 동적으로 적응하여 트레이더에게 명확한 시각적 참고 자료를 제공합니다. 주요 특징: 트렌드 탐지: SuperTrend는 시장 트렌드를 따라가며 하락 트렌드에서는 가격 위에, 상승 트렌드에서는 가격 아래에 선을 그립니다. 사용 용이성: 직관적인 그래픽 표현 덕분에 경험이 적은 트레이더도 쉽게 해석할 수 있습니다. 진입/종료 신호: 가격이 SuperTrend 라인을 위로 교차할 때 매수 신호를 생성하고 아래로 교차할 때 매도 신호를 생성합니다. 적응성: 다양한 시간 프레임과 도구에서 작동하여 일간 거래부터 스윙 거래에 이르기까지 다양한 거래 스타일에 맞게 다재다능합니다. 사용 방법: 설치: 분석하려는 금융 상품의 차트에 SuperTrend를 추가합니다. 설정: 거래 전략에 맞게 주기 및
새로운 통합 지표 - 3 in 1 시장 분석과 투자 전략을 향상시킬 거래 도구를 찾고 계십니까? 저희는 최고의 지표 세 가지를 강력하고 편리한 하나의 솔루션으로 결합하여, 거래에서 최고의 가치를 얻을 수 있도록 했습니다. 1. 오더 블록 지표 (이전에 32.90$에 판매됨) 오더 블록 지표는 시장에서 중요한 기관의 관심 영역을 식별하는 데 필수적인 도구입니다. 이 지표는 오더 블록 캔들의 고점과 저점을 표시하며, 이는 가격 반전이나 추세 지속이 발생할 수 있는 중요한 영역을 나타냅니다. 단독으로 사용될 때, 오더 블록 지표는 잠재적인 지지 및 저항 영역을 식별하여 더 나은 거래 결정을 내릴 수 있도록 도와줍니다. 링크: https://www.mql5.com/it/market/product/121633?source=Site+Market+MT5+Search+Rating006%3aorderblock+indicator 2. FVG 지표 (이전에 34.90$에 판매됨) FVG 지표는 공정 가
FVG for MT5
Nicola Capatti
"Fair Value Gap" (FVG) 인디케이터 - 시장 불균형의 힘을 발견하세요 트레이딩 세계는 숨겨진 기회로 가득 차 있지만, 적절한 도구를 가진 사람만이 이를 효과적으로 식별하고 활용할 수 있습니다. 우리의 FVG 인디케이터 는 이를 돕기 위해 설계되었습니다. 시장을 읽는 능력을 향상시키고 최적의 진입 및 퇴출 포인트를 찾고자 하는 트레이더에게 FVG 인디케이터는 완벽한 동반자입니다. Fair Value Gap (FVG)이란 무엇인가요? Fair Value Gap의 개념은 가격 차트에 "갭"을 생성하는 공급과 수요 사이의 불균형을 나타냅니다. 이 갭은 가격이 이 불균형을 채우기 위해 다시 돌아올 수 있는 영역을 나타내며, 이 영역은 잠재적으로 가치 있는 트레이딩 기회입니다. 이러한 갭은 가격이 급격히 움직일 때 발생하며, 향후 시장 행동을 이해하는 열쇠가 될 수 있습니다. 왜 FVG 인디케이터가 중요한가요? FVG 인디케이터는 차트에서 이 불균형 영역을 쉽게 식별하고 가격이
"Schaff RSX"란 무엇입니까? "Schaff RSX"는 상대 강도 지수(RSX)의 효율성을 Schaff 사이클의 정밀성과 결합하여 시장에 진입하고 퇴출할 최고의 순간을 쉽게 식별할 수 있는 독특한 지표를 만듭니다. 이는 숨겨진 거래 기회를 감지하는 레이더를 보유하는 것과 같으며, 다른 트레이더가 무시할 수 없는 경쟁 우위를 제공합니다. 왜 "Schaff RSX"를 선택해야 합니까? 명확하고 직관적인 시각적 단순성 : "Schaff RSX"의 색상과 라인은 시장이 과매수 또는 과매도 상태에 있을 때를 명확하게 보여줍니다. 더 이상 직관이나 운에 의존할 필요가 없습니다. 정확하고 신뢰할 수 있는 정보가 바로 앞에 있습니다. 완벽하게 사용자 정의 가능 : 각 트레이더는 자신의 전략을 가지고 있으며, "Schaff RSX"는 귀하의 전략에 완벽하게 적응합니다. 원하는 결과를 정확하게 얻기 위해 매개변수를 원하는 대로 구성할 수 있습니다. 모든 거래 스타일에 적합 : 귀하가 데이 트레
MetaTrader 5용 **"Positions Manager"**는 포지션 관리를 효율적이고 자동화된 방식으로 최적화하려는 트레이더에게 필수적인 도구입니다. 이 고급 도구는 트레이더가 자신의 작업을 제어하고 위험 관리를 개선하며 Break Even 및 Trailing Stop과 같은 기능을 통해 잠재적인 수익을 극대화할 수 있도록 설계되었습니다. 주요 기능: 자동 Break Even: Break Even을 활성화하는 옵션을 통해 "Positions Manager"는 시장이 트레이더에게 유리하게 움직일 때 이익을 보호할 수 있습니다. 활성화를 위한 핍(pip) 거리를 설정하고 수수료를 충당하기 위한 추가 핍을 추가할 수 있습니다. 동적 Trailing Stop: Trailing Stop을 활성화하여 시장 움직임을 추적하고 수익을 보호하십시오. 이 기능은 가격 움직임에 따라 자동으로 조정되어 시장이 유리한 한 포지션을 유지하고 트렌드가 반전될 때 자동으로 포지션을 종료할 수 있습니다.
필터:
리뷰 없음
리뷰 답변