Forex Stock Indices Volatility by TimeFrame
- 유틸리티
- Jairzino Rivelino Williams
- 버전: 1.0
- 활성화: 5
Maximize Trading Insights with the Stock Indices Candle Gap Volatility Tool 🌍📊
Elevate your trading strategy with the Stock Indices Candle Gap Volatility Tool, designed for traders who demand precise and comprehensive analysis of candle gaps across major global stock indices. Whether you're trading stocks, indices, or forex, this tool provides the critical data needed for informed decision-making.
Key Features:
-
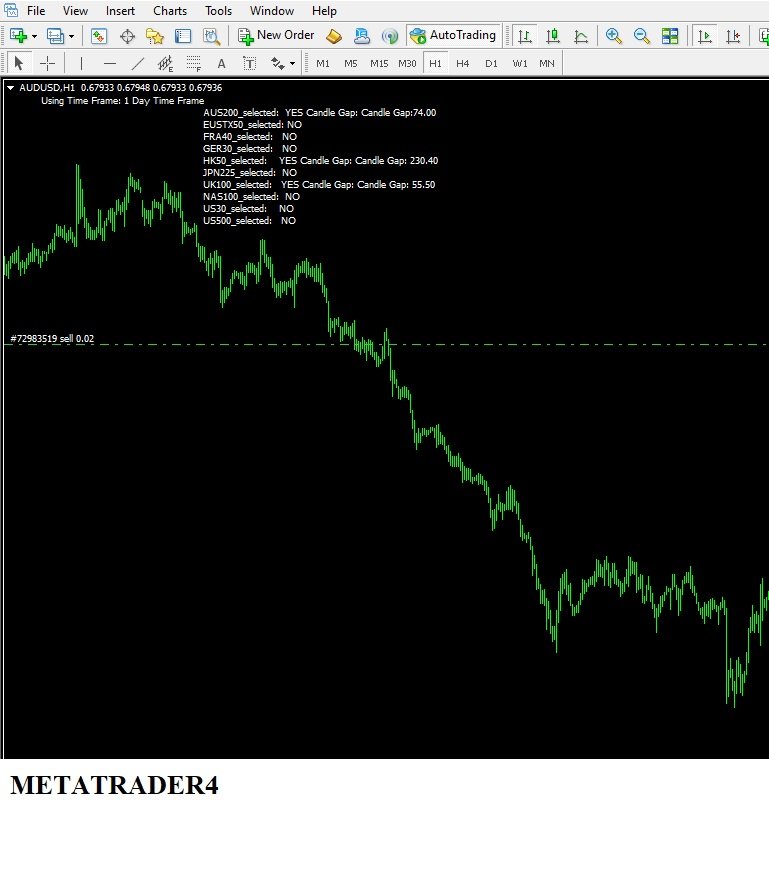
Candle Gap Analysis: Automatically display the high-low (Hi-Lo) gaps on your chart for any selected timeframe, giving you a clear view of market volatility.
-
Wide Range of Timeframes: Analyze candle gaps over multiple timeframes, providing flexibility and control over your trading strategy.
-
Global Index Coverage: Gain insights into 10 major stock indices, including:
- EUSTX50 (Euro Stoxx 50)
- FRA40 (French 40 Index)
- GER30 (DAX 30 Index)
- HK50 (Hong Kong 50 Index)
- JPN225 (Nikkei 225)
- UK100 (FTSE 100)
- NAS100 (Nasdaq 100 Index)
- US30 (Dow Jones)
- US500 (S&P 500)
- AUS200 (Australian Stocks on ASX)
-
User-Friendly Interface: Easily select the indices and timeframes you wish to analyze, with results displayed directly on your trading chart.
-
Real-Time Data: Receive live updates on candle gaps, ensuring you're always in sync with market movements.
Unlock a deeper understanding of market dynamics with the Stock Indices Candle Gap Volatility Tool—the perfect companion for traders looking to enhance their technical analysis and make more informed trades.