• 미리보기
  • 리뷰
  • 코멘트

System X

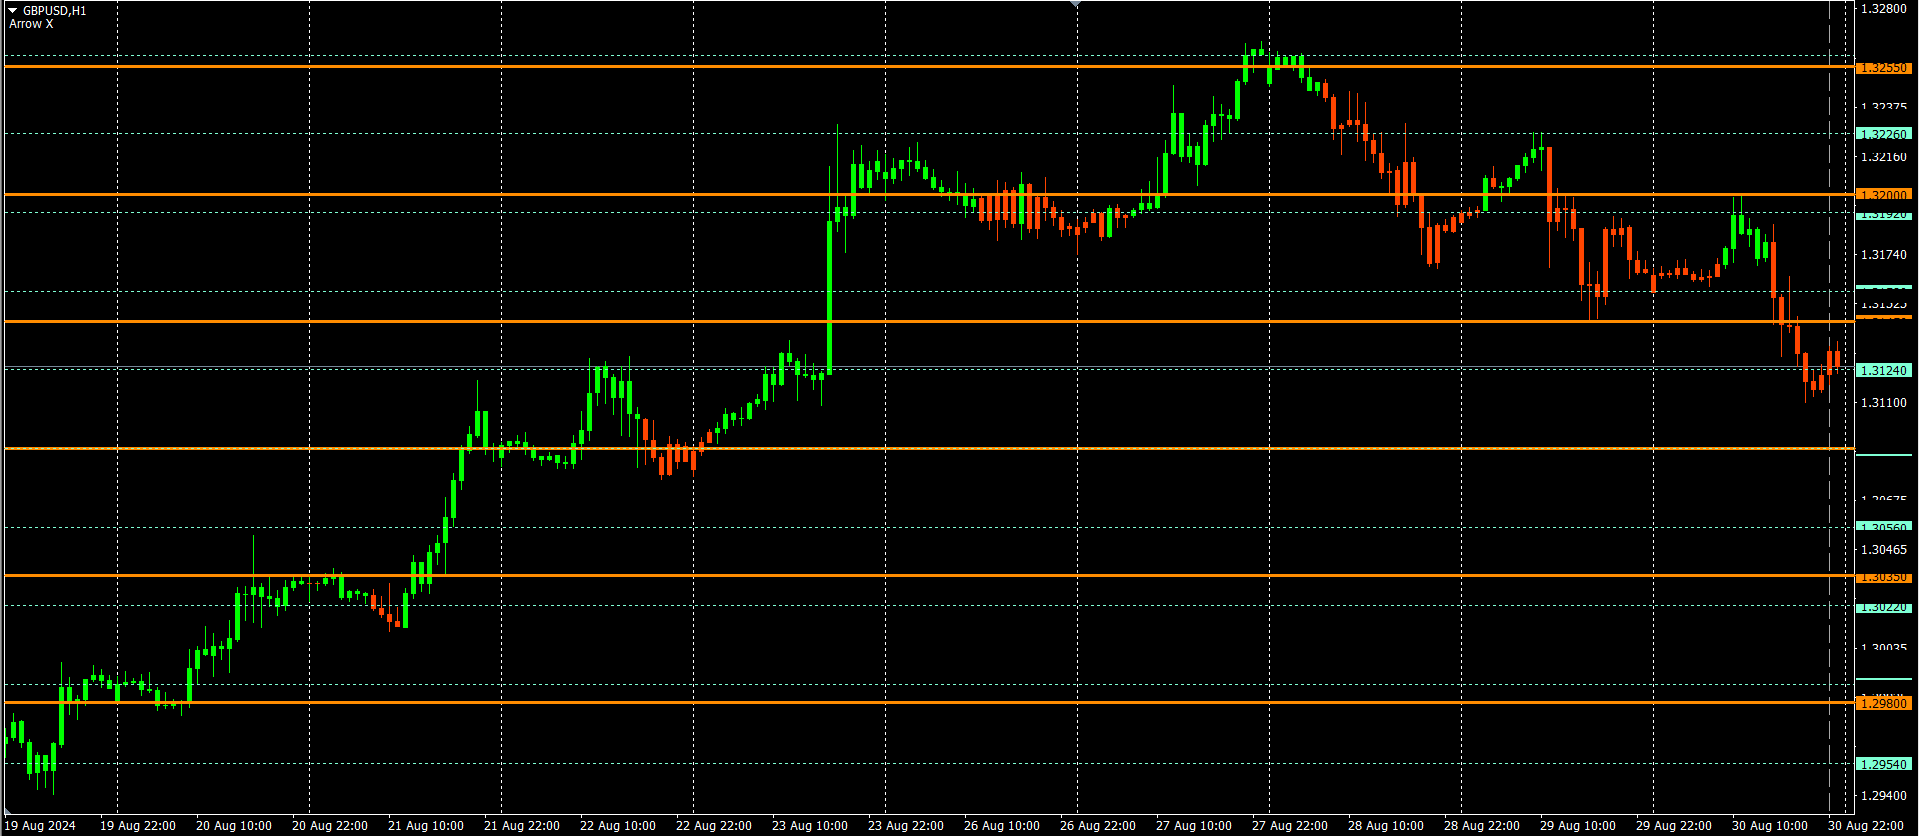
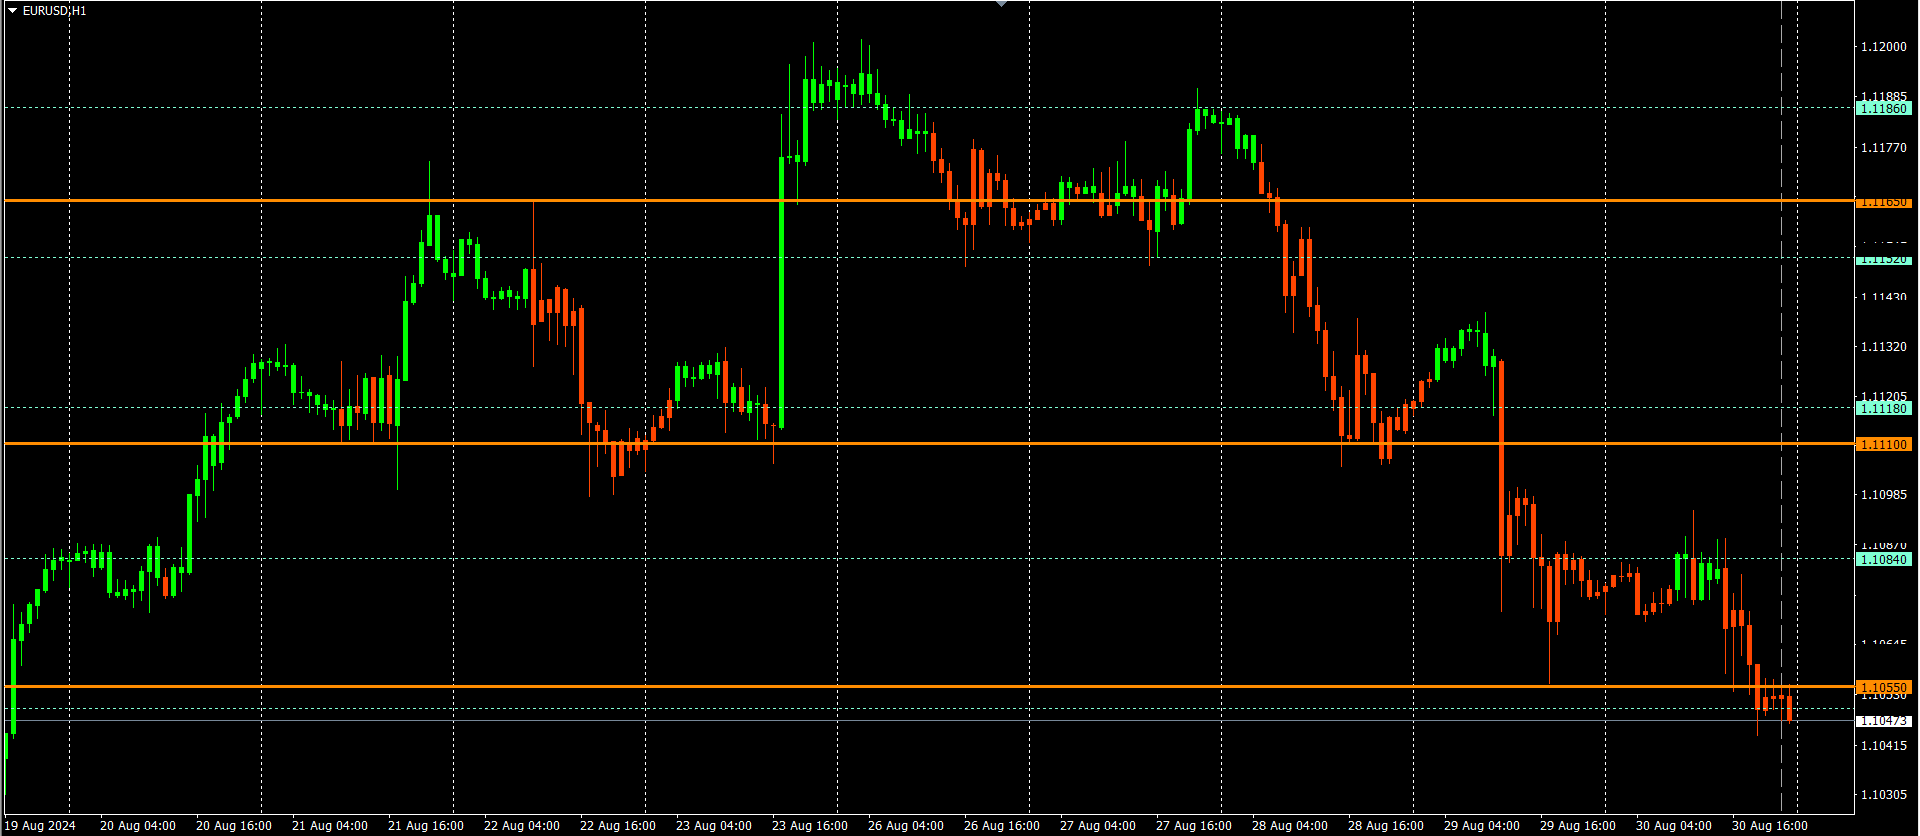
The indicator system plots key levels automatically for multiple forex pairs.


It also provides candle color to help with direction


Best on GBPUSD and EURUSD - H1


JPY pairs on 15m


To deactivate a level, just select color none.


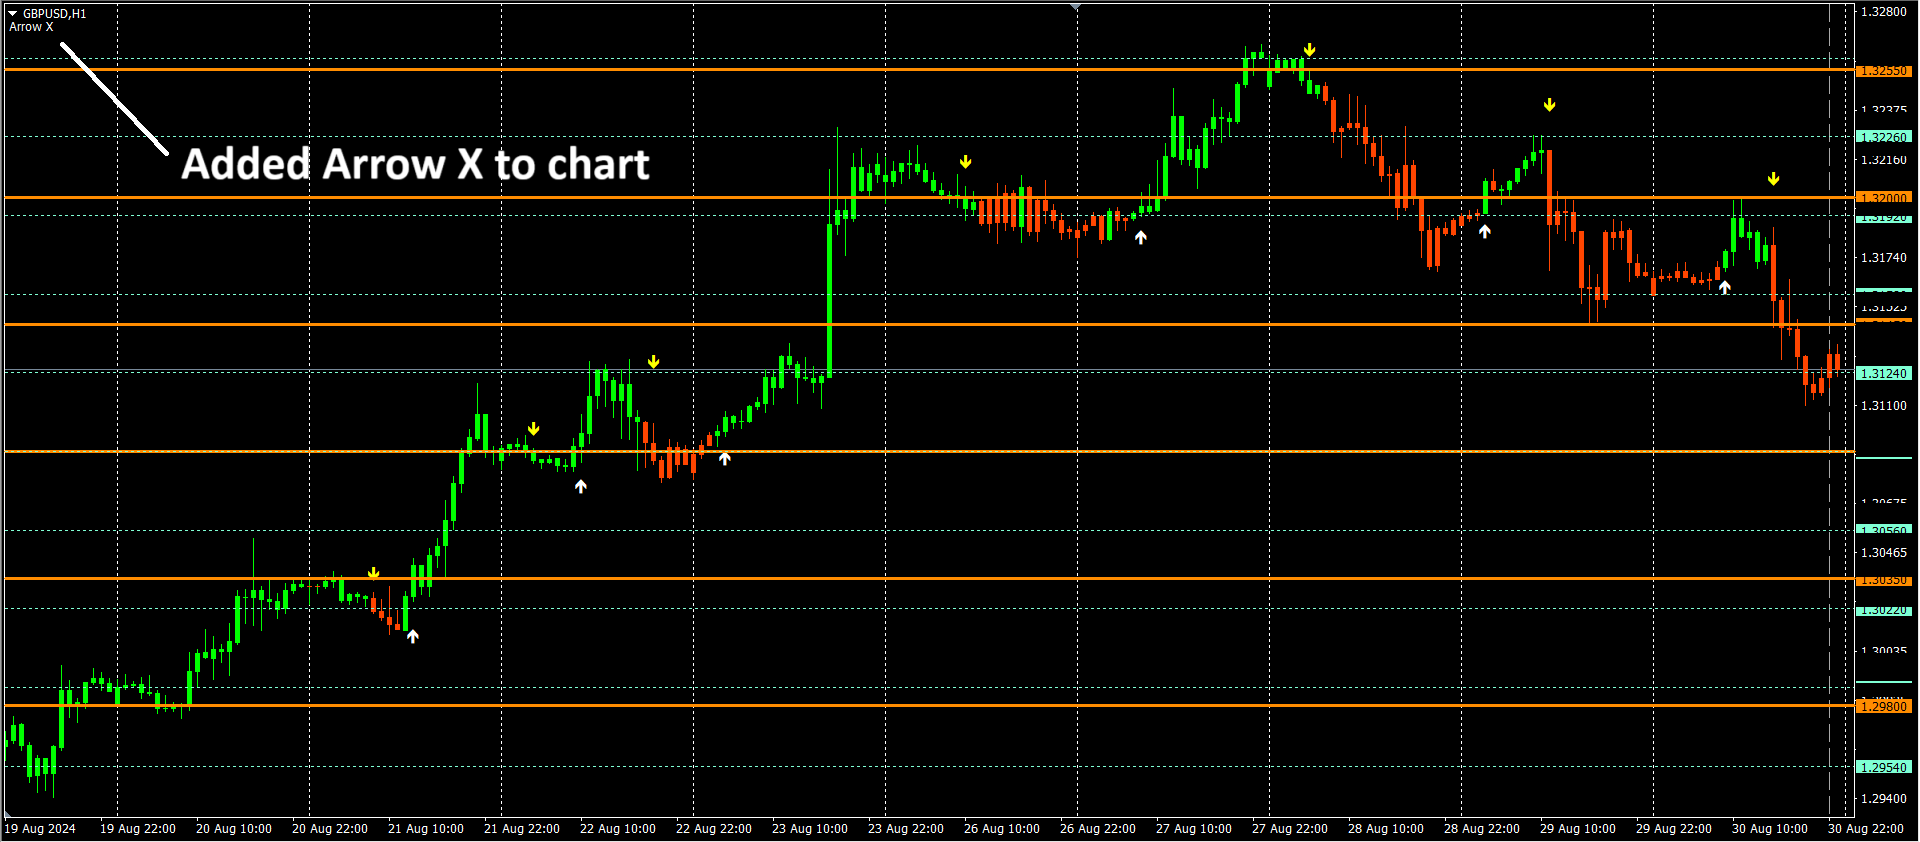
Best to use with my indicator Arrow X - See second screenshot


The color, line style and thickness can be adjusted as preferred.


Symbol: Most forex pairs 

Timeframe: Depends on pair chosen 


Enjoy!

------------------------------------------


추천 제품
Volume Confirm Trend Zone is the indicator for filtering sideways and confirm trend to help your system trading. Indicator can use every currency pairs, every time frame, and every broker. You can see trend zone when color to change in volume indicator. Features When the color changes to the blue: Buy Zone is a strong trend. When the color changes to the red: Sell Zone is a strong trend.
MA Alignment Scanner
Benedict Jamora
5 (1)
This indicator scans and displays currency pairs that have recently aligned moving averages on a given timeframe. You can configure which pairs the indicator will scan. It also includes all types of alert options. Bullish MA Alignment =  MA1>MA2>MA3>MA4>MA5 Bearish MA Alignment =  MA1<MA2<MA3<MA4<MA5 Features Attach to one chart and scans all the currency pairs configured and visible in the Market Watch Window It can monitor all the available timeframes from M1 to MN1 and sends alerts on ever
The Multi Pairs Forex Indicator is an advanced trading too l that allows traders to track and analyze the performance of multiple currency pairs in real-time on a single chart. It consolidates data from various Forex pairs, providing an at-a-glance overview of market conditions across different currencies and helps you save time. Useful for various trading styles, including scalping, day trading, and swing trading. Whether you're monitoring major pairs like EUR/USD, GBP/USD, or more exotic pair
Think of the rarest pair you can think of. And I assure you that this indicator can compute it's strength. This Currency Meter will literally calculate any currency pairs, either it is the Major Pairs, Metals, CFD's, Commodities, Crypto Currency like Bitcoin/BTC or Ethereum/ETH and even stocks. Just name it and you will get it! There is no currency pair this Currency Meter can solve. No matter how rare or exotic is that currency, it will always be solved by this Currency meter which on a real-ti
"MultiSymbol & TF Chart Integrated" 지표는 단일 차트(다중 모드)에서 최대 60개의 통화 쌍을 선호하는 시간대에 따라 모니터링하거나 모든 TF에서 거래 중인 통화 쌍을 볼 수 있도록 빠르게 포괄적인 시장 전망을 제공하도록 설계되었습니다(단순 모드). 주요 장점: 완전 모니터링: 단일 차트에서 모든 원하는 쌍을 한 눈에 실시간으로 모니터링할 수 있습니다. 시간 절약: 차트 간 전환 필요 없이 각 쌍의 행동을 실시간으로 확인할 수 있습니다. 추세 분석: 추세를 따르는 트레이더에게 적합하며, 결정하기 전에 추세를 확인하기 위해 상위 시간대를 볼 수 있습니다. 극한 사용자 정의: 지표의 모든 측면을 특정 요구에 맞게 조정합니다. 극한 사용자 정의: 높은 구성 가능성 지표 매개변수: 심볼 및 시간대: 최대 60개의 다른 심볼을 구성할 수 있습니다. 각 심볼은 고유한 시간대를 가질 수 있습니다(예: M1, M5, M15, M30, H1, H4, D1, W1
안녕하세요. 12point입니다. 인디케이터가 손쉽게 원하는 통화차트로 변경해줍니다.  굳이 듀얼모니터 사용하실 필요없습니다. 창 두개 띄어놓고도 변경가능합니다. 풀버전입니다. 통화는 무조건  Market Watch 목록에 활성화가 되어있어야합니다. 그래야 정상작동이 되요.  파라미터 값: SymbolList - 원하시는 통화 및 상품을 추가 할 수 있습니다 콤마(,)를 붙혀주세요. ratio - 사이즈 조절 LineNumber - 각 라인당 몇개의 통화버튼을 지정할것인가 입니다. button_width - 버튼 사이즈 조절 button_height - 버튼 사이즈 조절 손매매에 하는데있어서 나름 괜찮은 무기를 획득했으니... 우리 모두 성투해 봅시다.   감사합니다.
Daily Average Retracement Dashboard is an indicator that allows you to monitor multiple currency pairs at one time. This indicator is mainly for strategies that trade price retracement based on Resistance 3/4 or Support 3/4. After applying this indicator to the chart window, it will hide the chart and display the currency pairs in a table form. There are several data shown on the table that will help trader know when to analyze the currency and do trade using retracement. The indicator will show
Breakeven Price
Vladimir Chiosa
Nowadays a lot of traders need to open more positions for the same pair, because one position is not usually the best possible position, thus a lot of trades are accumulated, sometimes with different lot sizes, and not easy to calculate the breakeven price of all opened positions, for solving this issue the Breakeven Price indicator was created. Breakeven Price is an MT4 indicator which calculates real time the breakeven price of all Buy & Sell positions opened by trader or EAs. It shows real ti
Currency Power Meter
Vu Trung Kien
4.69 (16)
Currency Power Meter shows the power of major currencies against each other. The indicator shows the relative strength of currency/pair at the current moment in a period of time (H4, daily, weekly, monthly). It is useful for day traders, swing traders and position traders with suitable period options. Currency power is the true reason of market trend: The strongest currency against the weakest currency will combine into a most trending pair. As we know, trend makes money and all traders love tre
VPO Profile MT4
Kyra Nickaline Watson-gordon
5 (2)
Definition : VPO is a Volume Price Opportunity. Instead of using bars or candles with an Open, High, Low, and Close price, each "bar" in a Market Profile is represented by horizontal bars against the price It is called Market Profile terminology. In other words volume-price-opportunity (VPO) profiles are histograms of how many volumes were traded at each price within the span of the profile. By using a VPO chart, you are able to analyze the amount of trading activity, based on volume, for eac
Matrixs
Andriy Sydoruk
Matrix is a Forex arrow indicator. Displays signals simply and clearly! The arrows show the direction of the transaction, and are colored accordingly, which can be seen in the screenshots. As you can see, trading with such an indicator is easy. I waited for an arrow to appear in the desired direction - I opened a deal. An arrow formed in the opposite direction - closed the deal. The indicator also displays the lines with the help of which the arrow signals are formed, taking into account the int
Forex Gump
Andrey Kozak
2.4 (5)
Forex Gump is a fully finished semi-automatic trading system. In the form of arrows, signals are displayed on the screen for opening and closing deals. All you need is to follow the instructions of the indicator. When the indicator shows a blue arrow, you need to open a buy order. When the indicator shows a red arrow, you need to open a sell order. Close orders when the indicator draws a yellow cross. In order to get the most effective result, we recommend using the timeframes H1, H4, D1. There
Signal Strength Meter
Naim El Hajj
4 (5)
The Signal Strength Meter is a Multi-Currency, Dual Timeframe Interactive Indicator, which calculates the strength of buy and sell signals, and displays a score for each symbol on a display board. Get a 7-Day Free Trial Version:  Click  Here  (Full Access to The Indicator for 7 Days) Check Video Below For Complete Demonstration, and User Manual here . Key Features: Allows you to see multiple currency signals from one chart Analyses the signals from more than a dozen classic indicators Identi
New Bar Alarm Pro
Tomoyuki Nakazima
This indicator alerts you when/before new candle bar formed. In other words,this indicator alerts you every 1/5/30/60/240 minutes. This indicator is especially useful for traders who trade when new bars formed. *This indicator don't work propery in strategy tester.Use Free Version to check functionality in live trading. Input Parameters Alert_Or_Sound =Sound ----- Choose alert or sound or both to notify you when new bar is coming. Enable_1mBarAlert ----- Enable alert for 1 min bar dif
We present you the indicator "Candle closing counter", which will become your indispensable assistant in the world of trading. That’s why knowing when the candle will close can help: If you like to trade using candle patterns, you will know when the candle will be closed. This indicator will allow you to check if a known pattern has formed and if there is a possibility of trading. The indicator will help you to prepare for market opening and market closure. You can set a timer to create a p
Moving Average Alert Cloud Eyes MT4
Christianiel Robles Faustino
Cloud Eyes is an advanced moving average alert that   will easily monitor the price action based on set moving averages to multiple open charts.  Objective: To monitor multiple open charts and notify traders conveniently in a single display panel when using the moving averages to enter/exit a trades. Features: Monitor price action in two timeframes at the same time Supports simple, exponential, smoothed, linear weighted moving averages Trigger an alert based on candle size (full/body length) Ca
Blahtech Market Profile
Blahtech Limited
4.56 (16)
Was: $249  Now: $99   Market Profile defines a number of day types that can help the trader to determine market behaviour. A key feature is the Value Area, representing the range of price action where 70% of trading took place. Understanding the Value Area can give traders valuable insight into market direction and establish the higher odds trade. It is an excellent addition to any system you may be using. Blahtech Limited presents their Market Profile indicator for the MetaTrader community. Ins
The Candlestick Pattern Detector is an advanced MetaTrader 4 indicator designed to identify and highlight candlestick patterns on your charts. Currently, the indicator detects one specific candlestick pattern - the pinbar, known for its significance in technical analysis and trading strategies. This tool provides traders with visual cues, making it easier to spot potential market reversals or continuations. Features: Customizable Colors: Users can customize the colors of the bullish and bearish
Master scalping M1
Nataliia Marchuk
Master Scalping M1 is an innovative indicator that uses an algorithm to quickly and accurately determine the trend.The indicator calculates the time of opening and closing positions, the indicator's algorithms allow you to find the ideal moments to enter a deal (buy or sell an asset), which increase the success of transactions for most traders. Benefits of the indicator: Easy to assemble, does not overload the chart with unnecessary information. Can be used as a filter for any strategy. Works on
Currency Quote
Bott Consulting Group
Real-time trend, pricing, and volume details in the corner of the current chart. This indicator displays useful trend, pricing, and volume information in the corner of the current chart. With this indicator, you get real-time market trend, pricing (Ask, Bid, spread, Open, High, Low, change from previous bar Close), and volume (current, High, average). After the indicator is executed, you will see this real-time data in the upper right-hand corner of the chart or an alert indicating that an error
Currency Strength Meter Pro for MT4
ALEKSANDR SHUKALOVICH
4.22 (9)
Currency Strength Meter is the easiest way to identify strong and weak currencies. This indicator shows the relative strength of 8 major currencies + Gold: AUD, CAD, CHF, EUR, GBP, JPY, NZD, USD, XAU. Gold symbol can be changed to other symbols like XAG, XAU etc. By default the strength value is normalised to the range from 0 to 100 for RSI algorithm: The value above 60 means strong currency; The value below 40 means weak currency; This indicator needs the data of all 28 major currency pair
VR Cub
Vladimir Pastushak
VR Cub 은 고품질 진입점을 얻는 지표입니다. 이 지표는 수학적 계산을 용이하게 하고 포지션 진입점 검색을 단순화하기 위해 개발되었습니다. 지표가 작성된 거래 전략은 수년 동안 그 효율성을 입증해 왔습니다. 거래 전략의 단순성은 초보 거래자라도 성공적으로 거래할 수 있다는 큰 장점입니다. VR Cub은 포지션 개시 지점과 이익 실현 및 손절매 목표 수준을 계산하여 효율성과 사용 편의성을 크게 높입니다. 간단한 거래 규칙을 이해하려면 아래 전략을 사용한 거래 스크린샷을 살펴보세요. 설정, 세트 파일, 데모 버전, 지침, 문제 해결 등은 다음에서 얻을 수 있습니다. [블로그] 다음에서 리뷰를 읽거나 작성할 수 있습니다. [링크] 버전 [MetaTrader 5] 진입점 계산 규칙 포지션 개설 진입점을 계산하려면 VR Cub 도구를 마지막 최고점에서 마지막 최저점까지 늘려야 합니다. 첫 번째 지점이 두 번째 지점보다 빠른 경우, 거래자는 막대가 중간선 위에서 마감될 때까지 기다립
This all-in-one indicator displays real-time market structure (internal & swing BOS / CHoCH), order blocks, premium & discount zones, equal highs & lows, and much more...allowing traders to automatically mark up their charts with widely used price action methodologies. Following the release of our Fair Value Gap script, we received numerous requests from our community to release more features in the same category. //------------------------------------// Version 1.x has missing functions + PDAr
The Netsrac Correlation Trade Indicator (NCTI) was created to trade correlations between different assets. NCTI offers five different strategies to do this. Five different correlation trading strategies with two or three assets Fast access your assets with one click via asset buttons Your profit/loss at a glance Configurable alerts via screen or mobile You can use the indicator with every timeframe. Higher timeframes give fewer but better signals. If you have some questions or suggestions - ple
ForexGumpOopster - this indicator was developed to determine the trend direction and price pivot points on the H1, H4, D1 timeframes. The default settings are for the GBPUSD currency pair. For the EURUSD currency pair, the time frame H1, H4, D1 is recommended in the indicator settings to change the parameter "smooth = 5". This indicator is well suited for traders who trade on the scalping system. The arrows on the screen indicate the points of price reversal, and the lines indicate the directio
이동 평균 통화 강도 대시보드는   여러 기호 및 기간에 걸쳐 통화 모멘텀에 대한 깊은 통찰력을 제공하는 강력하고 포괄적인 지표입니다. 이 강력한 도구는 이동 평균을 활용하여 최신 교차점을 식별하고 현재 가격까지 통화의 강도를 효과적으로 추적합니다. 직관적인 디자인과 사용자 친화적인 인터페이스를 갖춘 이 대시보드는 정보에 입각한 결정을 내리려는 트레이더에게 풍부한 정보를 제공합니다. 이 대시보드의 주요 기능 중 하나는 스캐너 모드에서 작동하여 사용자가 잠재적인 기회를 찾기 위해 시장을 스캔할 수 있도록 하는 기능입니다. 지표의 포괄적인 대시보드는 모든 신호를 버튼으로 표시하여 필요한 정보에 편리하게 액세스할 수 있습니다. 버튼을 클릭하기만 하면 신호를 더 자세히 보여주는 교차선이 있는 새 차트가 열립니다. 또한 그룹 모드 기능을 사용하면 그룹으로 구성된 기호를 표시할 수 있으므로 통화 관계의 구조화된 보기를 제공합니다. 사용자 정의 가능한 매개변수를 사용하여 이동 평균 통화
Magneto
Vladimir Blednov
Description Indicator for MT5 is here. It displays alternative (mathematically calculated) support and resistance levels, as well as the levels the price is most likely to achieve in the near future. The calculation is based on history data, and the quality of quotes is critical when generating lines. The lines built by Magneto Pro and Magneto Weekly Pro do not change on the entire calculation period. Application Magneto Pro can be used both in conjunction with an existing strategy and as a se
The market profile indicator provides with an X-Ray vision into market activity, outlining the most important price levels, value area and control value of the daily trading session. [ Installation Guide | Update Guide | Troubleshooting | FAQ | All Products ] Easy to understand and use Understand market dynamics easily Automatic timeframe selection Identify zones of trading value and discard others It is useful in all market conditions Effective for any trading strategy It implements three color
ChangePeriod MT4
Kazuya Yamaoka
You can change the time period of the chart at the touch of a button. You can also change multiple charts at the touch of a button. You can also change multiple charts at the touch of a button, saving you the trouble of changing time periods. We are live-streaming the actual operation of the system. https://www.youtube.com/@ganesha_forex We do not guarantee your investment results. Investments should be made at your own risk. We sharll not be liable for any disadvantage or damage caused by
40% off. Original price: $50 ATR Scanner Pro is a multi symbol multi timeframe volatility scanner that monitors and analyzes Average True Range indicator value in up to 28 symbols and 9 timeframes in 3 modes : ATR value:  As a volatility dashboard it shows the ATR indicator value in all pairs and timeframes and signals when the ATR value reaches a maximum or minimum in a given duration. Short term ATR/Long term ATR ratio:  It shows ratio of 2 ATRs with different periods. It's useful in detect
이 제품의 구매자들이 또한 구매함
Atomic Analyst
Issam Kassas
5 (2)
우선적으로 언급할 점은이 거래 지표가 다시 그리지 않고 지연되지 않으며 이를 통해 수동 및 로봇 거래 모두에 이상적이라는 점입니다. 사용자 매뉴얼: 설정, 입력 및 전략. Atomic Analyst는 가격의 강도와 모멘텀을 활용하여 시장에서 더 나은 이점을 찾는 PA Price Action Indicator입니다. 고급 필터를 장착하여 잡음과 거짓 신호를 제거하고 거래 잠재력을 높이는 데 도움이 됩니다. 복잡한 지표의 다중 레이어를 사용하여 Atomic Analyst는 차트를 스캔하고 복잡한 수학적 계산을 간단한 신호와 색상으로 변환하여 초보 트레이더가 이해하고 일관된 거래 결정을 내릴 수 있도록합니다. "Atomic Analyst"는 새로운 및 경험이 풍부한 트레이더를위한 종합적인 거래 솔루션입니다. 프리미엄 지표와 최고 수준의 기능을 하나의 거래 전략에 결합하여 모든 종류의 트레이더에 대한 다재다능한 선택지가되었습니다. 인트라데이 거래 및 스캘핑 전략 : 빠르고 정확한
Scalper Inside PRO
Alexey Minkov
4.73 (56)
An exclusive indicator that utilizes an innovative algorithm to swiftly and accurately determine the market trend. The indicator automatically calculates opening, closing, and profit levels, providing detailed trading statistics. With these features, you can choose the most appropriate trading instrument for the current market conditions. Additionally, you can easily integrate your own arrow indicators into Scalper Inside Pro to quickly evaluate their statistics and profitability. Scalper Inside
현재 20% 할인 ! 초보자 또는 전문가 트레이더를 위한 최고의 솔루션! 이 대시보드 소프트웨어는 28개의 통화 쌍에서 작동합니다. 2가지 주요 지표(Advanced Currency Strength 28 및 Advanced Currency Impulse)를 기반으로 합니다. 전체 Forex 시장에 대한 훌륭한 개요를 제공합니다. 고급 통화 강도 값, 통화 이동 속도 및 모든(9) 시간대의 28 Forex 쌍에 대한 신호를 보여줍니다. 추세 및/또는 스캘핑 기회를 정확히 파악하기 위해 차트의 단일 지표를 사용하여 전체 시장을 볼 수 있을 때 거래가 어떻게 개선될지 상상해 보십시오! 잠재적인 거래를 식별하고 확인하면서 강력한 통화와 약한 통화를 더욱 쉽게 식별할 수 있도록 이 지표에 기능을 내장했습니다. 이 표시기는 통화의 강세 또는 약세가 증가 또는 감소하는지 여부와 모든 시간대에서 수행되는 방식을 그래픽으로 보여줍니다. 추가된 새로운 기능은 현재 시장 조건 변화에 적
Enigmera
Ivan Stefanov
5 (3)
에니메라: 시장의 핵심 https://www.enigmera.com 소개 이 지표 및 트레이딩 시스템은 금융 시장에 대한 놀라운 접근 방식입니다. 에니메라는 프랙탈 주기를 사용하여 지지선과 저항선을 정확하게 계산합니다. 진정한 축적 단계를 보여주고 방향과 목표를 제시합니다.  추세에 있든 조정에 있든 작동하는 시스템입니다.  어떻게 작동하나요? 에니메라는 지지선/저항선, 목표선, 편차선의 세 가지 라인으로 구성됩니다. 이 시스템은 과거 데이터를 현재와 미래로 추정하는 일반적인 시장 지표와 달리 현재에 대한 완전한 그림을 제공합니다. 지지선 위에 있으면 실제 지지를 의미하고 저항선 위에 있으면 실제 저항을 의미합니다. 레벨이 깨지면 추세의 변화를 나타냅니다. 다시 그리지 않습니다. 시장이 지속적으로 진화함에 따라 에니메라는 평가 도구를 조정하여 전략을 정기적으로 수정합니다.   이를 통해 모든 시나리오를 철저히 평가할 수 있습니다. 이 시장 지표의 고유성은 분명하며 그 기
TPSproTREND PrO
Roman Podpora
4.79 (19)
TPSpro TREND PRO는   시장을 자동으로 분석하여 추세와 각 변화에 대한 정보를 제공할 뿐만 아니라 다시 그리지 않고도 거래에 진입할 수 있는 신호를 제공하는 추세 지표입니다! 지표는 각 양초를 사용하여 개별적으로 분석합니다. 다른 임펄스를 언급합니다 - 업 또는 다운 임펄스. 통화, 암호화폐, 금속, 주식, 지수 거래의 정확한 진입점! 버전 MT5                   표시기에 대한 전체 설명       표시기   와 함께 사용하는 것이 좋습니다   -   RFI LEVELS 주요 기능: 렌더링 없이 정확한 입력 신호! 신호가 나타나면 관련성은 유지됩니다! 이는 신호를 제공한 후 변경하여 예금 자금 손실을 초래할 수 있는 다시 그리기 지표와의 중요한 차이점입니다. 이제 더 큰 확률과 정확도로 시장에 진입할 수 있습니다. 화살표가 나타난 후 목표에 도달(이익실현)하거나 반전 신호가 나타날 때까지 캔들을 색칠하는 기능도 있습니다. STOP LOSS / TAK
Dynamic Forex28 Navigator - 차세대 외환 거래 도구. 현재 49% 할인. Dynamic Forex28 Navigator는 오랫동안 인기 있는 지표의 진화형으로, 세 가지의 힘을 하나로 결합했습니다. 고급 통화 Strength28 지표(695개 리뷰) + 고급 통화 IMPULSE with ALERT(520개 리뷰) + CS28 콤보 신호(보너스). 지표에 대한 자세한 정보 https://www.mql5.com/en/blogs/post/758844 차세대 Strength 지표는 무엇을 제공합니까?  원래 지표에서 좋아했던 모든 것이 새로운 기능과 더 높은 정확도로 강화되었습니다. 주요 기능: 독점적인 통화 Strength 공식.  모든 시간대에 걸쳐 부드럽고 정확한 강도선. 추세와 정확한 진입을 식별하는 데 이상적입니다. 역동적인 시장 피보나치 수준(시장 피보나치).  이 지표에만 있는 고유한 기능. 가격 차트가 아닌 통화 강도에 피보나치가 적용
FX Volume
Daniel Stein
4.58 (33)
모닝 브리핑을 통해 세부 정보와 스크린샷으로 매일 시장 업데이트를 받으세요 여기 mql5 및 텔레그램에서 FX 거래량은 브로커의 관점에서 시장 심리에 대한 실제 통찰력을 제공하는 최초이자 유일한 거래량 지표입니다. 브로커와 같은 기관 시장 참여자가 외환 시장에서 어떤 포지션을 취하고 있는지에 대한 훌륭한 통찰력을 COT 보고서보다 훨씬 빠르게 제공합니다. 차트에서 이 정보를 직접 확인하는 것은 트레이딩의 진정한 판도를 바꾸고 획기적인 솔루션입니다. 다음과 같은 고유한 시장 데이터 인사이트의 이점 비율 는 통화의 매수/매도 포지션 비율을 백분율로 표시 비율 변화 는 선택한 기간 내 매수 비율과 비율 변화를 표시 총 거래량 는 해당 통화의 총 거래량(롱 및 숏)을 로트 단위로 보여줍니다 Volumes Long 는 해당 통화의 모든 롱 포지션의 거래량을 보여줍니다 Volumes Short 는 해당 통화의 모든 숏 포지션의 거래량을 보여줍니다 Net Long 는 순 롱 포지션의 거래량
TPSpro RFI Levels
Roman Podpora
4.82 (22)
지침         러시아   -        영어       표시기와 함께 사용하는 것이 좋습니다   .       -       TPSpro   트렌드 프로 -   MT4 버전         거래에서 핵심 요소는 거래 상품을 매수 또는 매도하기로 결정하는 구역 또는 수준입니다. 주요 업체가 시장에서 자신의 존재를 숨기려는 시도에도 불구하고, 그들은 필연적으로 흔적을 남깁니다. 우리의 과제는 이러한 흔적을 식별하고 올바르게 해석하는 방법을 배우는 것이었습니다. 주요 기능:: 판매자와 구매자를 위한 활성 영역을 표시합니다! 이 지표는 매수 및 매도를 위한 모든 올바른 초기 임펄스 레벨/존을 보여줍니다. 진입점 검색이 시작되는 이러한 레벨/존이 활성화되면 레벨의 색상이 바뀌고 특정 음영으로 채워집니다. 또한 상황을 보다 직관적으로 이해하기 위해 화살표가 나타납니다. 더 높은 시간대의 레벨/존 표시(MTF 모드) 더 높은 시간 간격을 사용하여 레벨/존을 표시하는 기능을 추가했습니다.
MetaTrader 4용 Ultimate Gold Advisor Ultimate Gold Advisor는 MetaTrader 4에서 거래 경험을 최적화하도록 설계된 고급 기술 도구입니다. 경험 많은 거래자의 요구를 충족하기 위해 개발된 이 지표는 정밀성, 정교한 분석 및 다기능성을 결합하여 정보에 입각한 거래 결정을 내리는 데 도움을 줍니다. 금 거래에 이상적이지만 다양한 자산에 적용 가능하며, Ultimate Gold Advisor는 시장 전략을 향상시키는 데 도움을 줄 수 있습니다. Ultimate Gold Advisor가 거래자에게 훌륭한 도구인 이유는 무엇입니까? 고급 성능: 각 거래 결과를 차트에 명확하게 표시하는 지표들의 조합으로 전략 성과를 투명하게 볼 수 있습니다. 이를 통해 접근 방식을 개선하고 더 정보에 입각한 결정을 내릴 수 있습니다. 즉각적이고 시각적인 거래 신호: 차트에 빨간색과 파란색 화살표가 표시되어 매수 및 매도 기회를 신호합니다. 이러한 시각적 신호는
M1 Gold
Abdulkarim Karazon
Gold Channel XAUUSD
Paulo Rocha
5 (2)
Gold Channel is a volatility-based indicator, developed with a specific timing algorithm for the XAUUSD pair, which consists of finding possible corrections in the market. This indicator shows two outer lines, an inner line (retracement line) and an arrow sign, where the theory of the channel is to help identify overbought and oversold conditions in the market. The market price will generally fall between the boundaries of the channel. If prices touch or move outside the channel it is a tra
GOLD Impulse with Alert
Bernhard Schweigert
4.56 (9)
이 지표는 Advanced Currency IMPULSE with ALERT  +   Currency Strength Exotics  의 2가지 제품의 슈퍼 조합입니다. 그것은 모든 시간 프레임에 대해 작동하며 8개의 주요 통화와 하나의 기호에 대한 강약의 충동을 그래픽으로 보여줍니다! 이 표시기는 금, 이국적인 쌍, 상품, 지수 또는 선물과 같은 기호에 대한 통화 강도 가속을 표시하는 데 특화되어 있습니다. 금, 은, 오일, DAX, US30, MXN, TRY, CNH 등의 진정한 통화 강도 가속(충동 또는 속도)을 표시하기 위해 9번째 줄에 모든 기호를 추가할 수 있습니다. 새로운 기본 알고리즘을 기반으로 구축되어 잠재적인 거래를 훨씬 더 쉽게 식별하고 확인할 수 있습니다. 이는 통화의 강세 또는 약세가 가속되는지 여부를 그래픽으로 표시하고 가속 속도를 측정하기 때문입니다. 자동차의 속도계처럼 생각하면 됩니다. 가속화할 때 Forex 시장에서 동일한 일이 분명히
AW Prime Oscillator
AW Trading Software Limited
5 (1)
두 개의 오실레이터의 조합. 첫 번째 항목은 진입점을 표시하고 두 번째 항목은 현재 추세를 표시합니다. 표시기는 두 가지 모드의 화살표로 오실레이터 신호를 표시할 수 있습니다. 모든 빠른 오실레이터 신호 또는 현재 추세 방향의 신호만 표시할 수 있습니다. 다중 시간대 패널과 세 가지 유형의 신호 알림이 있습니다. 이익: 일일 및 스캘핑 거래에 적합 추세 필터링 간단하고 민감한 설정 다중 시간대 패널 Advisor에 통합하는 데 적합합니다. 모든 기호 및 기간에서 작동합니다. 세 가지 유형의 알림 MT5 version ->  HERE  / Problem solving ->  HERE 지표 전략 표시기는 두 개의 서로 다른 오실레이터로 구성됩니다. 느린 추세선(두꺼움) - 지표의 고수준이 위에서 아래로 교차하면 하락세 지표이고, 낮은 수평 수준(지표의 낮은 수준)이 아래에서 위로 교차하면 하락 추세 지표입니다. 상승 경향. 또한, 하단 영역에서 느린 선을 발견하면 현재 추세가 하락세임
Best Currency Strength Indicator
Tumelo Patrick Rakotsoane
4.59 (46)
Advanced Currency Strength Indicator The Advanced Divergence Currency Strength Indicator. Not only it breaks down all 28 forex currency pairs and calculates the strength of individual currencies across all timeframes , but, You'll be analyzing the WHOLE forex market in 1 window (In just 1 minute) . This indicator is very powerful because it reveals the true movements of the market.  It is highly recommended to  analyze charts knowing the performance of individual currencies or the countries ec
Allows multiple indicators to be combined into a single indicator, both visually and in terms of an alert. Indicators can include standard indicators, e.g. RSI, CCI, etc., and also Custom Indicators, even those purchased through Market, or where just have the ex4 file. An early alert is provided, say when 4 out 5 indicators have lined up, and a confirmed alert when all are in agreement. A‌lso features a statistics panel reporting the success of the combined indicator by examining the current cha
TrendfollowerSR
Paul Reymkhe
4.88 (90)
Take Your Trading Experience To the Next Level ! and get the exclusive TFSR-Analyzer for free !    So you have all these outstanding features  on up to 20 symbols and all timeframes in a smart and clear Design. Correct identification of the trends  in stock investments are pivotal and TrendFollowerSR ensures this perspective while displaying the correct trend on multiply timeframes to help you go long way as much as possible. The latest technology of the Indicator enables to track whether if
Shepherd Harmonic Pattern
Abdullah Alrai
4.65 (49)
이 지표는 수동 및 자동 방법으로 차트에 그려진 고조파 패턴을 감지합니다. 사용자 매뉴얼은 다음 링크에서 확인할 수 있습니다. 리뷰를 작성하고 문의하면 무료 버전으로 MT4에서 제품을 시도할 수 있습니다. Gartley 및 Nenstar 패턴을 감지하는 데 사용할 수 있습니다. https://www.mql5.com/en/market/product/30181 전체 MT4 버전을 구입하려면 다음에서 구입할 수 있습니다. https://www.mql5.com/en/market/product/15212 참고 사항 지표에는 제어 패널이 있으며 모든 (차트 및 시간대) 설정을 저장합니다. 차트에서 더 많은 공간을 확보하려면 최소화할 수 있으며, 다른 분석 도구로 작업하는 것이 선호되는 경우 모든 지표 데이터를 숨기려면 닫기 버튼을 누를 수 있습니다. 이 지표를 사용하고 설정을 변경하면 이동 평균 또는 볼린저 밴드와 같은 지표를 추가하면 자동으로 템플릿을 저장하고 필요할 때 언제든지 로드할 수
MetaBands M4
Vahidreza Heidar Gholami
5 (2)
MetaBands uses powerful and unique algorithms to draw channels and detect trends so that it can provide traders with potential points for entering and exiting trades. It’s a channel indicator plus a powerful trend indicator. It includes different types of channels which can be merged to create new channels simply by using the input parameters. MetaBands uses all types of alerts to notify users about market events. Features Supports most of the channel algorithms Powerful trend detection algorith
Royal Scalping Indicator M4
Vahidreza Heidar Gholami
4.17 (6)
Royal Scalping Indicator is an advanced price adaptive indicator designed to generate high-quality trading signals. Built-in multi-timeframe and multi-currency capabilities make it even more powerful to have configurations based on different symbols and timeframes. This indicator is perfect for scalp trades as well as swing trades. Royal Scalping is not just an indicator, but a trading strategy itself. Features Price Adaptive Trend Detector Algorithm Multi-Timeframe and Multi-Currency Trend Low
Currency Strength Exotics
Bernhard Schweigert
4.87 (30)
현재 20% 할인! 초보자 또는 전문가 트레이더를 위한 최고의 솔루션! 이 표시기는 Exotic Pairs Commodities, Indexes 또는 Futures와 같은 기호에 대한 통화 강도를 표시하는 데 특화되어 있습니다. 금, 은, 석유, DAX, US30, MXN, TRY, CNH 등의 진정한 통화 강도를 보여주기 위해 9번째 줄에 모든 기호를 추가할 수 있습니다. 이것은 독특하고 고품질이며 저렴한 거래 도구입니다. 우리는 많은 독점 기능과 새로운 공식을 통합했습니다. 새로운 추세 또는 스캘핑 기회의 정확한 트리거 포인트를 정확히 찾아낼 수 있기 때문에 거래가 어떻게 개선될지 상상해 보십시오. 사용 설명서: 여기를 클릭 https://www.mql5.com/en/blogs/post/708876 모든 시간대에 작동합니다. TREND를 빠르게 확인할 수 있습니다! 새로운 기본 알고리즘을 기반으로 설계되어 잠재적인 거래를 더욱 쉽게 식별하고 확인할 수 있습니다.
Harmonic Papallons
Ramon Sobrevals Arce
3.33 (3)
Automatically scans the chart to find Harmonic Patterns, and give you the chance to enter early in good operations. Also if selected, it will alert you in advance when future patterns appears, showing you a projection of a posible future pattern. The main goal  for this algorithm is to determine with high precision the moment when a trend ends and a new one begins. Giving  you the best price within a reversal.   We have added the "Golden Trade", we define it as the perfect order: For those orde
All in One Trade
Alexey Minkov
4.48 (27)
The All-in-One Trade Indicator (AOTI) determines daily targets for EURUSD, EURJPY, GBPUSD, USDCHF, EURGBP, EURCAD, EURAUD, AUDJPY, GBPAUD, GBPCAD, GBPCHF, GBPJPY, AUDUSD, and USDJPY. All other modules work with any trading instruments. The indicator includes various features, such as Double Channel trend direction, Price channel, MA Bands, Fibo levels, Climax Bar detection, and others. The AOTI indicator is based on several trading strategies, and created to simplify market analysis. All-in-One
MetaTrend M4
Vahidreza Heidar Gholami
Meta Trend Indicator is an efficient way to forecast and detect the trend in any market. It reveals the trend, support and resistance levels, volatility and the maximum potential target, all in one indicator. To adapt to the price and to decrease consecutive trend failures, the internal trend detector algorithm studies the market and dynamically chooses the right values for the internal parameters. This indicator is a perfect trend filter for any strategy or expert advisor. Features Super Adapti
TrendMaestro
Stefano Frisetti
5 (3)
note: this indicator is for METATRADER4, if you want the version for METATRADER5 this is the link:  https://www.mql5.com/it/market/product/108106 TRENDMAESTRO ver 2.4 TRENDMAESTRO recognizes a new TREND in the bud, he never makes mistakes. The certainty of identifying a new TREND is priceless. DESCRIPTION TRENDMAESTRO identifies a new TREND in the bud, this indicator examines the volatility, volumes and momentum to identify the moment in which there is an explosion of one or more of these data a
Beast Indicator V7
Mohamed Ahmed Sh Muhumed
Step into the future of automated trading with the Beast Indicator V7, The indicator allows you to trade binary options. T his indicator give high winning ratio with over 20 years of backtesting  an unparalleled tool that seamlessly transforms your trading journey into an effortless and lucrative venture. Designed to simplify and optimize the trading process, the Beast Indicator is the ultimate game-changer, offering a hassle-free experience that allows you to set your buy and sell options effo
Supply and Demand Dashboard PRO
Bernhard Schweigert
4.8 (20)
현재 20% 할인! 이 대시보드는 여러 기호와 최대 9개의 타임프레임에서 작동하는 매우 강력한 소프트웨어입니다. 주요 지표(최상의 리뷰: 고급 공급 수요)를 기반으로 합니다.   Advanced Supply Demand 대시보드는 훌륭한 개요를 제공합니다. 다음과 같이 표시됩니다.  영역 강도 등급을 포함하여 필터링된 공급 및 수요 값, 영역에 대한/및 영역 내 Pips 거리, 중첩된 영역을 강조 표시하고 모든 (9) 시간 프레임에서 선택한 기호에 대해 4가지 종류의 경고를 제공합니다. 그것은 당신의 개인적인 필요에 맞게 고도로 구성 가능합니다! 당신의 혜택! 모든 트레이더에게 가장 중요한 질문: 시장에 진입하기에 가장 좋은 수준은 무엇입니까? 최고의 성공 기회와 위험/보상을 얻으려면 강력한 공급/수요 영역 내 또는 그 근처에서 거래를 시작하십시오. 손절매를 위한 최적의 장소는 어디입니까? 가장 안전하려면 강력한 수요/공급 구역 아래/위에 정
Entry Points Pro
Yury Orlov
4.62 (175)
다시 색을 칠하지 않고 거래에 진입할 수 있는 정확한 신호를 제공하는 MT4용 지표입니다. 외환, 암호화폐, 금속, 주식, 지수 등 모든 금융 자산에 적용할 수 있습니다. 매우 정확한 추정값을 제공하고 매수와 매도의 가장 좋은 시점을 알려줍니다. 하나의 시그널로 수익을 내는 지표의 예와 함께 비디오 (6:22)시청하십시오! 대부분의 거래자는 Entry Points Pro 지표의 도움으로 첫 거래 주 동안 트레이딩 결과를 개선합니다. 저희의   Telegram Group 을 구독하세요! Entry Points Pro 지표의 좋은점. 재도색이 없는 진입 신호 신호가 나타나고 확인되면(시그널 캔들이 완성된 경우) 신호는 더 이상 사라지지 않습니다. 여타 보조지표의 경우 신호를 표시한 다음 제거되기 때문에 큰 재정적 손실로 이어집니다. 오류 없는 거래 게시 알고리즘을 통해 트레이드(진입 또는 청산)를 할 이상적인 순간을 찾을 수 있으며, 이를 통해 이를 사용하는 모든 거래자의
Gann Signal Scaner
Kirill Borovskii
This indicator is based on the Gann Signal indicator and acts as a market scanner. All you need to do is fill in the selected currency pairs in the settings and that’s it. Next, the indicator itself will view all these currency pairs and time frames from M5 to D1 simultaneously. When a new signal appears, the indicator will give you an Alert and also draw the letter N where this new signal will be.
PTS Precision Index Oscillator V2
PrecisionTradingSystems
5 (1)
프리시전 트레이딩 시스템의 로저 메드칼프에 의한 프리시전 인덱스 오실레이터 (Pi-Osc) 버전 2는 차트에 신속하게 로드되도록 주의 깊게 다시 코딩되었으며 경험을 향상시키기 위해 몇 가지 다른 기술적 개선 사항이 통합되었습니다. Pi-Osc는 정확한 거래 타이밍 신호를 제공하도록 개발되었으며 시장이 모든 사람의 스톱을 청산하기 위해 가야 하는 극도의 고갈 지점을 찾는 데 목적이 있습니다. 이 제품은 극단적인 지점이 어디에 있는지 알고 있는 고전적인 문제를 해결하며 트레이더로서의 삶을 훨씬 간단하게 만듭니다. 이것은 업계 표준 오실레이터와는 상당히 다른 강력한 차이점을 가지고 있는 고도로 복잡한 합의 지표입니다. 사용하는 기능 중 일부는 수요 지수, 자금 흐름, RSI, 스토캐스틱, 패턴 인식, 거래량 분석, 표준 편차 극단점 및 다양한 길이에서 위와 유사한 변형을 갖습니다. 미숙한 눈에는 다른 오실레이터와 비슷해 보일 수 있지만 RSI 또는 모멘텀과 같은 다
Quantum Breakout Indicator PRO
Bogdan Ion Puscasu
4.96 (25)
소개       Quantum Breakout PRO   , 브레이크아웃 존 거래 방식을 변화시키는 획기적인 MQL5 지표! 13년 이상의 거래 경험을 가진 숙련된 트레이더 팀이 개발한   Quantum Breakout PRO는   혁신적이고 역동적인 브레이크아웃 영역 전략으로 거래 여정을 새로운 차원으로 끌어올리도록 설계되었습니다. Quantum Breakout Indicator는 5개의 이익 목표 영역이 있는 브레이크아웃 영역의 신호 화살표와 브레이크아웃 상자를 기반으로 한 손절 제안을 제공합니다. 초보자 거래자와 전문 거래자 모두에게 적합합니다. Quantum EA 채널:       여기를 클릭하세요 MT5 버전 :   여기를 클릭하세요 중요한! 구매 후 설치 매뉴얼을 받으려면 개인 메시지를 보내주십시오. 추천: 기간: M15 통화쌍: GBPJPY, EURJPY, USDJPY,NZDUSD, XAUUSD 계정 유형: 스프레드가 매우 낮은 ECN, Ra
제작자의 제품 더 보기
MA with Arrow
Pieter Gerhardus Van Zyl
The indicator provides a moving average with buy and sell arrows Only buy arrows are shown above the moving average and only sell arrows are shown below the moving average The moving average can be adjusted as preferred - Default is 200 EMA The arrows is non repaint after close of candle to lock it in place The arrows also has alerts if needed Suitable to any timeframe or instrument of choice Test in demo before purchase Enjoy
Arrow X
Pieter Gerhardus Van Zyl
항목에 도움이 되는 비다시 그리기 화살표 표시기 추세 시장에서는 더 나은 신호가 제공됩니다. 현재 막대가 닫혀 화살표가 제자리에 고정될 때까지 기다립니다. 헷갈릴만한 설정 없이 차트만 불러오세요 화살표의 색상과 크기를 조정할 수 있습니다 표시기는 외환, 암호화폐 등 모든 쌍이나 기간에 사용할 수 있습니다. 더 큰 기간 추세로 거래하는 것이 더 좋습니다 ------------------------------------- --------- hangmog-e doum-i doeneun bidasi geuligi hwasalpyo pyosigi chuse sijang-eseoneun deo na-eun sinhoga jegongdoebnida. hyeonjae magdaega dadhyeo hwasalpyoga jejalie gojeongdoel ttaekkaji gidalibnida. hesgallilmanhan seoljeong eobs-i chateuman bulleooseyo hw
Tjomma T3 Rsi
Pieter Gerhardus Van Zyl
The indicator is a T3 and Rsi based oscillator with color change.  The indicator repaints. Check out my indicator - Arrow X -  https://www.mql5.com/en/market/product/122515 The values and colors can be changed as preferred. Please play around with the settings to get better signals. The fast line gives earlier signals but if you want confirmation wait for the cross or slow line to change color also. Buy when lines is closer to the 20 line and sell closer to the 80 line. Symbol: Any
FREE
Boeta Rsi
Pieter Gerhardus Van Zyl
The indicator is a double Rsi based oscillator with color change.  The coloring sometimes repaints because of smoothing. Check out my indicator - Arrow X -  https://www.mql5.com/en/market/product/122515 # Please note the demo doesn't perform correctly in the backtester. The values and colors can be changed as preferred. The fast line gives earlier signals but if you want confirmation wait for the cross or slow line to change color also. Buy when lines is closer to the 20 line and
Boeta Rsi Histo
Pieter Gerhardus Van Zyl
The indicator is a double Rsi based histogram. The coloring can repaint one bar backwards because of smoothing but still gives early signals Check out my indicator - Arrow X -  https://www.mql5.com/en/market/product/122515 # Please note the demo doesn't perform correctly in the backtester. The values and colors can be changed as preferred. Green bullish and red bearish Symbol: Any Timeframe: Any Enjoy!
Bulls vs Bears Histogram
Pieter Gerhardus Van Zyl
The indicator is a simple bar oscillator with green and red bars The calculation of the bars are Rsi based The values of the bars does not recalculate after bar has closed Higher green bars shows possible bullish momentum and vice versa The indicator has no settings or alerts  The colors can be adjusted as preferred but the bar width should remain on default  Suitable for any timeframe or instrument Test in demo before purchase Enjoy ----------------------------------------------
Pullback Arrows
Pieter Gerhardus Van Zyl
The indicator provides buy and sell arrows with a moving average The arrows are based on a reversal algorithm - Different than my other indicator MA with Arrows that is continuation based Only buy arrows are shown above the moving average and only sell arrows are shown below the moving average - Where the candle closes The arrows are non repaint  Alerts can be activated as preferred  Suitable to any timeframe or instrument of choice Please test in demo before purchase Available to
The Hill
Pieter Gerhardus Van Zyl
The indicator is a histogram for scalping the lower timeframes  When the hill behind appears go short and when it disappears go long  The indicator has only sound alerts  The colors can be adjusted as preferred  Suitable for lower timeframes - 1 - 5 minutes Test in demo before purchase Enjoy -----------------------------------------------------------------------
Color MA with Candles
Pieter Gerhardus Van Zyl
The indicator provides a color changing moving average with color changing candles The candles color change is based of rsi and t3 The moving average changes depend on value The values can be changed as preferred  Suitable to any timeframe or instrument of choice Test in demo before purchase Enjoy -----------------------------------------------------------------------
필터:
리뷰 없음
리뷰 답변