
안타깝게도 "Cyborg AI"을(를) 사용할 수 없습니다
Pieter Gerhardus Van Zyl의 다른 제품들을 확인할 수 있습니다.

The indicator is a histogram for scalping the lower timeframes
When the hill behind appears go short and when it disappears go long
The indicator has only sound alerts
The colors can be adjusted as preferred
Suitable for lower timeframes - 1 - 5 minutes
Test in demo before purchase
Enjoy -----------------------------------------------------------------------
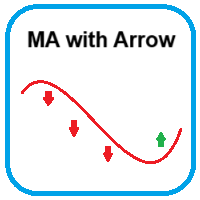
The indicator provides a moving average with buy and sell arrows
Only buy arrows are shown above the moving average and only sell arrows are shown below the moving average
The moving average can be adjusted as preferred - Default is 200 EMA
The arrows is non repaint after close of candle to lock it in place
The arrows also has alerts if needed
Suitable to any timeframe or instrument of choice
Test in demo before purchase
Enjoy
항목에 도움이 되는 비다시 그리기 화살표 표시기 추세 시장에서는 더 나은 신호가 제공됩니다. 현재 막대가 닫혀 화살표가 제자리에 고정될 때까지 기다립니다. 헷갈릴만한 설정 없이 차트만 불러오세요 화살표의 색상과 크기를 조정할 수 있습니다 표시기는 외환, 암호화폐 등 모든 쌍이나 기간에 사용할 수 있습니다. 더 큰 기간 추세로 거래하는 것이 더 좋습니다 ------------------------------------- --------- hangmog-e doum-i doeneun bidasi geuligi hwasalpyo pyosigi chuse sijang-eseoneun deo na-eun sinhoga jegongdoebnida. hyeonjae magdaega dadhyeo hwasalpyoga jejalie gojeongdoel ttaekkaji gidalibnida. hesgallilmanhan seoljeong eobs-i chateuman bulleooseyo hw
The indicator is a T3 and Rsi based oscillator with color change.
The indicator repaints.
Check out my indicator - Arrow X - https://www.mql5.com/en/market/product/122515
The values and colors can be changed as preferred.
Please play around with the settings to get better signals.
The fast line gives earlier signals but if you want confirmation wait for the cross or slow line to change color also.
Buy when lines is closer to the 20 line and sell closer to the 80 line.
Symbol: Any
FREE

The indicator is a double Rsi based histogram.
The coloring can repaint one bar backwards because of smoothing but still gives early signals
Check out my indicator - Arrow X - https://www.mql5.com/en/market/product/122515
# Please note the demo doesn't perform correctly in the backtester.
The values and colors can be changed as preferred.
Green bullish and red bearish
Symbol: Any Timeframe: Any
Enjoy!
FREE

The indicator is a simple bar oscillator with green and red bars
The calculation of the bars are Rsi based
The values of the bars does not recalculate after bar has closed
Higher green bars shows possible bullish momentum and vice versa
The indicator has no settings or alerts
The colors can be adjusted as preferred but the bar width should remain on default
Suitable for any timeframe or instrument
Test in demo before purchase
Enjoy ----------------------------------------------