Pivot trading strategy
- 지표
- Fatima Hosseini
- 버전: 1.0
- 활성화: 5
Scalping Strategy
- BUY
- SELL
Having a strategy in the market is one of the main conditions for trading.
The presence of various and complicated indicators and tools sometimes makes trading difficult, and the user gets confused after trying various methods and gets stuck in a loss cycle, the result of which is usually clear.
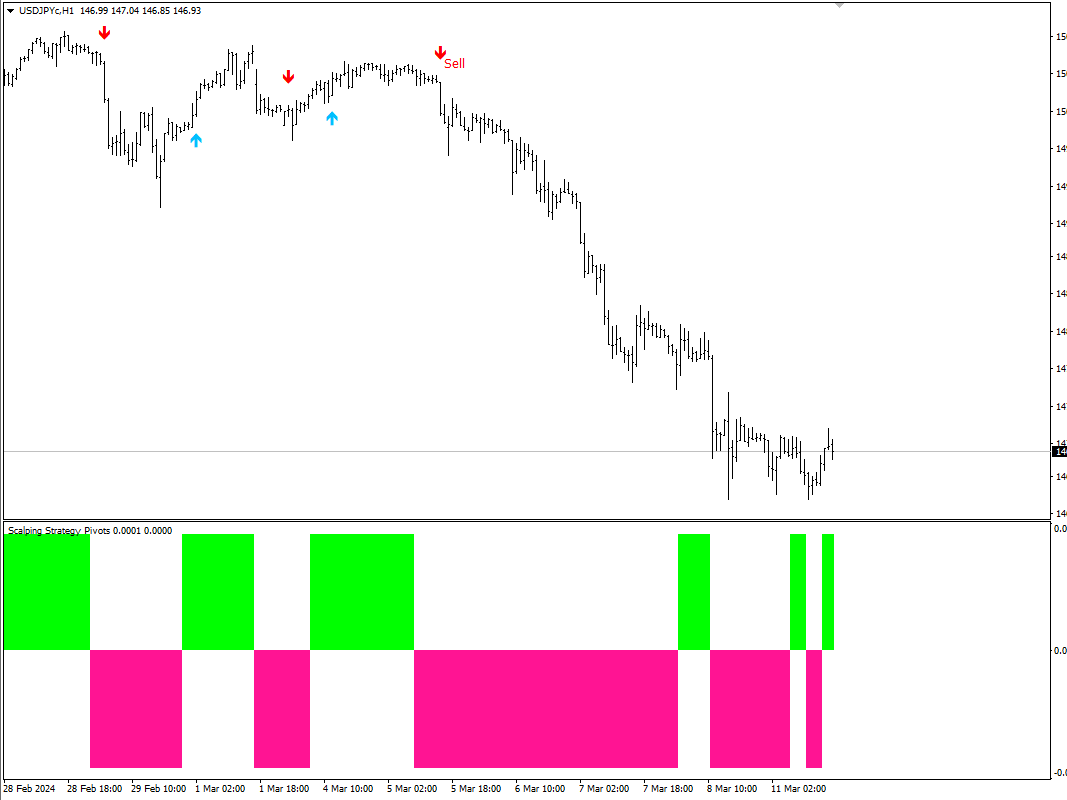
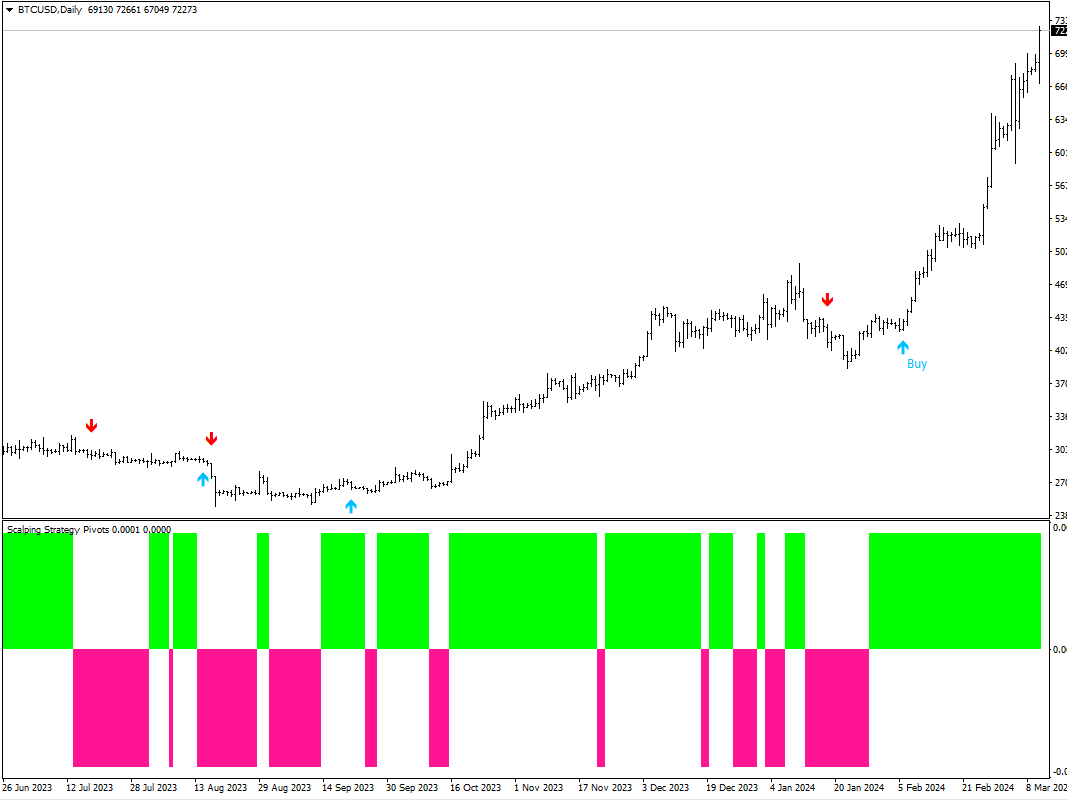
This indicator is a simple strategy based on the detection of pivots and short-term trends, which helps you to easily trade in trends.
Sometimes a simple but efficient strategy has a better result than various and complex tools.
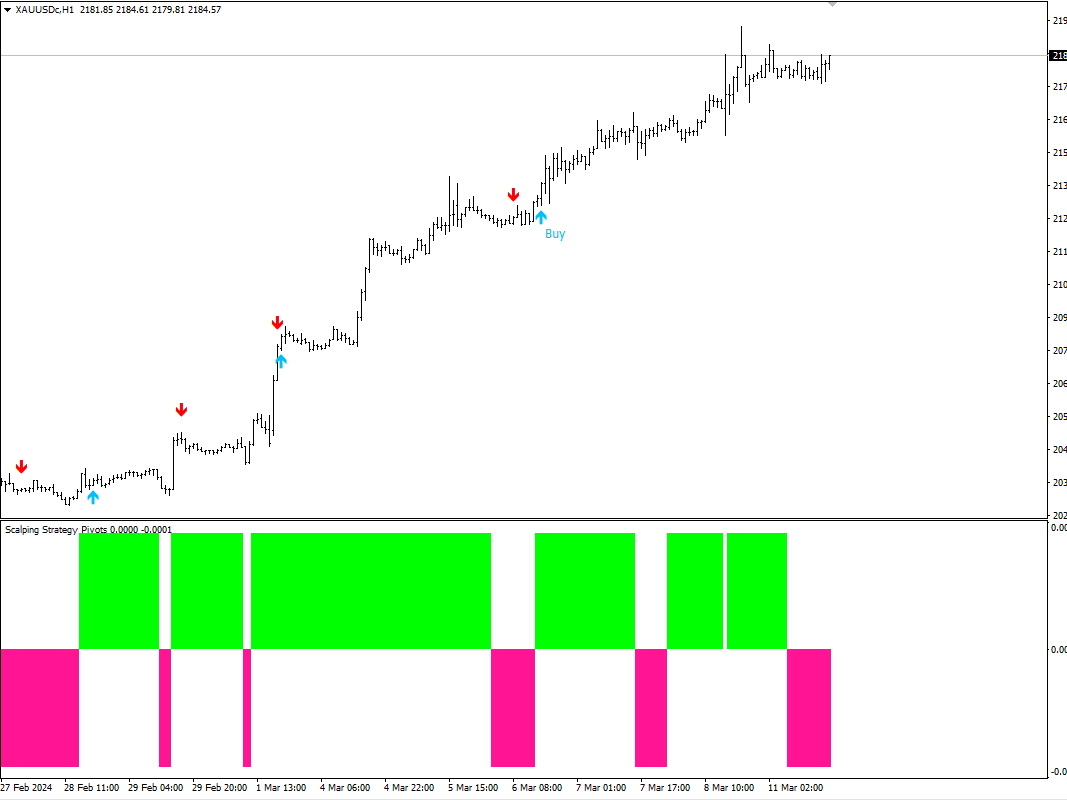
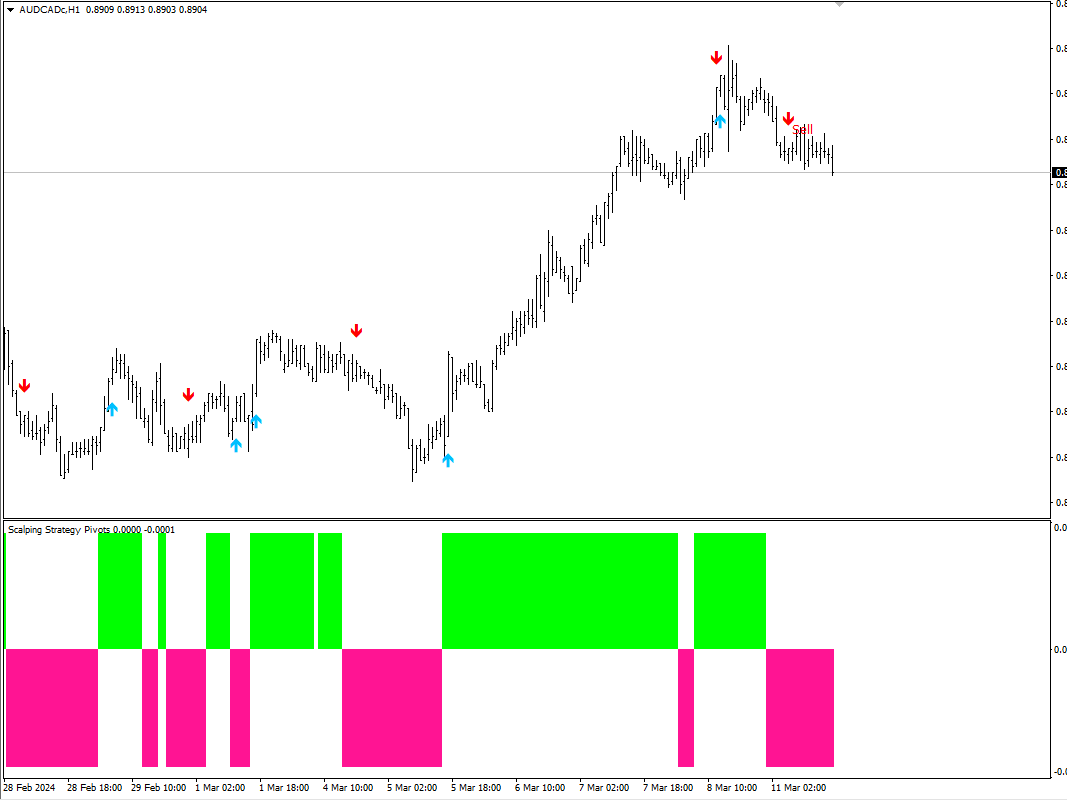
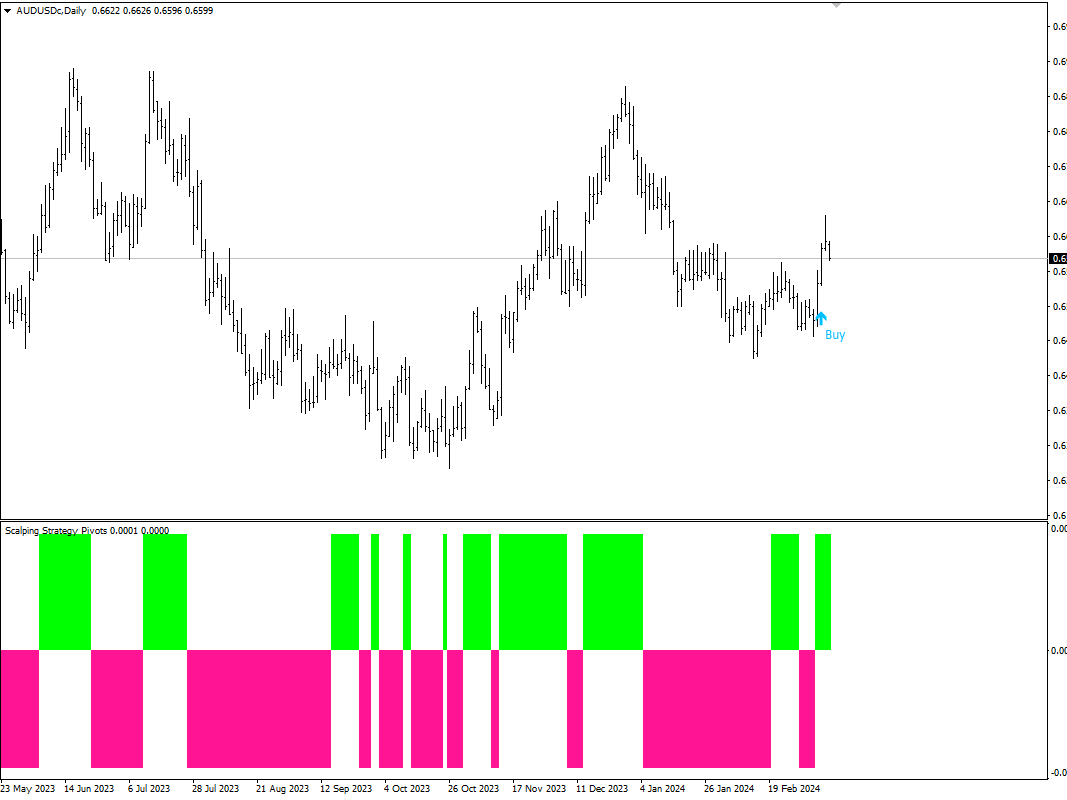
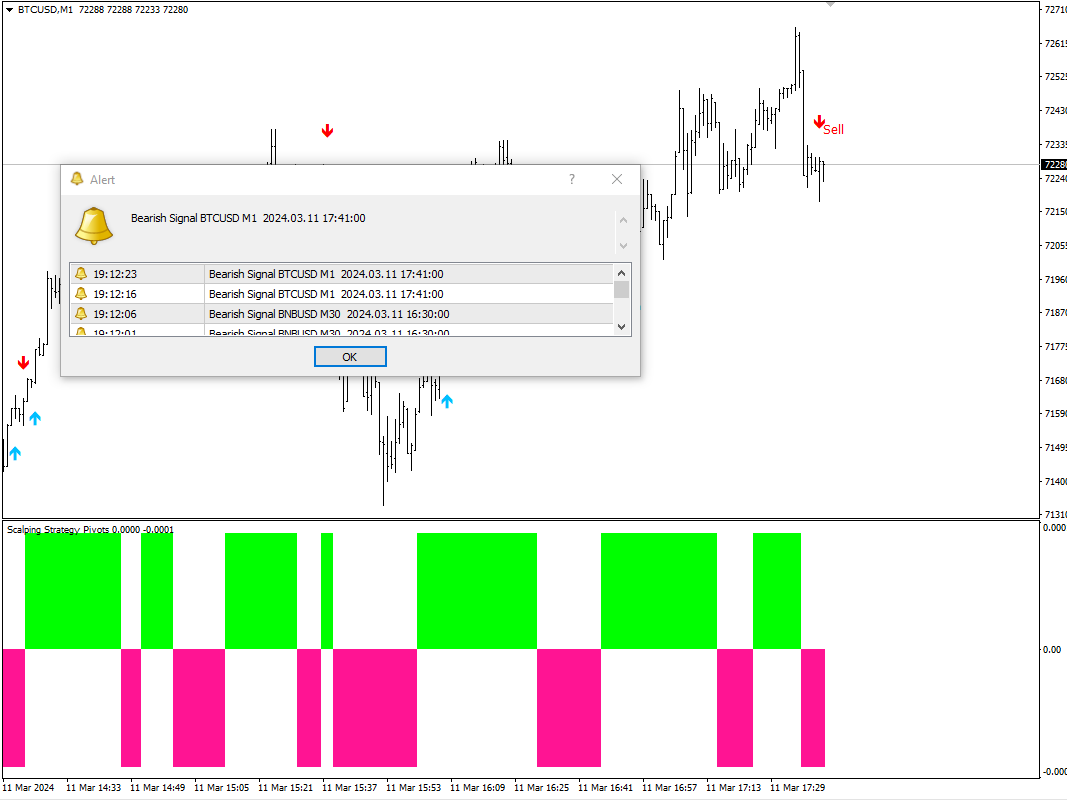
This indicator has two parts: trend detection and trigger issuance. Trend identification is displayed by a histogram at the bottom of the window, the user can decide to trade by identifying the trend and issuing a trigger. The trigger is indicated by bullish and bearish signals on the chart by arrows.
You don't need an additional indicator on the chart to trade. Simplicity and efficiency are all you need.
Explanation of the algorithm
The indicator algorithm issues buy and sell signals based on the combination of market momentum and breakouts that occur in the chart.
TP and SL
When a signal is issued, you can decide to trade, the SL and the TP are at the price when the opposite signal is issued.
For example, if you have a buy position and the position is in profit, you can keep the position open until you see a sell signal.
Featurers
- Insensitivity to news.
- No repaint
- No Bugs
- Can be usable in all markets and symbols.