Abiroid TMA Slope
- 지표
- Abir Pathak
- 버전: 1.2
- 업데이트됨: 13 8월 2024
Features:
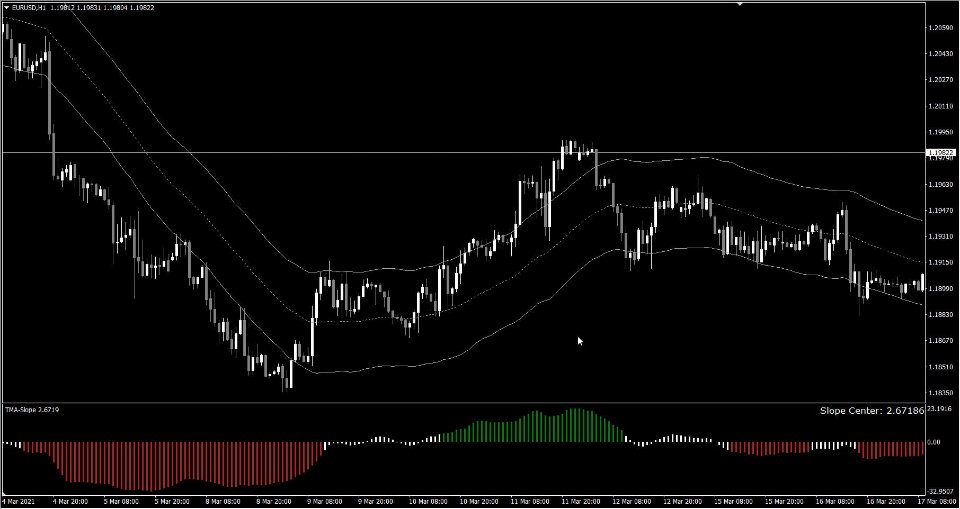
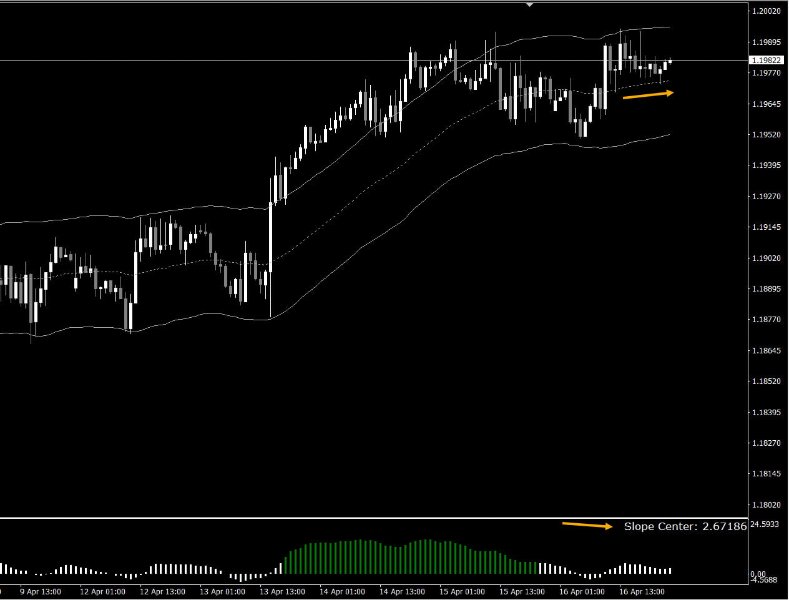
This is a slope indicator for TMA Bands indicator. It calculates slope of the center line.
It supports 3 types of TMA Bands:
- TMA True (Non-repaint)
- Fast Line TMA (Repaints)
- TMA+CG (Repaints)
It will help you determine whether price is Trending or Ranging based on the Threshold you set.
Download extra TMA Indicators for strategy here:
https://www.mql5.com/en/blogs/post/758718
How It Works:
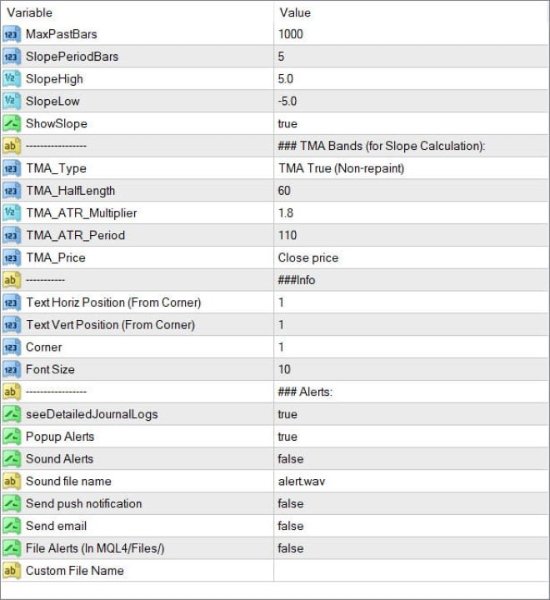
You can set the Slope Threshold for indicating Buy/Sell heightened levels.
Suppose we set Threshold to -5 and 5, then this is what we get:
And also set Slope Period Bars. Default is 5, which means it will measure the TMA middle line values for past 5 bars and find the Slope based on time for past 5 bars.
You can also get Alerts when slope changes. Alerts can be Popups, Push Notifications, Email or in a File.
Also get TMA Slope in Buffer values.
How to Trade:
If slope is red, it indicates that TMA lines are sloping downwards, and price is in downwards trend.
So only trade sell signals.
If slope is Green, it indicates TMA lines are sloping upwards and price is in upwards bullish trend.
So only trade buy signals.


