Adaptive Volatility Range Mt5
- 지표
- Stanislav Konin
- 버전: 1.2
- 업데이트됨: 19 10월 2024
- 활성화: 7
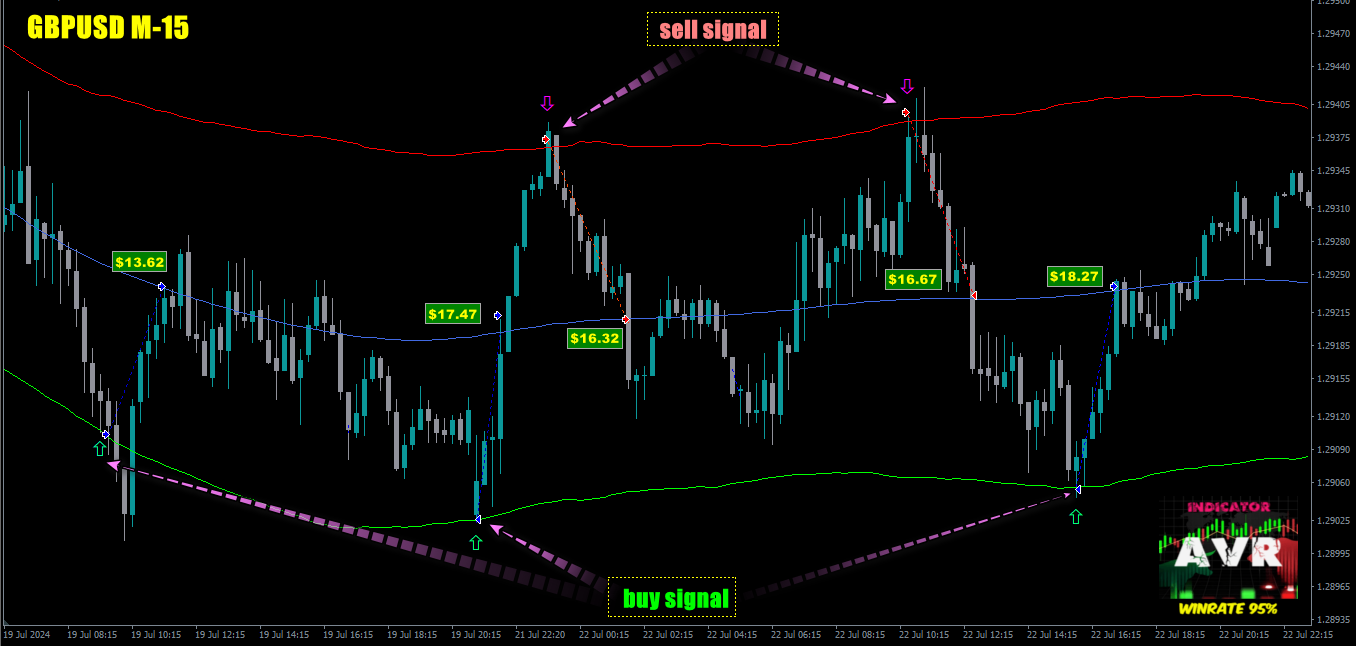
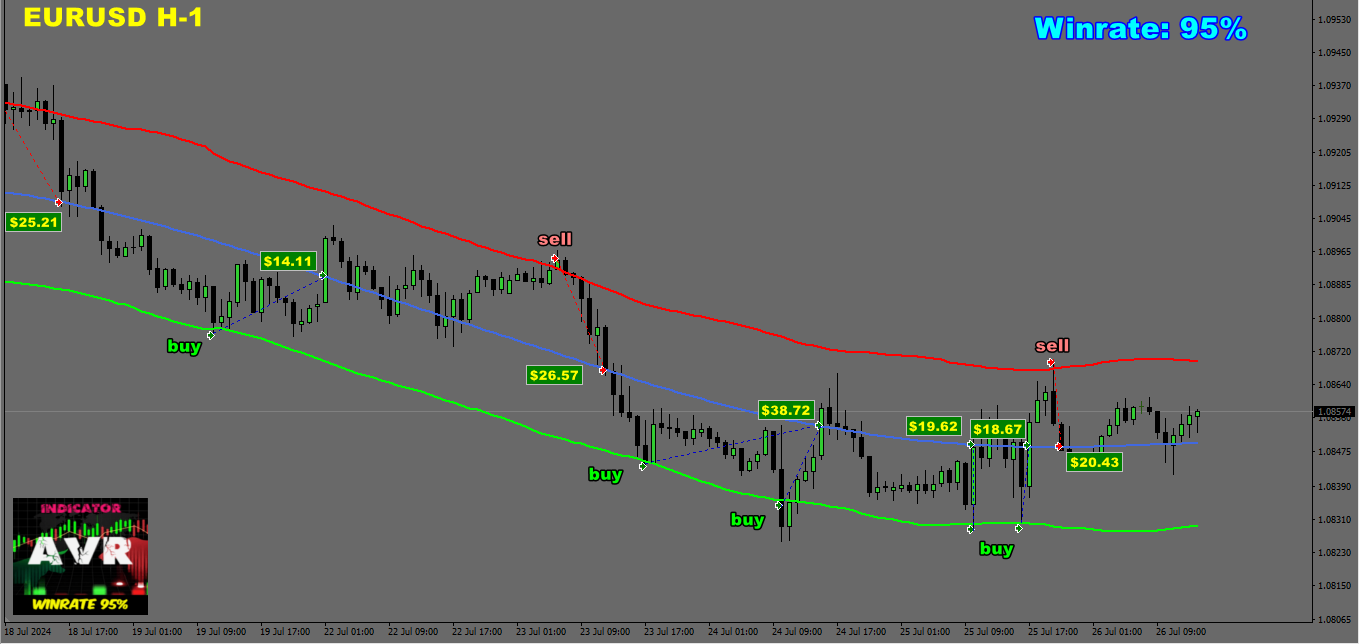
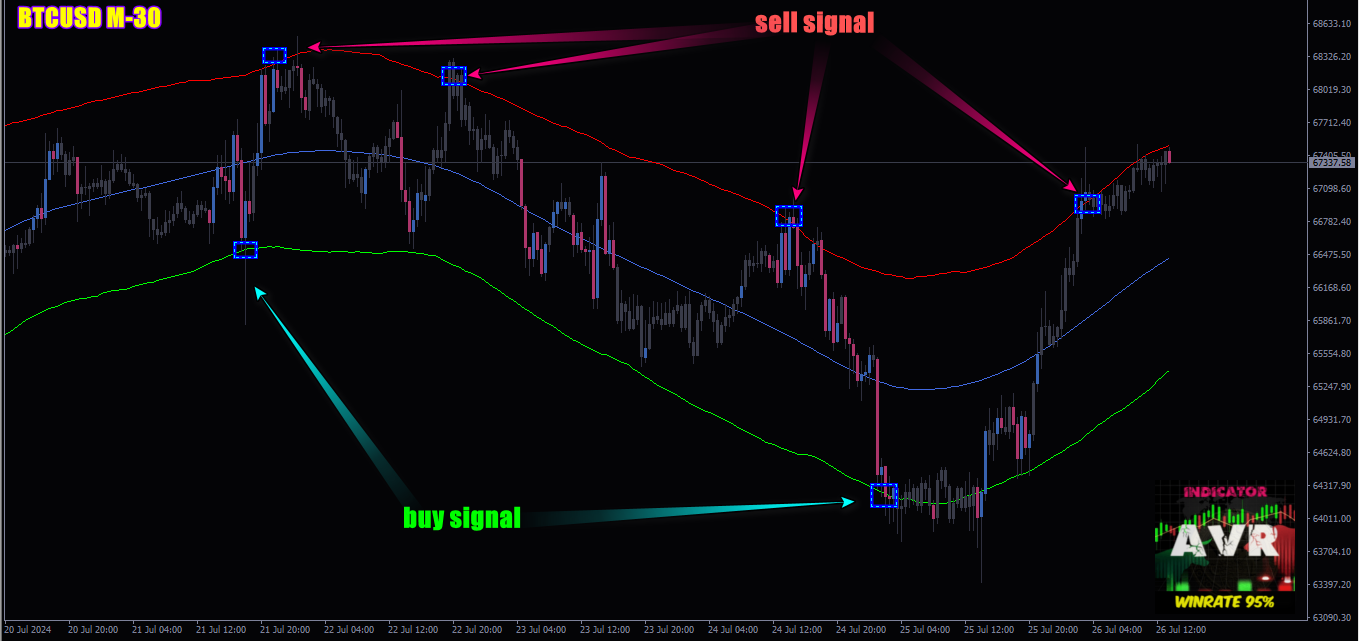
Adaptive Volatility Range [AVR] - is a powerful tool for identifying key trend reversals.
AVR - accurately displays the Average True Volatility Range taking into account the Volume Weighted Average price. The indicator allows you to adapt to absolutely any market volatility by calculating the average volatility over a certain period of time - this provides a stable indicator of positive transactions.
Thanks to this, Adaptive Volatility Range has a high Winrate of 95%
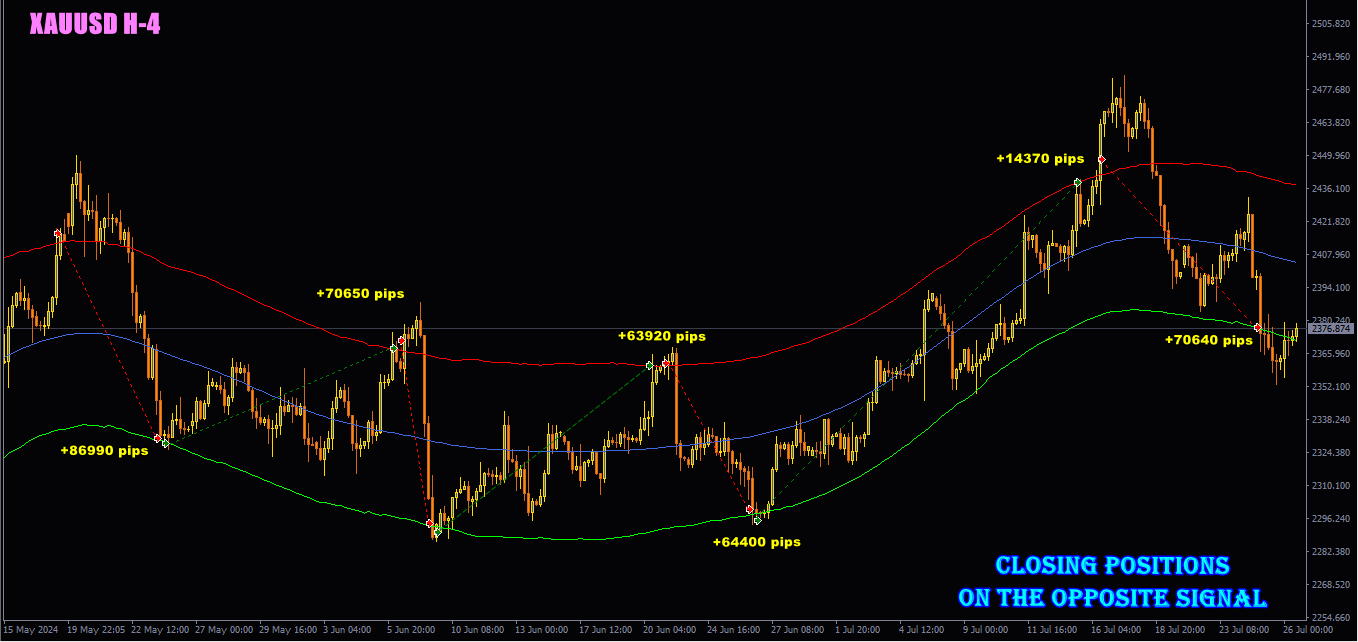
There are two ways to use it - this is a trend strategy, which also serves as a filter for the trend direction vector and a return strategy.
AVR is best suited for return strategies. Which have a pronounced tendency, after exceeding the average volatility of the traded instrument for a certain period, there is a high probability of the price returning to the average value.
Based on the AVR indicator, it is possible to build a successful trading system with a positive mathematical expectation, and this is precisely the ultimate goal of Forex trading.
Advantages of the AVR indicator:
- High accuracy of the indicator.
- You can easily determine levels for entry points into the market both behind the trend and against the trend.
- Determine targets (exit points) on any timeframe with high accuracy.
- Easily display target levels directly on the chart.
- Works with any financial instruments (Forex, Metals, CFD, Futures, Crypto).
- Works on all periods and time frames.
- Suitable for beginners and experienced traders.
Notifications and alerts:
- Notification of arrow appearance when a signal is formed.
- Alert on computer.
- Push notifications to mobile
- Selection of signal bar.
Recommendations:
- Place Take Profit within the range at the level of the weighted average price, and Stop Loss outside the levels of excess volatility.
- Use ATR Multiplier to calculate more than 3.0 on timeframes M-1, M-5, M-15 to get the most accurate results.
Options:
- History - Select history
- Centered AVR period - Period for calculation
- Price to use - Price calculation method
- ATR Period - Number of bars to calculate average volatility
- ATR Multiplier - ATR Multiplier
- Centered AVR angle caution.In pips - Central Angle Warning
- Signal Bar - Selecting a signal bar