• 미리보기
  • 리뷰
  • 코멘트

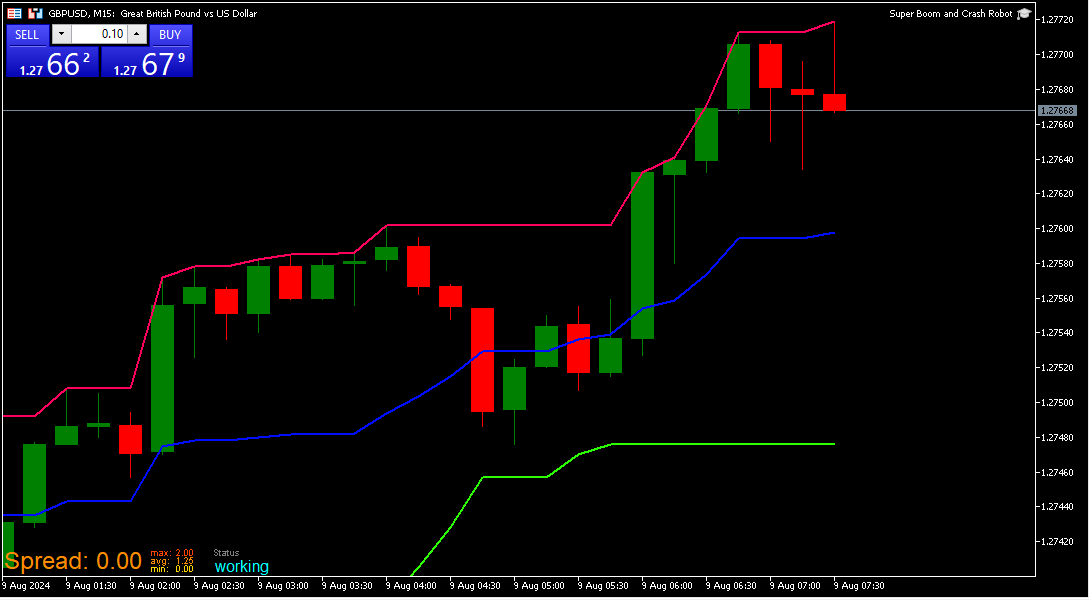
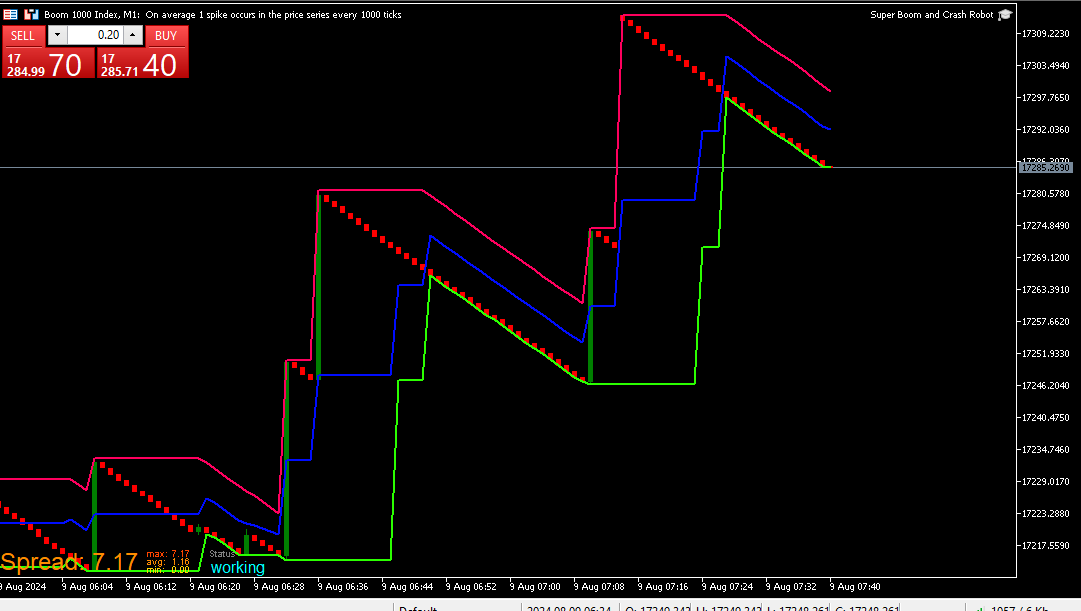
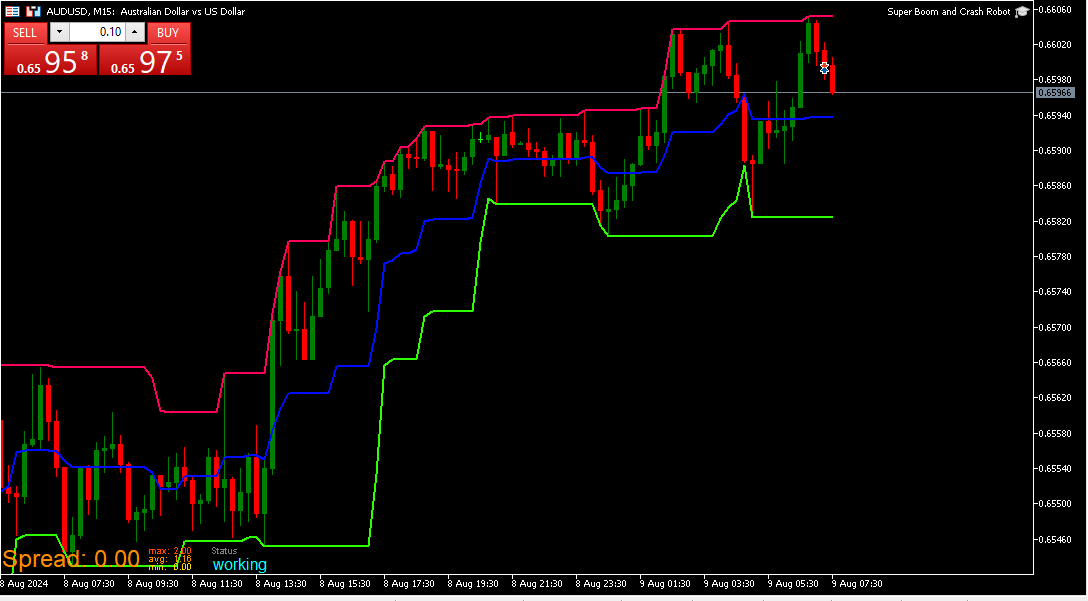
BBZ Donchain Channel

The Donchian Channel Indicator I created is a powerful tool for analyzing price trends and volatility. By plotting the highest high and lowest low over a specified period, it helps identify potential breakout opportunities and trend reversals. This indicator is valuable for traders seeking to understand market dynamics and make informed decisions based on price movements. Its simplicity and effectiveness make it an essential addition to any trading strategy.
추천 제품
QuantumAlert Stoch Navigator is a free indicator available for MT4/MT5 platforms, its work is to provide "alerts" when the market is inside "overbought and oversold" regions in the form of "buy or sell" signals. This indicator comes with many customization options mentioned in the parameter section below, user can customise these parameters as needful. Join our   MQL5 group , where we share important news and updates. You are also welcome to join our private channel as well, contact me for the p
FREE
QuantumAlert CCI Navigator is a free indicator available for MT4/MT5 platforms, its work is to provide "alerts" when the market is inside "overbought and oversold" regions in the form of "buy or sell" signals. This indicator comes with many customization options mentioned in the parameter section below, user can customise these parameters as needful. Join our   MQL5 group , where we share important news and updates. You are also welcome to join our private channel as well, contact me for the pri
FREE
Fair Value Gap Scanner
Usiola Oluwadamilol Olagundoye
The Fair Value Gap Detector is a MetaTrader 5 indicator designed to identify and draw rectangles on the chart wherever fair value gaps (FVGs) are detected. Fair value gaps occur when there is a significant disparity between the current price and the fair value of an asset. These gaps can provide valuable insights into potential trading opportunities, as they often indicate overbought or oversold conditions in the market. Key Features: FVG Detection: The indicator utilizes a proprietary algorith
FREE
React Fibonacci Chart
Kim Yonghwa
4.88 (8)
기능 피보나치 리트레이스먼트 트레이딩을 위한 지표 1H, 4H, 1D 및 1W 중에서 선택한 이전 바를 기반으로 피보나치 차트가 그려집니다. 시장 가격이 피보나치 레벨에 닿으면 색상이 변경되고 닿은 시간이 표시됩니다. -23.6, 0, 23.6, 38.2, 50, 61.8, 76.4, 100 및 123.6 레벨에 피보나치 그래프가 그려지며, 바가 업데이트될 때마다 차트가 새로 고침됩니다. 변수 타임프레임: 1H, 4H, 1D 및 1W 중에서 선택한 타임프레임으로 피보나치 차트가 그려집니다. FiboWidth: 레벨의 두께를 결정합니다. FiboStyle: 피봇 레벨의 스타일을 설정합니다. TouchedColor: 닿았을 때 변경되는 색상입니다. 오류가 있거나 개선 사항이 있다면 의견을 남겨주세요. 평가는 개발자에게 큰 도움이 됩니다. 만족하셨다면 5성을 부여해 주시기 바랍니다.
FREE
Rule Plotter Scanner
Francisco Gomes Da Silva
모든 전략을 스캔하고 해당 자산의 모든 타임프레임에서 매수 및 매도 지점을 보여주는 스캐너를 가지고 싶어 해본 적이 있나요? 이것이 정확히 이 스캐너가 하는 일입니다. 이 스캐너는 프로그래밍이 필요하지 않은 전략 생성기인 Rule Plotter: 프로그래밍 없이 전략을 만드는 도구 에서 생성한 매수 및 매도 신호를 다양한 자산 및 타임프레임에서 실행하기 위해 설계되었습니다. Rule Plotter의 기본 전략은 양봉과 음봉뿐입니다. 이것은 Rule Plotter에 전략을 그리지 않으면 선택한 자산의 모든 타임프레임에서 봉의 색상을 보여줄 것입니다. 음봉이면 빨간색이고, 양봉이면 녹색입니다. 원하는 만큼 전략을 만드세요 기본 전략에 제한받지 마세요. Metatrader에서 사용 가능한 모든 지표를 사용하여 전통적인 전략을 만들거나 선호하는 지표를 사용하여 사용자 지정 전략을 만드세요. 이 스캐너는 Rule Plotter가 제공하는 것 중 일부에 불과하며 Rule Plotter의 보조
FREE
Pivot Point Fibo RSJ
JETINVEST
4.29 (17)
피봇 포인트 Fibo RSJ는 피보나치 비율을 사용하여 당일의 지지선과 저항선을 추적하는 지표입니다. 이 멋진 지표는 피보나치 비율을 사용하여 피벗 포인트를 통해 최대 7단계의 지지와 저항을 생성합니다. 가격이 작업의 가능한 진입/종료 지점을 인식할 수 있는 이 지원 및 저항의 각 수준을 어떻게 존중하는지 환상적입니다. 특징 최대 7단계 지원 및 7단계 저항 레벨의 색상을 개별적으로 설정 입력 피벗 유형 피벗 피보 RSJ1 = 피보 비율 1 계산 피벗 피보 RSJ2 = 피보 비율 2 계산 피벗 Fibo RSJ3 = Fibo 비율 3 계산 피벗 피보 클래식 = 클래식 피벗 계산 최소 피벗 수준 피벗 3 레벨 피벗 4 레벨 피벗 5 레벨 6단계 피벗 피벗 7 레벨 여전히 질문이 있는 경우 다이렉트 메시지로 저에게 연락하십시오: https://www.mql5.com/ko/users/robsjunqueira/
FREE
Note from Developer: This is the lite version of the Double TMA with Bands Indicator. I will be uploading a paid version that comes with alerts and on screen signal arrows built in. I will also be selling an EA based on this trading system once all backtesting and optimization have been completed. Unlock your trading potential with the Double TMA Indicator with Reversal Detection! Designed for swing and reversal trading, this versatile tool integrates two Triangular Moving Averages
FREE
Gatotkaca Support Resistance Trendline
Muhammad Irvan Hermawan
5 (2)
Gatotkaca Support Resistance Trendline Indicator is a simple indicator that detects support, resistance and trendlines. It will helps you find breakout momentum based on lines calculated by this indicator. This is conceptually based on fractals, but with customizable periods.  Compatible for any timeframes. You can customize how this indicator work by setting up the period input.
FREE
Trend Catcher with Alert MT5
Issam Kassas
4.63 (63)
트렌드 캐쳐: 알림 인디케이터와 함께 하는 트렌드 캐쳐 전략은 시장 트렌드와 잠재적인 진입 및 체크 포인트를 식별하는 데 도움이 되는 다목적 기술 분석 도구입니다. 이는 시장 상황에 적응하여 트렌드 방향을 명확하게 시각적으로 표현하는 동적 트렌드 캐쳐 전략을 제공합니다. 트레이더는 선호도와 위험 허용도에 맞게 매개변수를 사용자 정의할 수 있습니다. 이 인디케이터는 트렌드 식별을 지원하고 잠재적인 반전을 신호로 제공하며 트레일링 스탑 메커니즘으로 작동하며 실시간 경고를 제공하여 신속한 시장 대응을 돕습니다. 특징: - 트렌드 식별: 상승 트렌드와 하락 트렌드를 신호합니다. - 트렌드 반전: 양봉 색상이 상승에서 하락으로 변경되거나 그 반대의 경우 잠재적인 반전을 경고합니다. - 실시간 경고: 새로운 트렌드 식별을 위한 경고를 생성합니다. 추천사항: - 통화 및 페어: EURUSD, AUDUSD, XAUUSD 등... - 시간 프레임: H1. - 계정 유형: 모든 E
FREE
Basic Supply Demand MT5
Mehran Sepah Mansoor
4.89 (19)
기본 공급 수요 지표는 시장 분석을 향상시키고 모든 차트에서 주요 기회 영역을 식별하는 데 도움이 되도록 설계된 강력한 도구입니다. 직관적이고 사용하기 쉬운 인터페이스를 갖춘 이 무료 메타트레이더 지표는 공급 및 수요 영역을 명확하게 볼 수 있어 보다 정보에 입각한 정확한 거래 결정을 내릴 수 있습니다 /   무료 MT4 버전 이 지표에 대한 대시보드 스캐너: ( Basic Supply Demand Dashboard ) 특징 지표는 차트에서 공급 및 수요 영역을 자동으로 스캔하여 지루한 수동 분석이 필요하지 않습니다. 가장 가까운 공급 및 수요 구역까지의 남은 거리 그래픽 표시 공급 구역은 하나의 고유 한 색상으로 강조 표시되고 수요 구역은 다른 색상으로 표시되어 빠르고 정확한 해석이 용이합니다. 인디케이터는 가장 가까운 공급 또는 수요 구간과 차트상의 현재 가격 사이의 핍 단위 거리를 자동으로 계산하여 명확하고 정량화할 수 있는 기준을 제공합니다. 핍 단위의 거리가 차트에 명
FREE
Coral Indi
Dinh Duong Luong
Coral trend is   a trend-following indicator that is widely popular among FOREX traders . It is usually used as a confluence with other indicators. It uses combinations of moving averages with complex smoothing formulas! It has two configurable parameters: Coefficient   - smoothing ratio (*) Applied price Calculation: Coral = (-0.064) * B6 + 0.672 * B5 - 2.352 * B4 + 2.744 * B3
FREE
Large Price MT5
Nino Guevara Ruwano
For traders, monitoring price movements is a constant activity, because each price movement determines the action that must be taken next. This simple indicator will helps traders to display prices more clearly in a larger size. Users can set the font size and choose the color that will be displayed on the chart. There are three color options that can be selected to be displayed on the chart.
FREE
BoS CHoCH FVG Indicator
Usiola Oluwadamilol Olagundoye
4.33 (6)
YouTube Channel:   https://www.youtube.com/@trenddaytrader FREE EA   for   GOLD , Anticipation   can be found here: https://www.mql5.com/en/market/product/123143 The Expert Advisor for this Indicator can be found here:  https://www.mql5.com/en/market/product/115476 The Break of Structure (BoS) and Change of Character indicator with Fair Value Gap (FVG) filter is a specialized tool designed to enhance trading strategies by pinpointing high-probability trading opportunities on price charts. B
FREE
The trendlines with breaks indicator return pivot point based trendlines with highlighted breakouts. Users can control the steepness of the trendlines as well as their slope calculation method. Trendline breakouts occur in real-time and are not subject to backpainting. Trendlines can however be subject to repainting unless turned off from the user settings. The indicator includes integrated alerts for trendline breakouts. Any valid trendlines methodology can be used with the indicator, u
FREE
Pivot Points Daily
Davide Zunino
4.67 (3)
The Indicator show Daily Pivot Points. It is possible to specify the number of days to display. For forex it doesn't consider the sunday session data. It is possibile to modify the color, style and  width for every level. It is better to use this indicator with timeframe not higher than Н1. 4 Levels of support and resistance with also Intermediate Levels that is possible to hide.
FREE
Free automatic Fibonacci is an indicator that automatically plots a Fibonacci retracement based on the number of bars you select on the BarsToScan setting in the indicator. The Fibonacci is automatically updated in real time as new highest and lowest values appears amongst the selected bars. You can select which level values to be displayed in the indicator settings. You can also select the color of the levels thus enabling the trader to be able to attach the indicator several times with differe
FREE
Pivot Reversal Free
Fyodor Korotkov
5 (1)
Hi there! Since I am starting commercial and non-commercial product publishing I would highly appreciate: If you like this product, please rate it. That will help to promote not only this product, but indirectly another ones. So, such promotion will help to make some money from commercial products. Thus, I will have opportunity to fund my another directions of trading researches like bot development using mql4 and mql5 programming languages as well as python written products like crypto bots. If
FREE
Japan CandleStick Patterns
Nguyen Duc Quy
3.67 (3)
Japanese candlestick analysis has been in existence for hundreds of years and is a valid form of technical analysis. Candlestick charting has its roots in the militaristic culture that was prevalent in Japan in the 1700s. One sees many terms throughout the Japanese literature on this topic that reference military analogies, such as the Three White Soldiers pattern Unlike more conventional charting methods, candlestick charting gives a deeper look into the mind-set of investors, helping to establ
FREE
High Trend Lite MT5
Evgeniy Scherbina
5 (1)
The indicator High Trend Lite monitors 5 symbols in up to 3 timeframes simultaneously and calculates the strength of their signals. The indicator notifies you when a signal is the same in different timeframes. The indicator can do this from just one chart. Therefore, High Trend Lite is a multicurrency and multitimeframe indicator. With the High Trend Pro , available at this link , you will have an unlimited number of symbols, 4 timeframes, a colourful chart of the primary MACD indicator, several
FREE
Projected Volume
Fernando Lahude Ritter
Volume Projection Indicator The Volume Projection Indicator is a specialized tool designed for traders who focus on the relationship between volume and price action. This intuitive indicator projects the expected volume for the ongoing candle, aiding in decision-making during live market conditions. The indicator presents volume data in a histogram format directly on the chart for quick analysis. Features: Bullish Volume Representation : Each green bar in the histogram signifies the volume for a
FREE
Value Chart Candlesticks
Flavio Javier Jarabeck
4.7 (10)
The idea of a Value Chart indicator was presented in the very good book I read back in 2020 , " Dynamic Trading Indicators: Winning with Value Charts and Price Action Profile ", from the authors Mark Helweg and David Stendahl. The idea is simple and the result is pure genius: Present candlestick Price analysis in a detrended way! HOW TO READ THIS INDICATOR Look for Overbought and Oversold levels. Of course, you will need to test the settings a lot to find the "correct" one for your approach.
FREE
Nexus Breakout line
Mohammed Kaddour
INTRODUCTION : The breakout strength meter is a trading tool that is used to identify which currencies are the strongest to breakout, and which currencies are the weakest to breakout. The settings for the indicator are easy, and if you cannot find the settings, please leave a comment The tools are completely free to use Please, if you like the indicator, please leave a comment and rate the indicator in order to develop it
FREE
Wave Box Market Frenquency
Jean Jacques Huve Ribeiro
4.75 (4)
Totally linked to the result of a movement and the duration he had. Its height records how many ticks the asset walked during a given movement, its width shows us the duration that movement had. Its configuration must be in line with the Weis Wave Indicator configuration to observe the movement force and can indicate a possible accumulation or distribution of the movement;
FREE
One of the simplest Pivot Point indicator, easy to operate, and most complete for a single chart in determining    Resistance   and   Support  level lines. In single chart,  it will show R&S Level Line with 5 popular types of Pivot Point, Highest&Lowest of closing price Include the Trend and up to 3 Time Frames. Five   types   (Floor, Woodie, Camarilla, DeMark, & Fibonacci)   of popular   Pivot Points   in determining   Resistance   and   Support   levels. With just using simple button on th
FREE
SuperTrend TV
Tran Nhat Minh
5 (2)
Original supertrend indicator in Tradingview platform.  Indicator type: Price Action indicator Introduction:   The Supertrend Indicator - Enhancing Your Trend Analysis.  If you haven't yet found a Supertrend indicator with good graphics on the MQL5 platform, this is the indicator for you. Overview:   The Supertrend Indicator is a powerful tool designed to provide traders with valuable insights into the current and historical trends of financial markets. It serves as a valuable addition to any t
FREE
RSI with alerts BDA
Laron Demetris Burrows
4.93 (14)
이 알고리즘은 86%*정확도로 단기간의 가격 변화를 예측합니다. 과매수 또는 과매도 상태인 경우,이 표시기가 사용자에게 알립니다. 가격이 신호 촛불보다 높거나 낮은 경우 예측한다. 더 큰 시간 프레임에 평균 복귀 거래,바이너리 옵션 또는 선물 계약에 적합합니다. 이 지표는 5 년간의 데이터에 대해 백 테스트되었으며 시간 경과에 따른 가격 반전을 예측하는 데 90%의 정확도가 있습니다. 특징:: 간단한 설정 모든 차트로 드래그 앤 드롭 원하는대로 매개 변수 조정(선택 사항) 경고 사용(선택 사항) 그리고 당신은 완료! 시각 및 오디오 경고 휴대 전화로 직접 전송 경고 터미널로 전송 된 팝업 알림 높은 승률 거래의 90%까지 승리 백 테스트 5 년 여러 통화. (백 테스트 세부 정보 및 분석은 웹 사이트를 참조하십시오). 많은 수의 신호 기대 1 에 2 기호 당 하루 신호*. 당신이 표시가있는 경우*이입니다 30 분 촛불. 유연한 외환,지수,상품 및 주식에서 작동합니다. 어떤
FREE
Macd ema crossover signals
Mattijs Roelof Jacob Nugteren
Indicator Description: MACD EMA Crossover The MACD EMA Crossover is a powerful MetaTrader 5 (MT5) indicator designed to generate trading signals based on the crossovers between the Moving Average Convergence Divergence (MACD) and the Exponential Moving Average (EMA). This indicator assists traders in identifying opportune buy and sell signals, with a specific focus on trend reversals. Features: 1. MACD Crossing Below the 0 Line (Buy Signal):    - When the MACD line crosses the signal li
FREE
This is a tick indicator which compares the current bid price with the previous bid directly before it, and draws candles based on a comparison of the current ticks. It does not use historical ticks. Everything happens in real time, data moves from right to left, and the newest data arrives at the right. A trend line can be added which points in the direction of the price shifts.
FREE
Trend Range Indicator
Claudius Marius Walter
5 (1)
Introduction Poppsir is a trend-range indicator for metatrader 5 (for now), which distinguishes sideways phases from trend phases. With this tool it is possible to design a trend following-, meanreversion-, as well as a breakout strategy. This indicator does not repaint! The signal of the Poppsir indicator is quite easy to determine. As soon as the RSI and Popsir change their respective color to gray, a breakout takes place or in other words, the sideways phase has ended. Interpret
FREE
WH Price Wave Pattern MT5
Wissam Hussein
4 (9)
FREE
이 제품의 구매자들이 또한 구매함
TPSpro RFI Levels MT5
Roman Podpora
4.73 (11)
지침         러시아   -        영어       표시기와 함께 사용하는 것이 좋습니다   .       -       TPSpro   트렌드 프로 -   MT4 버전         거래에서 핵심 요소는 거래 상품을 매수 또는 매도하기로 결정하는 구역 또는 수준입니다. 주요 업체가 시장에서 자신의 존재를 숨기려는 시도에도 불구하고, 그들은 필연적으로 흔적을 남깁니다. 우리의 과제는 이러한 흔적을 식별하고 올바르게 해석하는 방법을 배우는 것이었습니다. 주요 기능:: 판매자와 구매자를 위한 활성 영역을 표시합니다! 이 지표는 매수 및 매도를 위한 모든 올바른 초기 임펄스 레벨/존을 보여줍니다. 진입점 검색이 시작되는 이러한 레벨/존이 활성화되면 레벨의 색상이 바뀌고 특정 음영으로 채워집니다. 또한 상황을 보다 직관적으로 이해하기 위해 화살표가 나타납니다. 더 높은 시간대의 레벨/존 표시(MTF 모드) 더 높은 시간 간격을 사용하여 레벨/존을 표시하는 기능을 추가했습니다.
TPSproTREND PrO MT5
Roman Podpora
4.89 (9)
TPSpro TREND PRO  - is a trend indicator that automatically analyzes the market and provides information about the trend and each of its changes, as well as giving signals for entering trades without redrawing! The indicator uses each candle, analyzing them separately. referring to different impulses - up or down impulse. Exact entry points into transactions for currencies, crypto, metals, stocks, indices!  Version MT4               DETAILED DESCRIPTION               R ecommended to use with an
우선 이 거래 시스템이 리페인팅, 리드로잉 및 레이그 인디케이터가 아니라는 점을 강조하는 것이 중요합니다. 이는 수동 및 로봇 거래 모두에 이상적인 것으로 만듭니다. 온라인 강좌, 설명서 및 프리셋 다운로드. "스마트 트렌드 트레이딩 시스템 MT5"은 새로운 및 경험이 풍부한 트레이더를 위해 맞춤형으로 제작된 종합적인 거래 솔루션입니다. 10개 이상의 프리미엄 인디케이터를 결합하고 7개 이상의 견고한 거래 전략을 특징으로 하여 다양한 시장 조건에 대한 다목적 선택이 가능합니다. 트렌드 추종 전략: 효과적인 트렌드 추이를 타기 위한 정확한 진입 및 손절 관리를 제공합니다. 반전 전략: 잠재적인 트렌드 반전을 식별하여 트레이더가 범위 시장을 활용할 수 있게 합니다. 스캘핑 전략: 빠르고 정확한 데이 트레이딩 및 단기 거래를 위해 설계되었습니다. 안정성: 모든 인디케이터가 리페인팅, 리드로잉 및 레이그가 아니므로 신뢰할 수 있는 신호를 보장합니다. 맞춤화: 개별 거래 선호도를 고려한 맞춤
Atbot
Zaha Feiz
4.91 (35)
AtBot: 작동 방식 및 사용 방법 ### 작동 방식 MT5 플랫폼용 "AtBot" 지표는 기술 분석 도구의 조합을 사용하여 매수 및 매도 신호를 생성합니다. 01:37 단순 이동 평균(SMA), 지수 이동 평균(EMA), 평균 진폭 범위(ATR) 지수를 통합하여 거래 기회를 식별합니다. 또한 Heikin Ashi 캔들을 사용하여 신호의 정확성을 향상시킬 수 있습니다. 구매 후 리뷰를 남기면 특별 보너스 선물을 받게 됩니다. ### 주요 기능: - 비재표시: 신호는 플로팅 후 변경되지 않습니다. - 비재작성: 신호는 일관되며 변경되지 않습니다. - 지연 없음: 지연 없이 시기적절한 신호를 제공합니다. - 다양한 시간대: 거래 전략에 맞게 모든 시간대에서 사용할 수 있습니다. ### 운영 단계: #### 입력 및 설정: - firstkey (TrendValue): 추세 감지의 민감도를 조정합니다. - Secondkey (SignalValue): 매수/매도 신호 생성의 민감도를 정의
Atomic Analyst MT5
Issam Kassas
4.42 (19)
우선적으로 언급할 점은이 거래 지표가 다시 그리지 않고 지연되지 않으며 이를 통해 수동 및 로봇 거래 모두에 이상적이라는 점입니다. 사용자 매뉴얼: 설정, 입력 및 전략. Atomic Analyst는 가격의 강도와 모멘텀을 활용하여 시장에서 더 나은 이점을 찾는 PA Price Action Indicator입니다. 고급 필터를 장착하여 잡음과 거짓 신호를 제거하고 거래 잠재력을 높이는 데 도움이 됩니다. 복잡한 지표의 다중 레이어를 사용하여 Atomic Analyst는 차트를 스캔하고 복잡한 수학적 계산을 간단한 신호와 색상으로 변환하여 초보 트레이더가 이해하고 일관된 거래 결정을 내릴 수 있도록합니다. "Atomic Analyst"는 새로운 및 경험이 풍부한 트레이더를위한 종합적인 거래 솔루션입니다. 프리미엄 지표와 최고 수준의 기능을 하나의 거래 전략에 결합하여 모든 종류의 트레이더에 대한 다재다능한 선택지가되었습니다. 인트라데이 거래 및 스캘핑 전략 : 빠르고 정확한
Gold Stuff mt5
Vasiliy Strukov
4.92 (165)
Gold Stuff mt5는 금을 위해 특별히 설계된 추세 지표이며 모든 금융 상품에서도 사용할 수 있습니다. 표시기가 다시 그려지지 않고 지연되지 않습니다. 권장 기간 H1. 설정 및 개인 보너스를 받으려면 구매 후 즉시 저에게 연락하십시오!     강력한 지원 및 트렌드 스캐너 표시기의 무료 사본을 받으실 수 있습니다. 메시지를 보내주세요. 나!   설정 화살표 그리기 - 켜기 끄기. 차트에 화살표 그리기. 경고 - 가청 경고를 끕니다. 이메일 알림 - 켜기 끄기. 이메일 알림. Puch-notification - 켜기 끄기. 푸시 알림. 다음으로 색 영역을 조정합니다. Gold Stuff mt5는 금을 위해 특별히 설계된 추세 지표이며 모든 금융 상품에서도 사용할 수 있습니다. 표시기가 다시 그려지지 않고 지연되지 않습니다. 권장 기간 H1. 설정 및 개인 보너스를 받으려면 구매 후 즉시 저에게 연락하십시오!   설정 화살표 그리기 - 켜기 끄기. 차트에
FX Power MT5 NG
Daniel Stein
5 (5)
모닝 브리핑 여기 mql5 와 텔레그램에서 FX Power MT5 NG 는 오랫동안 인기 있는 통화 강도 측정기인 FX Power의 차세대 버전입니다. 이 차세대 강도 측정기는 무엇을 제공합니까? 기존 FX Power에서 좋아했던 모든 것 PLUS GOLD/XAU 강도 분석 더욱 정밀한 계산 결과 개별 구성 가능한 분석 기간 더 나은 성능을 위한 사용자 정의 가능한 계산 한도 특별 멀티더 많은 것을보고 싶은 사람들을위한 특별한 다중 인스턴스 설정 모든 차트에서 좋아하는 색상을위한 끝없는 그래픽 설정 수많은 알림 옵션, 중요한 것을 다시는 놓치지 않도록 Windows 11 및 macOS 스타일의 둥근 모서리가 있는 새로운 디자인 마법처럼 움직이는 인디케이터 패널 FX 파워 키 특징 모든 주요 통화의 완전한 강세 이력 모든 시간대에 걸친 통화 강세 이력 모든 브로커 및 차트에서 고유 계산 결과 100% 신뢰할 수있는 실시간100 % 신뢰할 수있는 실시간 계산-> 다시 칠하지 않음
Quantum Trend Sniper
Bogdan Ion Puscasu
4.8 (49)
소개       Quantum Trend Sniper Indicator는   추세 반전을 식별하고 거래하는 방식을 변화시키는 획기적인 MQL5 지표입니다! 13년 이상의 거래 경험을 가진 숙련된 트레이더 팀이 개발한       Quantum Trend Sniper 표시기       매우 높은 정확도로 추세 반전을 식별하는 혁신적인 방법으로 거래 여정을 새로운 차원으로 끌어올리도록 설계되었습니다. ***Quantum Trend Sniper Indicator를 구입하면 Quantum Breakout Indicator를 무료로 받을 수 있습니다!*** Quantum Trend Sniper Indicator는 추세 반전을 식별하고 세 가지 이익실현 수준을 제안할 때 경고, 신호 화살표를 제공합니다. 초보자 거래자와 전문 거래자 모두에게 적합합니다. Quantum EA 채널:       여기를 클릭하세요 MT4 버전:       여기를 클릭하세요
Trend Screener Pro MT5
STE S.S.COMPANY
4.87 (63)
트렌드 표시기, 트렌드 트레이딩 및 필터링을 위한 획기적인 고유 솔루션, 하나의 도구 안에 내장된 모든 중요한 트렌드 기능! Forex, 상품, 암호 화폐, 지수 및 주식과 같은 모든 기호/도구에 사용할 수 있는 100% 다시 칠하지 않는 다중 시간 프레임 및 다중 통화 표시기입니다. Trend Screener는 차트에 점이 있는 화살표 추세 신호를 제공하는 효율적인 지표 추세 추종 지표입니다. 추세 분석기 표시기에서 사용할 수 있는 기능: 1. 트렌드 스캐너. 2. 최대 이익 분석이 있는 추세선. 3. 추세 통화 강도 측정기. 4. 경고가 있는 추세 반전 점. 5. 경고가 있는 강력한 추세 점. 6. 추세 화살표 Trend Screener Indicator가 있는 일일 분석 예, 일일 신호 성능...등은 여기에서 찾을 수 있습니다. 여기를 클릭하십시오. LIMITED TIME OFFER : Trend Screener Indicator는 50$ 및 평생 동안만 사용할 수 있습니다
우선적으로, 이 거래 도구는 전문적인 거래에 이상적인 비-다시 그리기 및 지연되지 않는 지표입니다.  온라인 강좌, 사용자 매뉴얼 및 데모. 스마트 가격 액션 컨셉트 인디케이터는 신규 및 경험 많은 트레이더 모두에게 매우 강력한 도구입니다. Inner Circle Trader Analysis 및 Smart Money Concepts Trading Strategies와 같은 고급 거래 아이디어를 결합하여 20가지 이상의 유용한 지표를 하나로 결합합니다. 이 인디케이터는 스마트 머니 컨셉트에 중점을 두어 대형 기관의 거래 방식을 제공하고 이동을 예측하는 데 도움을 줍니다.  특히 유동성 분석에 뛰어나 기관이 어떻게 거래하는지 이해하는 데 도움을 줍니다. 시장 트렌드를 예측하고 가격 변동을 신중하게 분석하는 데 탁월합니다. 귀하의 거래를 기관 전략에 맞추어 시장의 동향에 대해 더 정확한 예측을 할 수 있습니다. 이 인디케이터는 시장 구조를 분석하고 중요한 주문 블록을 식별하
AT Forex Indicator MT5
Marzena Maria Szmit
5 (4)
The AT Forex Indicator MT5 is a sophisticated trading tool designed to provide traders with a comprehensive analysis of multiple currency pairs. This powerful indicator simplifies the complex nature of the forex market, making it accessible for both novice and experienced traders. AT Forex Indicator uses advanced algorithms to detect trends, patterns and is an essential tool for traders aiming to enhance their forex trading performance. With its robust features, ease of use, and reliable signal
TrendMaestro5
Stefano Frisetti
note: this indicator is for METATRADER4, if you want the version for METATRADER5 this is the link:  https://www.mql5.com/it/market/product/108106 TRENDMAESTRO ver 2.4 TRENDMAESTRO recognizes a new TREND in the bud, he never makes mistakes. The certainty of identifying a new TREND is priceless. DESCRIPTION TRENDMAESTRO identifies a new TREND in the bud, this indicator examines the volatility, volumes and momentum to identify the moment in which there is an explosion of one or more of these data a
이 대시보드는 선택한 심볼에 대해 사용 가능한 최신 고조파 패턴을 표시하므로 시간을 절약하고 더 효율적으로 사용할 수 있습니다 /   MT4 버전 . 무료 인디케이터:   Basic Harmonic Pattern 인디케이터 열 Symbol :   선택한 심볼이 나타납니다 Trend :   강세 또는 약세 Pattern :   패턴 유형(가틀리, 나비, 박쥐, 게, 상어, 사이퍼 또는 ABCD) Entry :   진입 가격 SL:   스톱로스 가격 TP1:   1차 테이크프로핏 가격 TP2:   2차 테이크프로핏 가격 TP3:   3차 테이크프로핏 가격 Current price:   현재 가격 Age (in bars):   마지막으로 그려진 패턴의 나이 주요 입력 Symbols :   "28개 주요 통화쌍" 또는 "선택한 심볼" 중에서 선택합니다. Selected Symbols :   쉼표로 구분하여 모니터링하려는 원하는 심볼("EURUSD,GBPUSD,XAUUSD")
Entry Points Pro for MT5
Yury Orlov
4.46 (124)
다시 색을 칠하지 않고 거래에 진입할 수 있는 정확한 신호를 제공하는 MT5용 지표입니다. 외환, 암호화폐, 금속, 주식, 지수 등 모든 금융 자산에 적용할 수 있습니다. 매우 정확한 추정값을 제공하고 매수와 매도의 가장 좋은 시점을 알려줍니다. 하나의 시그널로 수익을 내는 지표의 예와 함께 비디오 (6:22)시청하십시오! 대부분의 거래자는 Entry Points Pro 지표의 도움으로 첫 거래 주 동안 트레이딩 결과를 개선합니다. 저희의   Telegram Group 을 구독하세요! Entry Points Pro 지표의 좋은점. 재도색이 없는 진입 신호 신호가 나타나고 확인되면(시그널 캔들이 완성된 경우) 신호는 더 이상 사라지지 않습니다. 여타 보조지표의 경우 신호를 표시한 다음 제거되기 때문에 큰 재정적 손실로 이어집니다. 오류 없는 거래 게시 알고리즘을 통해 트레이드(진입 또는 청산)를 할 이상적인 순간을 찾을 수 있으며, 이를 통해 이를 사용하는 모든 거래자의
FxaccurateLS
Shiv Raj Kumawat
WHY IS OUR FXACCCURATE LS MT5 THE PROFITABLE ? PROTECT YOUR CAPITAL WITH RISK MANAGEMENT Gives entry, stop and target levels from time to time. It finds Trading opportunities by analyzing what the price is doing during established trends. POWERFUL INDICATOR FOR A RELIABLE STRATEGIES We have made these indicators with a lot of years of hard work. It is made at a very advanced level. Established trends provide dozens of trading opportunities, but most trend indicators completely ignore them!
Advanced Supply Demand MT5
Bernhard Schweigert
4.5 (14)
현재 33% 할인! 초보자나 전문 트레이더를 위한 최고의 솔루션! 이 보조지표는 우리가 다수의 독창적 기능과 새로운 공식을 통합한 독특하고 고품질이며 저렴한 거래 도구입니다. 이 업데이트를 통해 이중 시간대를 표시할 수 있습니다. 더 높은 TF를 표시할 수 있을 뿐만 아니라 차트 TF와 더 높은 TF 모두를 표시할 수 있습니다: 중첩 영역 표시. 모든 Supply Demand 트레이더들이 좋아할 것입니다. :) 중요한 정보 공개 Advanced Supply Demand의 잠재력을 극대화하려면 다음을 방문하십시오. https://www.mql5.com/ko/blogs/post/720245   진입 또는 목표의 명확한 트리거 포인트를 정확히 찾아냄으로 해서 거래가 어떻게 개선될지 상상해 보십시오. 새로운 알고리즘을 기반으로 매수자와 매도자 간의 잠재적인 불균형을 훨씬 더 쉽게 분간할 수 있습니다. 왜냐하면 가장 강한 공급영역과 가장 강한 수요 영역과 과거에 어떻게 진행 되었는지를(이
ATrend
Zaha Feiz
4.8 (5)
ATREND: 작동 방식 및 사용 방법 ### 작동 방식 MT5 플랫폼을 위한 "ATREND" 지표는 기술 분석 방법론의 조합을 활용하여 트레이더에게 강력한 매수 및 매도 신호를 제공하도록 설계되었습니다. 이 지표는 주로 변동성 측정을 위해 평균 진폭 범위(ATR)를 활용하며, 잠재적인 시장 움직임을 식별하기 위한 트렌드 탐지 알고리즘과 함께 사용됩니다. 구매 후 메시지를 남기면 특별 보너스 선물을 받게 됩니다. 30달러에 8부 남았습니다. ### 주요 특징: - 동적 트렌드 탐지: 이 지표는 시장 트렌드를 평가하고 신호를 조정하여 트레이더가 현재 시장 상황에 맞춰 전략을 조정할 수 있도록 돕습니다. - 변동성 측정: ATR을 사용하여 시장의 변동성을 측정하며, 이는 최적의 손절매(SL) 및 이익 실현(TP) 수준을 결정하는 데 중요합니다. - 신호 시각화: 이 지표는 차트에 매수 및 매도 신호를 시각적으로 표시하여 트레이더의 의사 결정을 향상시킵니다. ### 운영 단계 ###
TPA True Price Action indicator reveals the true price action of the market makers through 100% non-repainting signals strictly at the close of a candle! TPA shows entries and re-entries, every time the bulls are definitely stronger than the bears and vice versa. Not to confuse with red/green candles. The shift of power gets confirmed at the earliest stage and is ONE exit strategy of several. There are available now two free parts of the TPA User Guide for our customers. The first "The Basics"
ICT, SMC, 스마트 머니 컨셉트(Smart Money Concept), 지지 및 저항(Support and Resistance), 추세 분석(Trend Analysis), 가격 행동(Price Action), 시장 구조(Market Structure), 주문 블록(Order Blocks), 브레이커 블록(Breaker Blocks), 모멘텀 변화(Momentum Shift), 강한 불균형(Strong Imbalance), HH/LL/HL/LH, 공정 가치 격차(Fair Value Gap), FVG, 프리미엄 및 디스카운트 영역(Premium & Discount Zones), 피보나치 리트레이스먼트(Fibonacci Retracement), OTE, 매수 측 유동성(Buyside Liquidity), 매도 측 유동성(Sellside Liquidity), 유동성 공백(Liquidity Voids), 시장 세션(Market Sessions), NDOG, NWOG, 실버 불릿(Silv
Blahtech Supply Demand MT5
Blahtech Limited
4.54 (13)
Was: $299  Now: $99   Supply Demand uses previous price action to identify potential imbalances between buyers and sellers. The key is to identify the better odds zones, not just the untouched ones. Blahtech Supply Demand indicator delivers functionality previously unavailable on any trading platform. This 4-in-1 indicator not only highlights the higher probability zones using a multi-criteria strength engine, but also combines it with multi-timeframe trend analysis, previously confirmed swings
Auto Order Block with break of structure based on ICT and Smart Money Concepts (SMC) Futures Break of Structure ( BoS )             Order block ( OB )            Higher time frame Order block / Point of Interest ( POI )    shown on current chart           Fair value Gap ( FVG ) / Imbalance   -  MTF      ( Multi Time Frame )    HH/LL/HL/LH  -  MTF      ( Multi Time Frame )  Choch  MTF      ( Multi Time Frame )  Volume Imbalance     ,  MTF          vIMB Gap’s Power of 3 Equal High
ICT, SMC, SMART MONEY CONCEPTS, SMART MONEY, Smart Money Concept, Support and Resistance, Trend Analysis, Price Action, Market Structure, Order Blocks, BOS/CHoCH,   Breaker Blocks ,  Momentum Shift,   Supply&Demand Zone/Order Blocks , Strong Imbalance,   HH/LL/HL/LH,    Fair Value Gap, FVG,  Premium  &   Discount   Zones, Fibonacci Retracement, OTE, Buy Side Liquidity, Sell Side Liquidity, BSL/SSL Taken, Equal Highs & Lows, MTF Dashboard, Multiple Time Frame, BigBar, HTF OB, HTF Market Structure
IX Power MT5
Daniel Stein
4.17 (6)
IX Power는   마침내 FX Power의 탁월한 정밀도를 외환이 아닌 기호에도 적용했습니다. 좋아하는 지수, 주식, 원자재, ETF, 심지어 암호화폐까지 단기, 중기, 장기 추세의 강도를 정확하게 파악할 수 있습니다. 단말기가 제공하는   모든 것을 분석할   수 있습니다. 사용해 보고 트레이딩   타이밍이 크게 향상되는   것을 경험해 보세요. IX Power 주요 특징 단말기에서 사용 가능한 모든 거래 심볼에 대해 100% 정확한 비재도장 계산 결과 제공 사전 구성 및 추가적으로 개별 구성 가능한 강도 분석 기간의 드롭다운 선택 가능 이메일, 메시지, 모바일 알림을 통한 다양한 알림 옵션 제공 EA 요청을 위한 액세스 가능한 버퍼 더 나은 성능을 위한 사용자 지정 가능한 계산 한도 더 많은 것을 보고 싶은 사용자를 위한 특별 다중 인스턴스 설정 모든 차트에서 좋아하는 색상을 위한 무한한 그래픽 설정 가능 Windows 11 및 macOS 스타일의 둥
The 1 2 3 Pattern Scanner MT5
Reza Aghajanpour
5 (18)
** All Symbols x All Timeframes scan just by pressing scanner button ** *** Contact me  to send you instruction and add you in "123 scanner group" for sharing or seeing experiences with other users. After 17 years of experience in the markets and programming, Winner indicator is ready. I would like to share with you! Introduction The 123 Pattern Scanner indicator with a special enhanced algorithm is a very repetitive common pattern finder with a high success rate . Interestingly, this Winner in
Black Dragon indicator mt5
Ramil Minniakhmetov
4.81 (54)
추세 감지 표시기는 모든 전략을 보완하며 독립적인 도구로도 사용할 수 있습니다.   장점 사용하기 쉽고 불필요한 정보로 차트에 과부하가 걸리지 않습니다. 모든 전략에 대한 필터로 사용할 수 있습니다. 기본 제공 수준의 동적 지원 및 저항이 있어 이익을 얻고 손절매를 설정하는 데 모두 사용할 수 있습니다. 촛대가 닫힌 후에도 표시기는 색상을 변경하지 않습니다.  주식 시장, 지수, 석유, 금 및 모든 시간대에서 작동합니다. 토스트 알림, 이메일 알림, 푸시 알림 및 소리 알림 기능이 있습니다. 내 다른 개발은 여기에서 찾을 수 있습니다:   https://www.mql5.com/ko/users/mechanic/seller 입력 매개변수 Alert - 켜기/끄기. 알리다; Push Notification - 켜기/끄기. 푸시 알림; Mail - 켜기/끄기 이메일 알림; Fibo 1,2,3,4,5,6,7,11,21,31,41,51,61,71 - 동적 지원 및 저항 수준 설정.
XQ Indicator MetaTrader 5
Marzena Maria Szmit
3 (2)
Step into the realm of Forex trading with confidence and precision using XQ, a cutting-edge Forex indicator designed to elevate your trading game to unprecedented heights. Whether you're a seasoned trader or just stepping into the world of currency exchange, XQ Forex Indicator empowers you with the insights and signals needed to make informed trading decisions. The signal conditions are a combination of three indicators, and XQ Forex Indicator only display  medium and long-term trends . The ind
FX Volume MT5
Daniel Stein
4.93 (14)
모닝 브리핑을 통해 세부 정보와 스크린샷으로 매일 시장 업데이트를 받으세요 여기 mql5 및 텔레그램에서 FX 거래량은 브로커의 관점에서 시장 심리에 대한 실제 통찰력을 제공하는 최초이자 유일한 거래량 지표입니다. 브로커와 같은 기관 시장 참여자가 외환 시장에서 어떤 포지션을 취하고 있는지에 대한 훌륭한 통찰력을 COT 보고서보다 훨씬 빠르게 제공합니다. 차트에서 이 정보를 직접 확인하는 것은 트레이딩의 진정한 판도를 바꾸고 획기적인 솔루션입니다. 다음과 같은 고유한 시장 데이터 인사이트의 이점 비율 는 통화의 매수/매도 포지션 비율을 백분율로 표시 비율 변화 는 선택한 기간 내 매수 비율과 비율 변화를 표시 총 거래량 는 해당 통화의 총 거래량(롱 및 숏)을 로트 단위로 보여줍니다 Volumes Long 는 해당 통화의 모든 롱 포지션의 거래량을 보여줍니다 Volumes Short 는 해당 통화의 모든 숏 포지션의 거래량을 보여줍니다 Net Long 는 순 롱 포지션의 거래량
Blahtech Market Profile MT5
Blahtech Limited
5 (9)
Was: $249  Now: $99   Market Profile defines a number of day types that can help the trader to determine market behaviour. A key feature is the Value Area, representing the range of price action where 70% of trading took place. Understanding the Value Area can give traders valuable insight into market direction and establish the higher odds trade. It is an excellent addition to any system you may be using. Inspired by Jim Dalton’s book “Mind Over Markets”, this indicator is designed to suit the
Gartley Hunter Multi
Siarhei Vashchylka
5 (8)
Gartley Hunter Multi - An indicator for searching for harmonic patterns simultaneously on dozens of trading instruments and on all possible timeframes. Manual (Be sure to read before purchasing) | Version for MT4 Advantages 1. Patterns: Gartley, Butterfly, Shark, Crab. Bat, Alternate Bat, Deep Crab, Cypher 2. Simultaneous search for patterns on dozens of trading instruments and on all possible timeframes 3. Search for patterns of all possible sizes. From the smallest to the largest 4. A
이 대시보드는 선택한 기호에 대한 거래 전략에 따라 스캘핑 모드와 장기 모드 모두에서 차트의 공급 및 수요 영역을 검색하고 표시합니다. 또한 대시보드의 스캐너 모드를 통해 원하는 모든 기호를 한눈에 확인하고 적합한 위치를 놓치지 않도록 도와줍니다 / MT4 버전 . 무료 보조지표:   Basic Supply Demand 특징 여러 통화쌍에 대한 거래 기회를 볼 수 있으며, 공급 및 수요 영역에 대한 근접성에 따라 순위가 매겨진 모든 쌍을 명확하고 간결하게 볼 수 있습니다. 색상부터 감지 매개변수까지 특정 요구에 맞게 사용자 지정 설정 가능 주요 입력 Indicator mode :   표시기 모드 또는 새로운 기능이 포함된 패널 모드 중에서 선택 가능 Symbols :   "28개 주요 통화쌍" 또는 "선택한 심볼" 중에서 선택 Selected Symbols :   쉼표로 구분하여 모니터링하려는 원하는 심볼("EURUSD, GBPUSD, XAUUSD")을 선택합
제작자의 제품 더 보기
Super Boom and Crash Robot
Onyekachi Franklin Agbo
1 (1)
The Super Boom and Crash Robot operates based on two key indicators: the Relative Strength Index (RSI) and the 200-period Moving Average (MA). It buys when the RSI is above 30, signaling potential for upward momentum, and the 200-period MA is positioned above the current price, indicating a bullish trend. Conversely, it sells when the RSI falls below 70, suggesting overbought conditions, and the 200-period MA is below the price, signaling a bearish trend. This strategy aims to capitalize on pric
FREE
ZZA Super Trade Assistant
Onyekachi Franklin Agbo
ZZA TRADE ASSISTANT  This ZAA trade assistant  indicator is very powerful. Here you can use this as your trading assistant . So while applying this use money management . This indicator can be use on 5 minutes timeframe, 15 minutes timeframe, 1 hour  minutes timeframe and above .  Try practice this on your demo account before using on real account . This indicator should apply on meta trader 5 .
Volume and Doji Strategy
Onyekachi Franklin Agbo
The "Visa + Doji Strategy EA" is a concept in automated trading that combines the principles of Visa and Doji candlestick patterns in its algorithm. Here's a detailed description: Visa Component**: This part of the strategy utilizes an analogy to the Visa payment system, symbolizing fast, reliable, and global transactions. In trading terms, it represents swift entry and exit points in the market, identifying opportunities with high potential and minimal delay. The Visa component may use indicat
"The Easiest 3 EMA Technique + Grid Scalping (High WinRate)" describes a specific strategy in the realm of financial trading, with a focus on simplicity and effectiveness. Let's break down the key components: 1. **3 EMA Technique**: EMA stands for Exponential Moving Average, a type of moving average that places a greater weight and significance on the most recent data points. The '3 EMA' likely refers to a technique that uses three different EMAs with varying time frames to identify potential
The Special Auto Trend Lines Trading Strategy is an advanced Forex EA robot that automates trend line analysis for trading decisions. It identifies trends, determines entry and exit points, and manages risk with precision. This automated approach enhances trading efficiency, reduces emotional biases, and aims for consistent profitability across various market conditions, making it a valuable tool for both novice and experienced traders alike.
필터:
리뷰 없음
리뷰 답변