GANN Master
- 지표
- Ivan Stefanov
- 버전: 1.3
- 업데이트됨: 22 9월 2024
- 활성화: 20
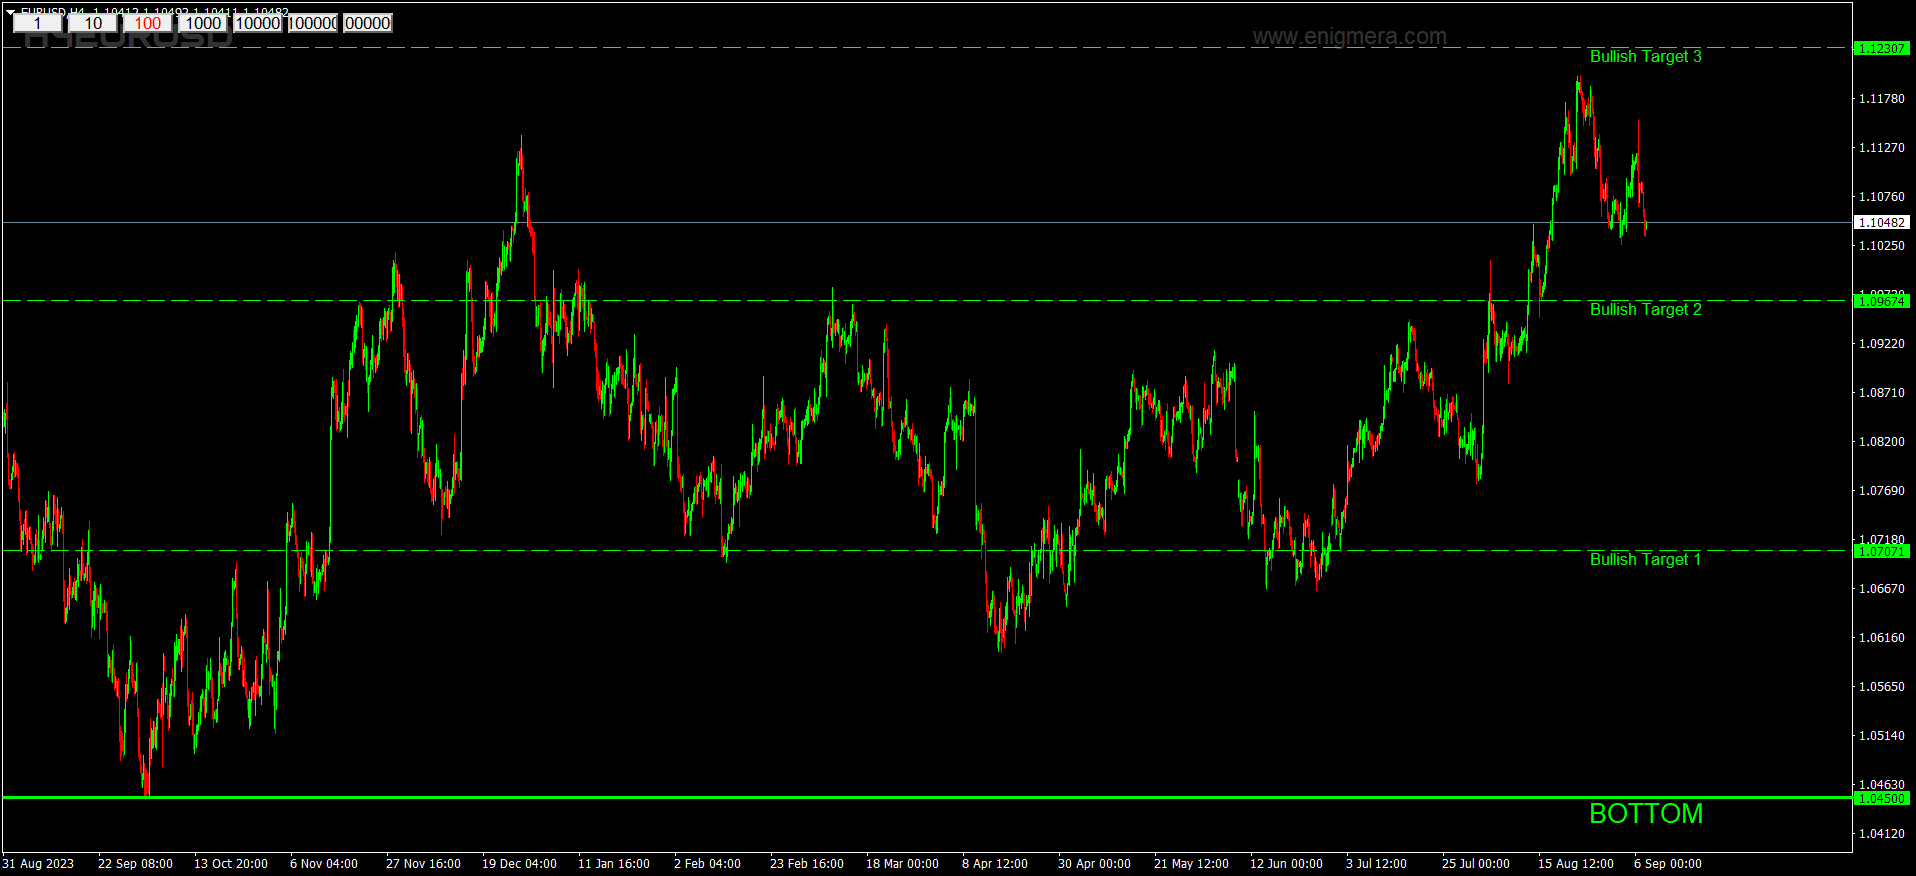
GANN의 정확한 목표는 그의 오랜 방법론에 따라 계산되어 눈앞에 제시됩니다. 이 도구는 거래를 더욱 쉽고 직관적으로 만들어줍니다. 흰 선을 위로 또는 녹색 선을 아래로 움직이면 GANN의 기법이 여전히 거래 세계에서 영향력 있는 이유를 즉시 알 수 있습니다.
GANN의 전략은 시장 움직임을 높은 정확도로 예측하는 데 중점을 두며, 이 도구는 그 힘을 여러분의 손끝에 전달합니다. 숙련된 트레이더든 초보자든, 선을 조작하면 그의 접근 방식이 왜 오랜 세월 동안 신뢰받았는지 깊이 이해할 수 있게 될 것입니다.
GANN의 정확한 목표는 그의 오랜 방법론에 따라 계산되어 눈앞에 제시됩니다. 이 도구는 거래를 더욱 쉽고 직관적으로 만들어줍니다. 흰 선을 위로 또는 녹색 선을 아래로 움직이면 GANN의 기법이 여전히 거래 세계에서 영향력 있는 이유를 즉시 알 수 있습니다.
GANN의 전략은 시장 움직임을 높은 정확도로 예측하는 데 중점을 두며, 이 도구는 그 힘을 여러분의 손끝에 전달합니다. 숙련된 트레이더든 초보자든, 선을 조작하면 그의 접근 방식이 왜 오랜 세월 동안 신뢰받았는지 깊이 이해할 수 있게 될 것입니다.