Opening Momentum
- 지표
- Claus Dietrich
- 버전: 24.7
- 활성화: 20
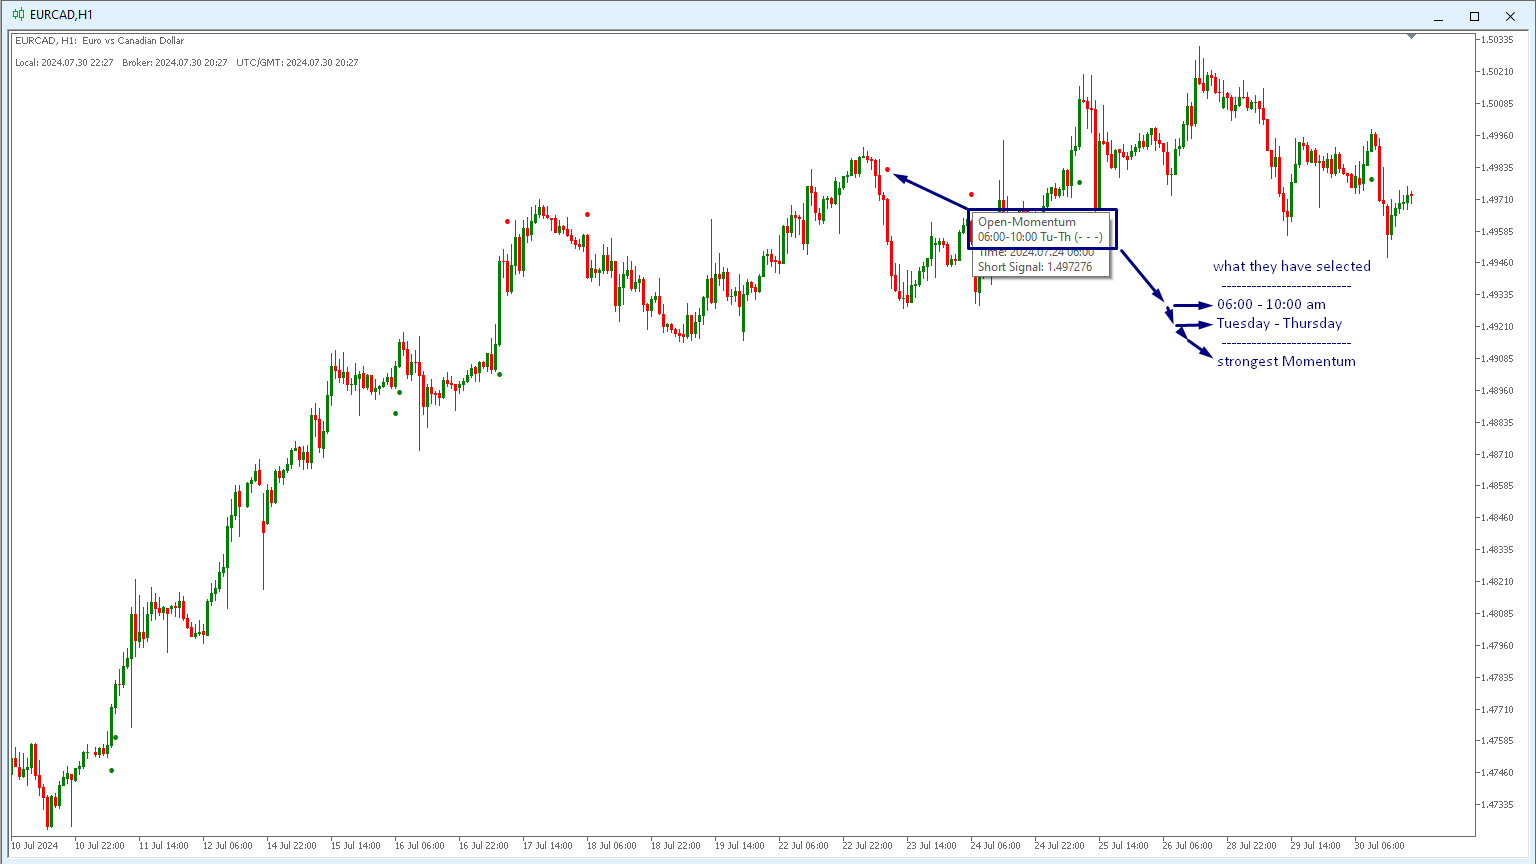
Optimized for Asia- London- US- Open-Session 🕗 🕑 🕝
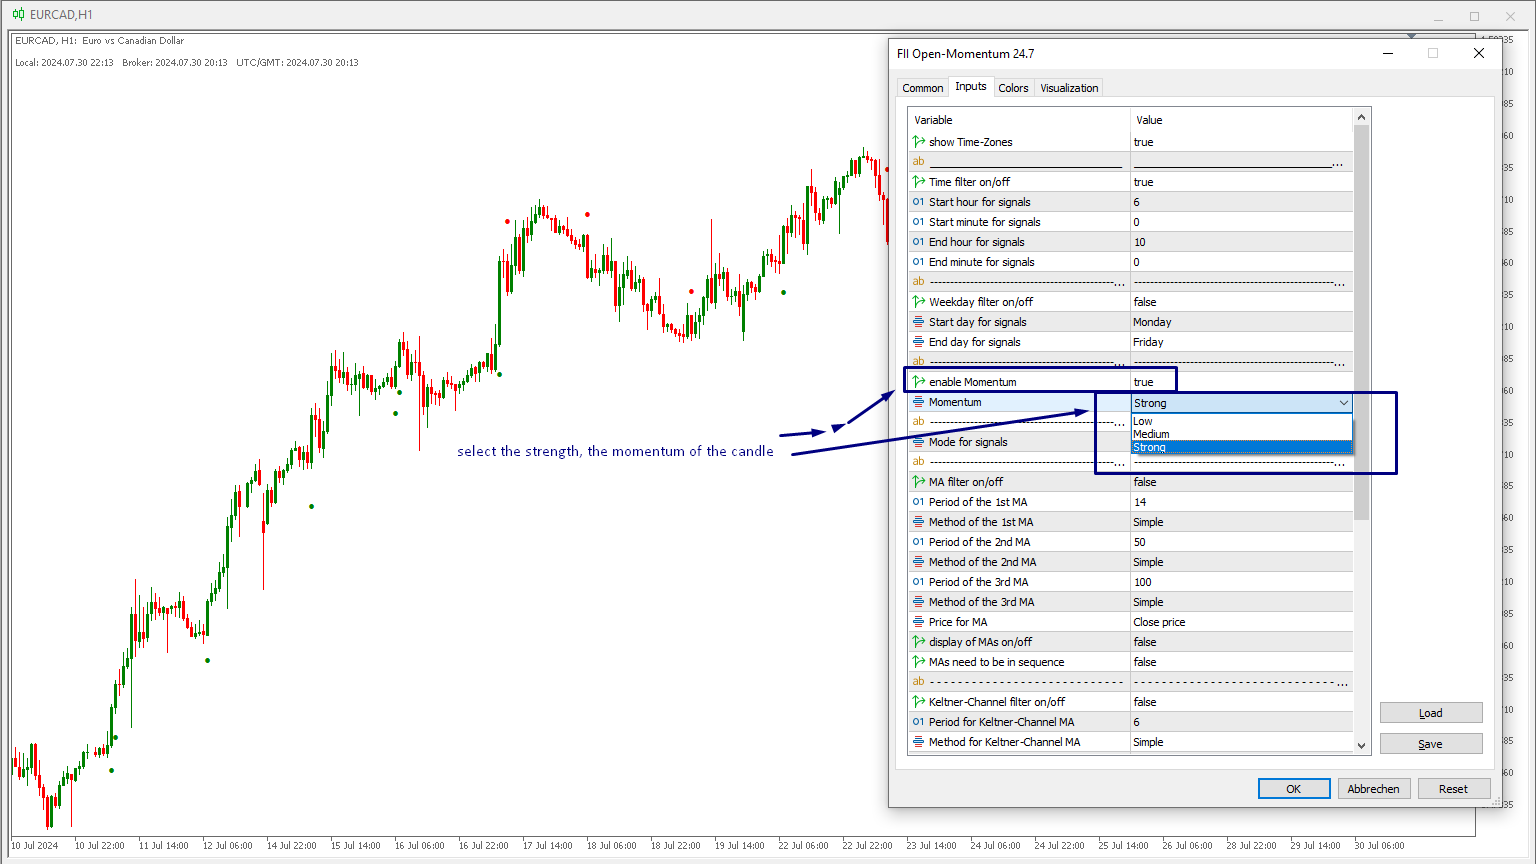
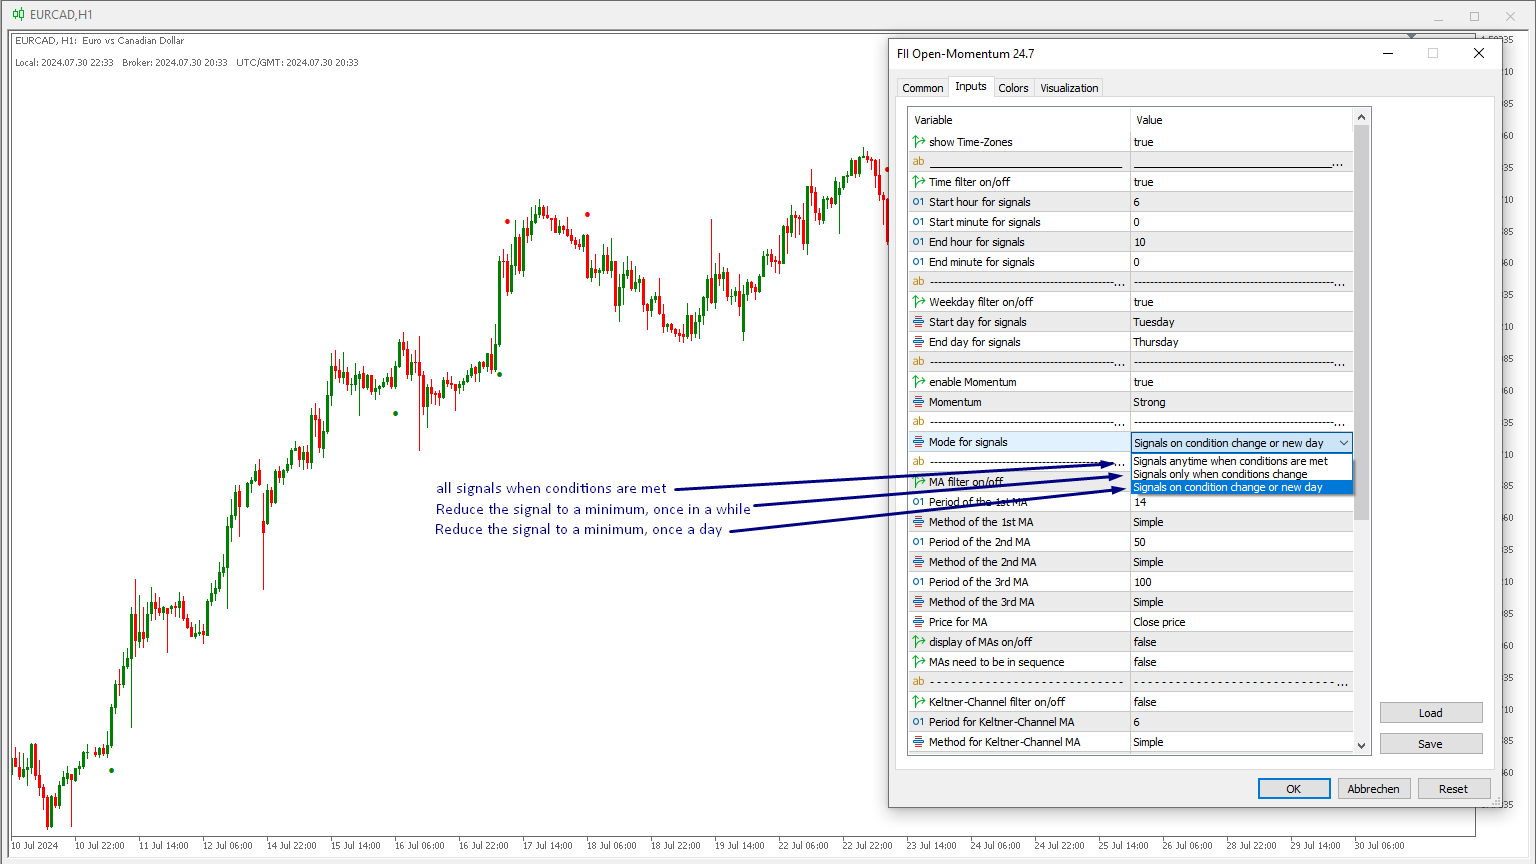
true Momentum - time-based Indicator
Filter
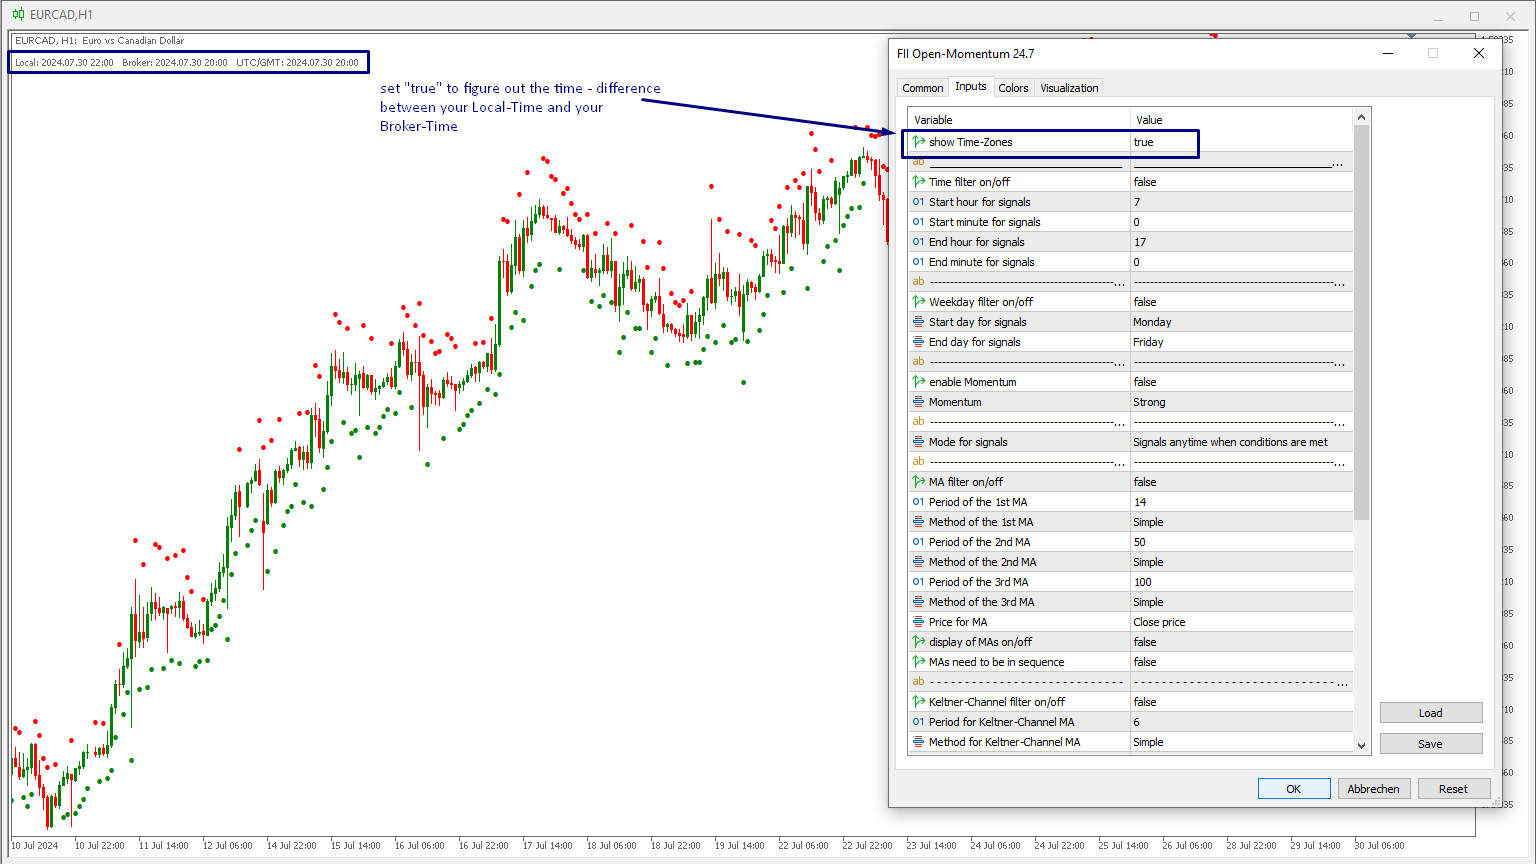
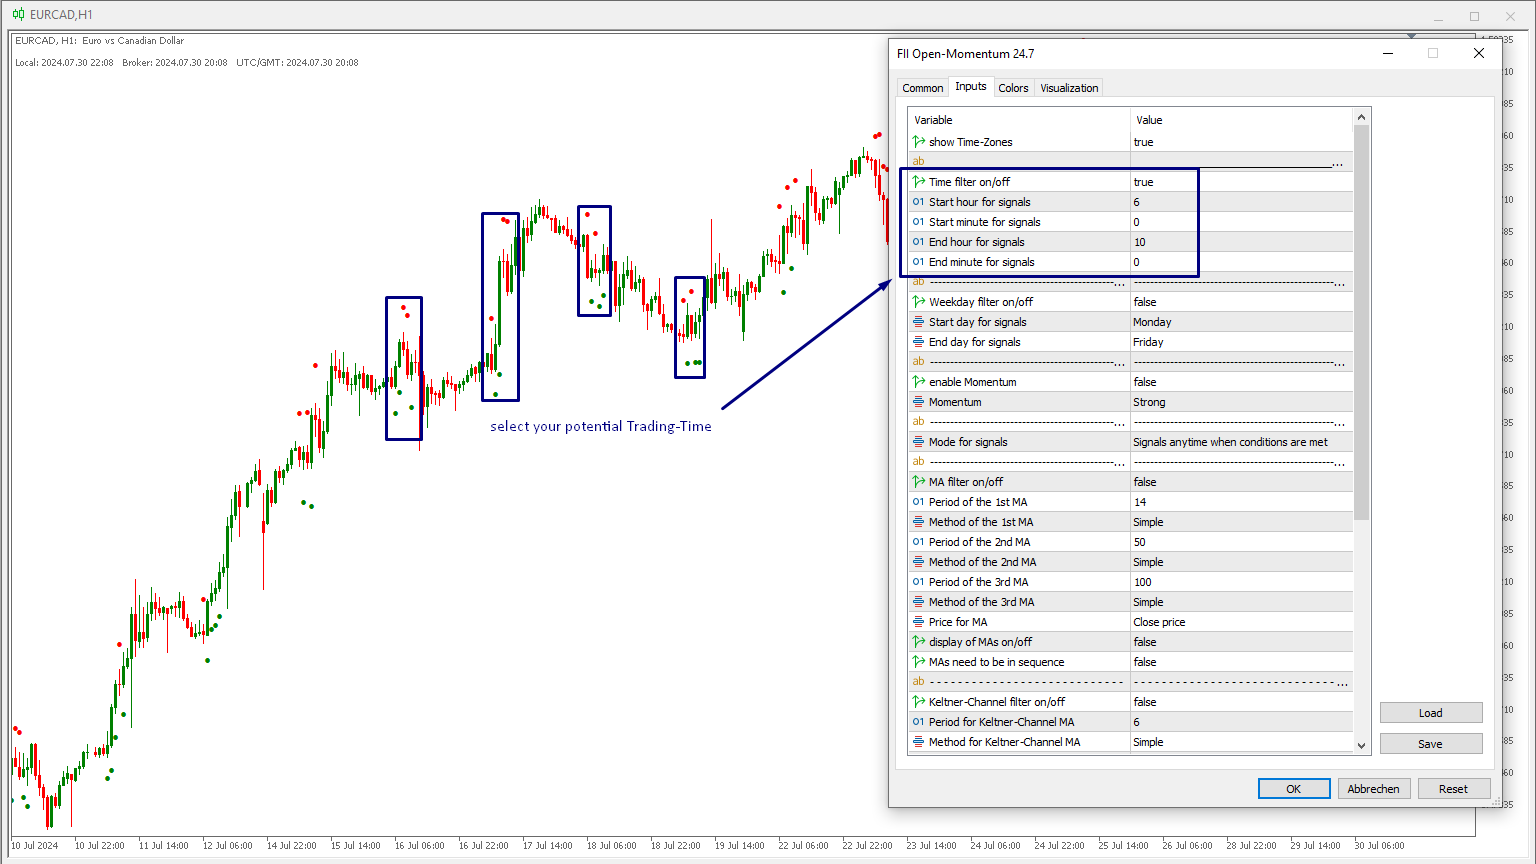
- Daytime
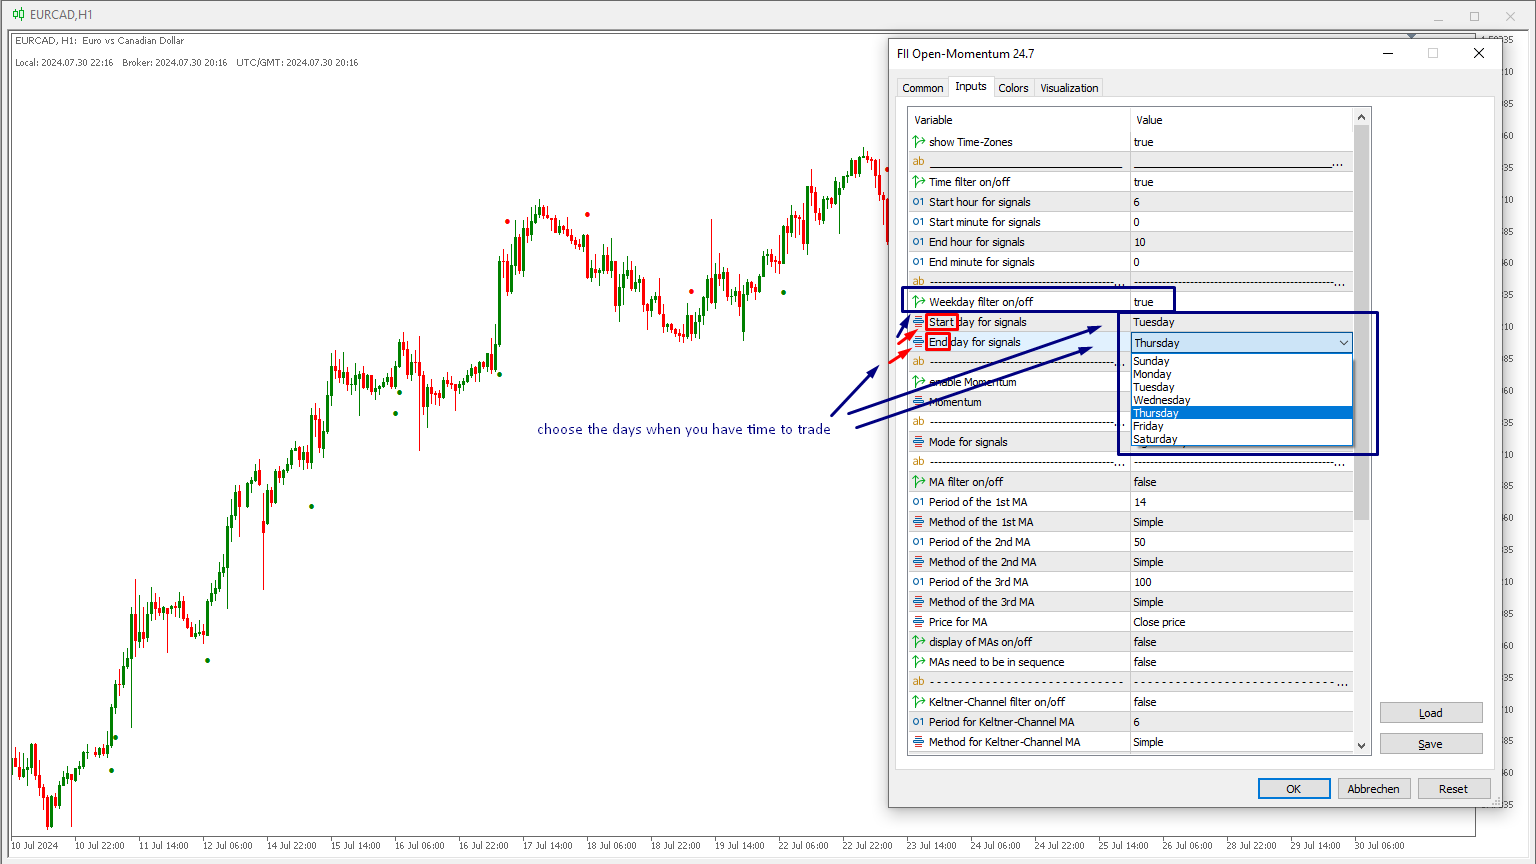
- Weekdays
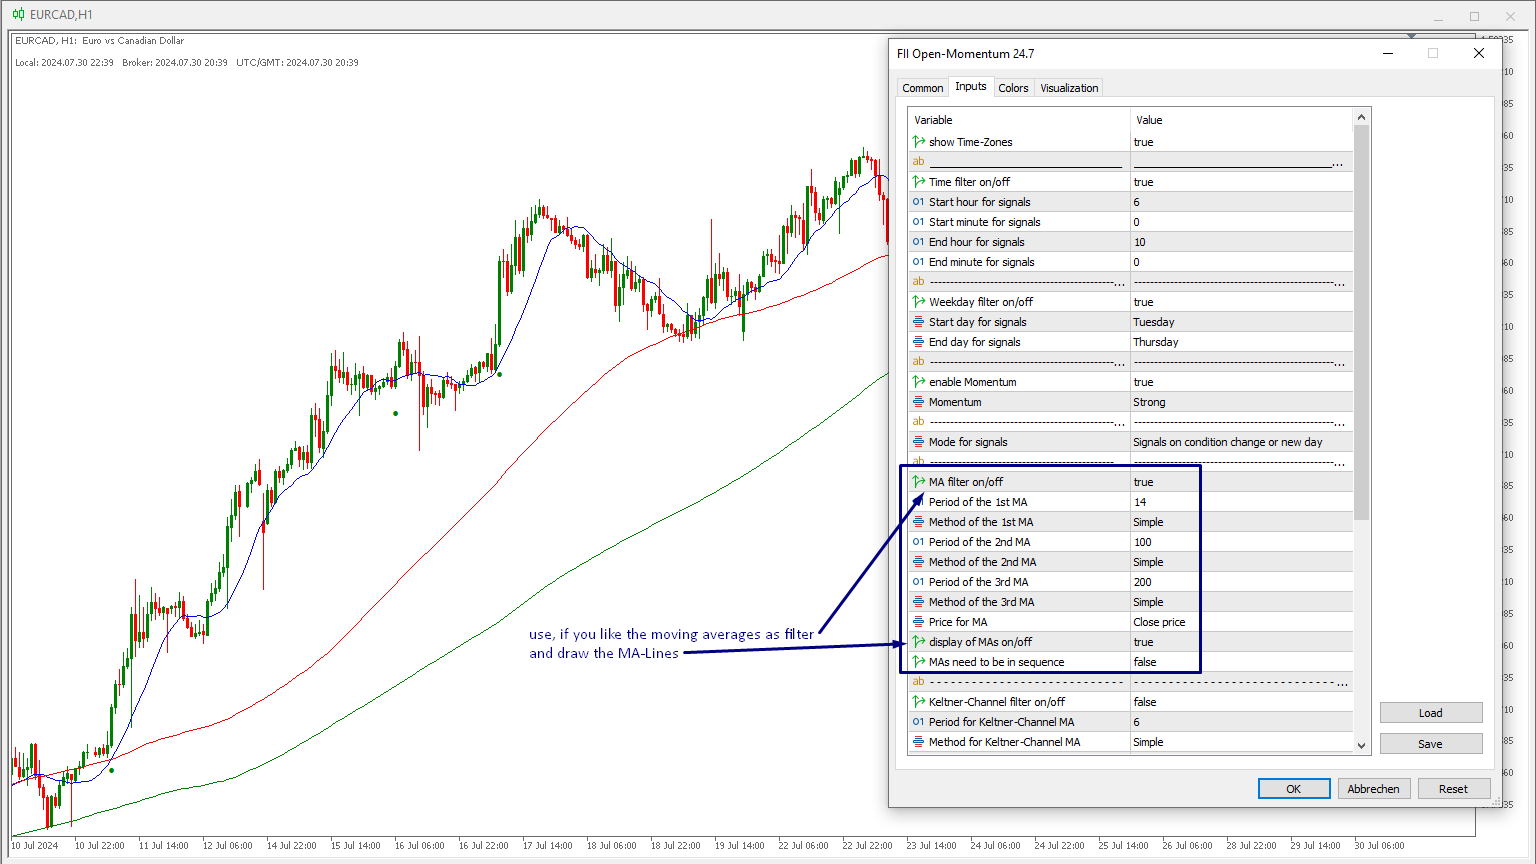
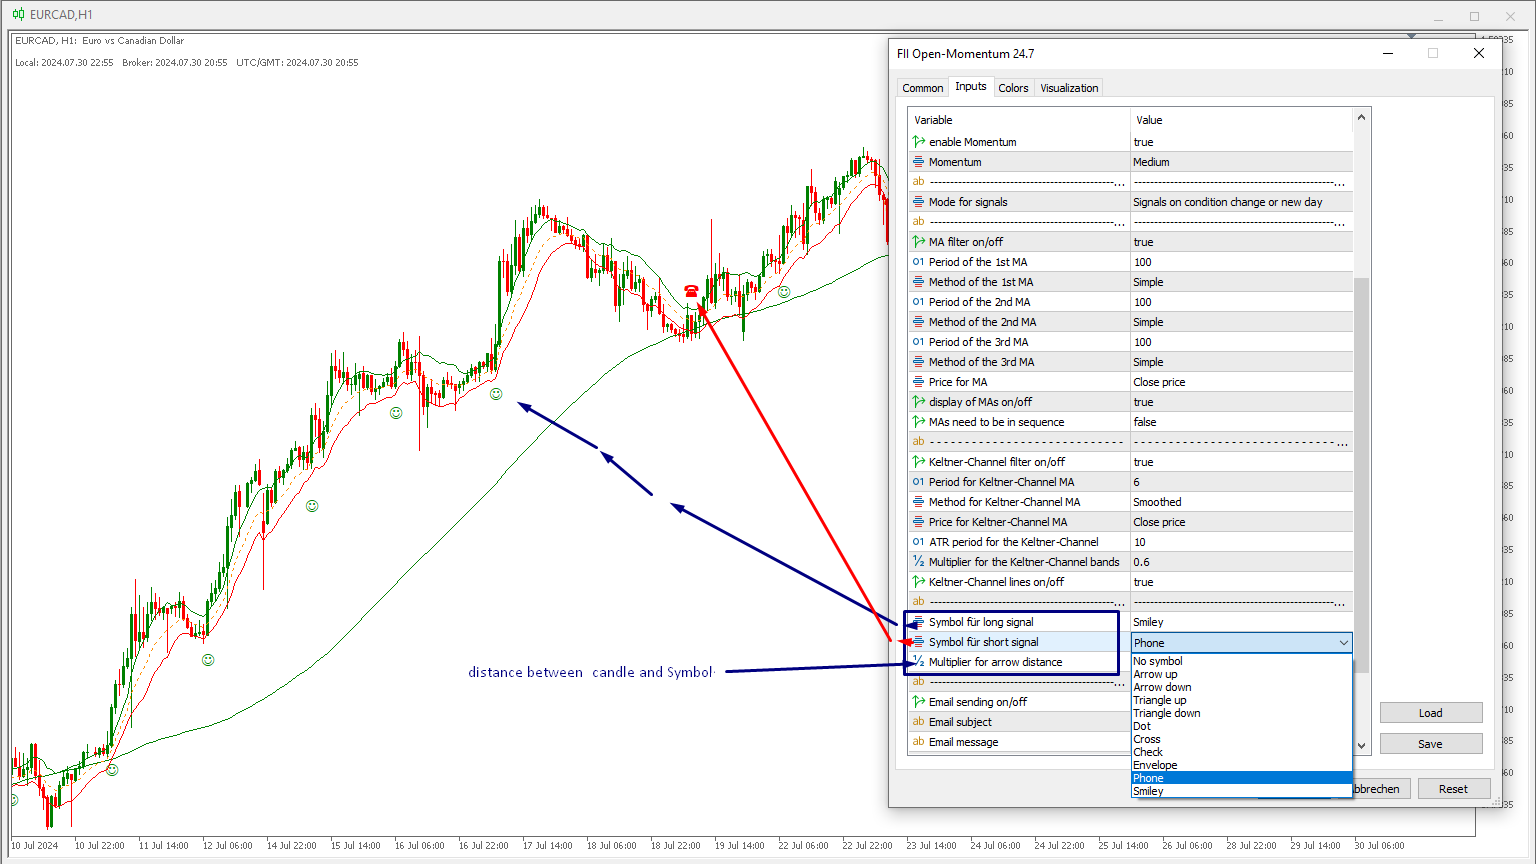
- Moving Averages
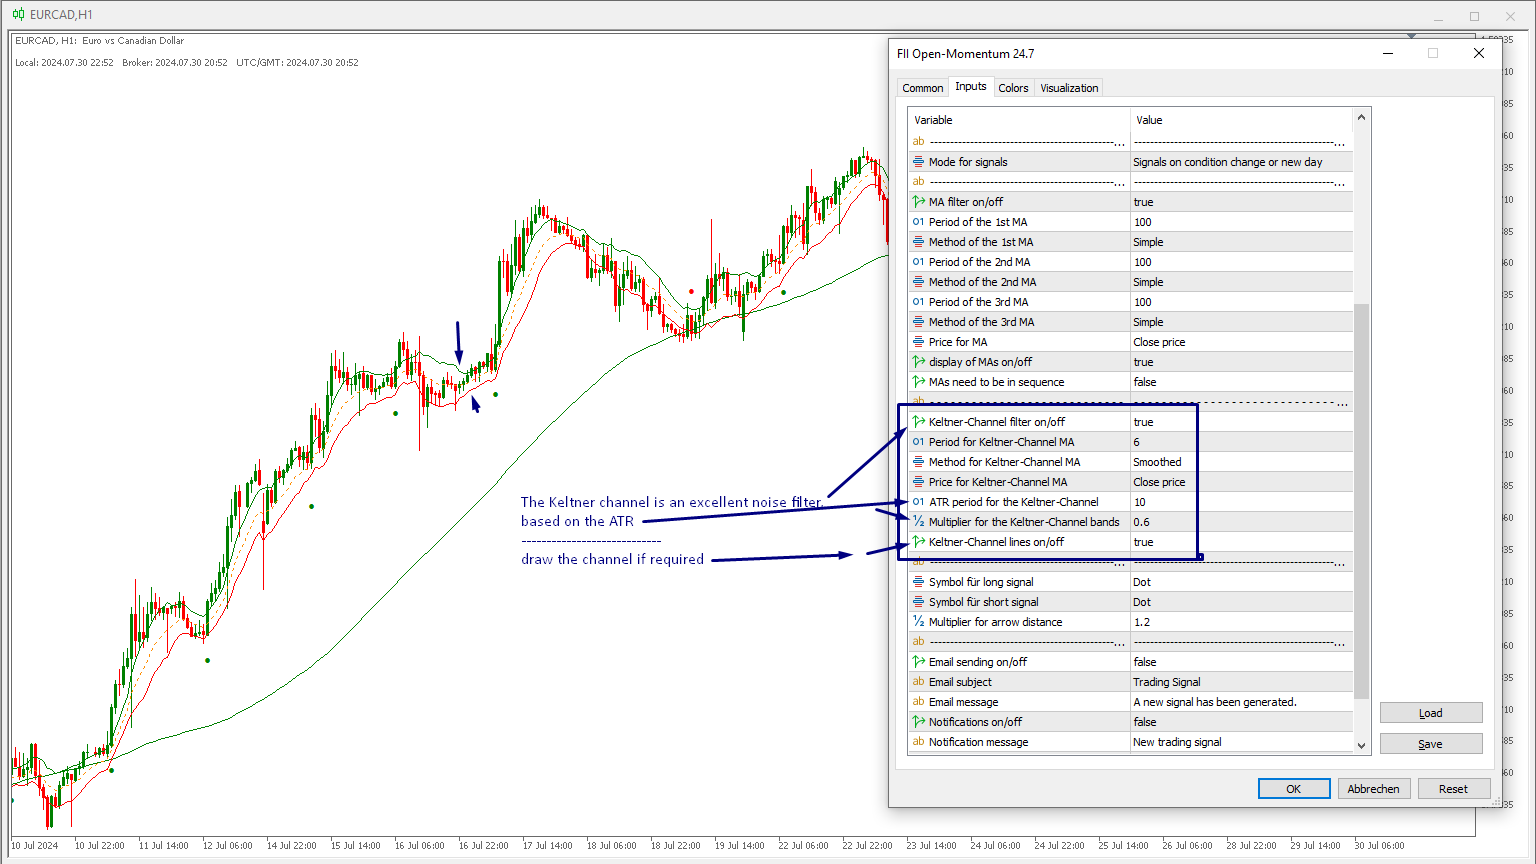
- Keltner-Channel
Advantages
- Optimized for Asia- London- US- Open-Session
- choose your personal times to trade - select Daytime and Weekdays
- Keltner-Channel => to reduce market noise - sideways movement will be hidden
- 3x Moving Averages => for the Trend
- Signal after close - no repaint
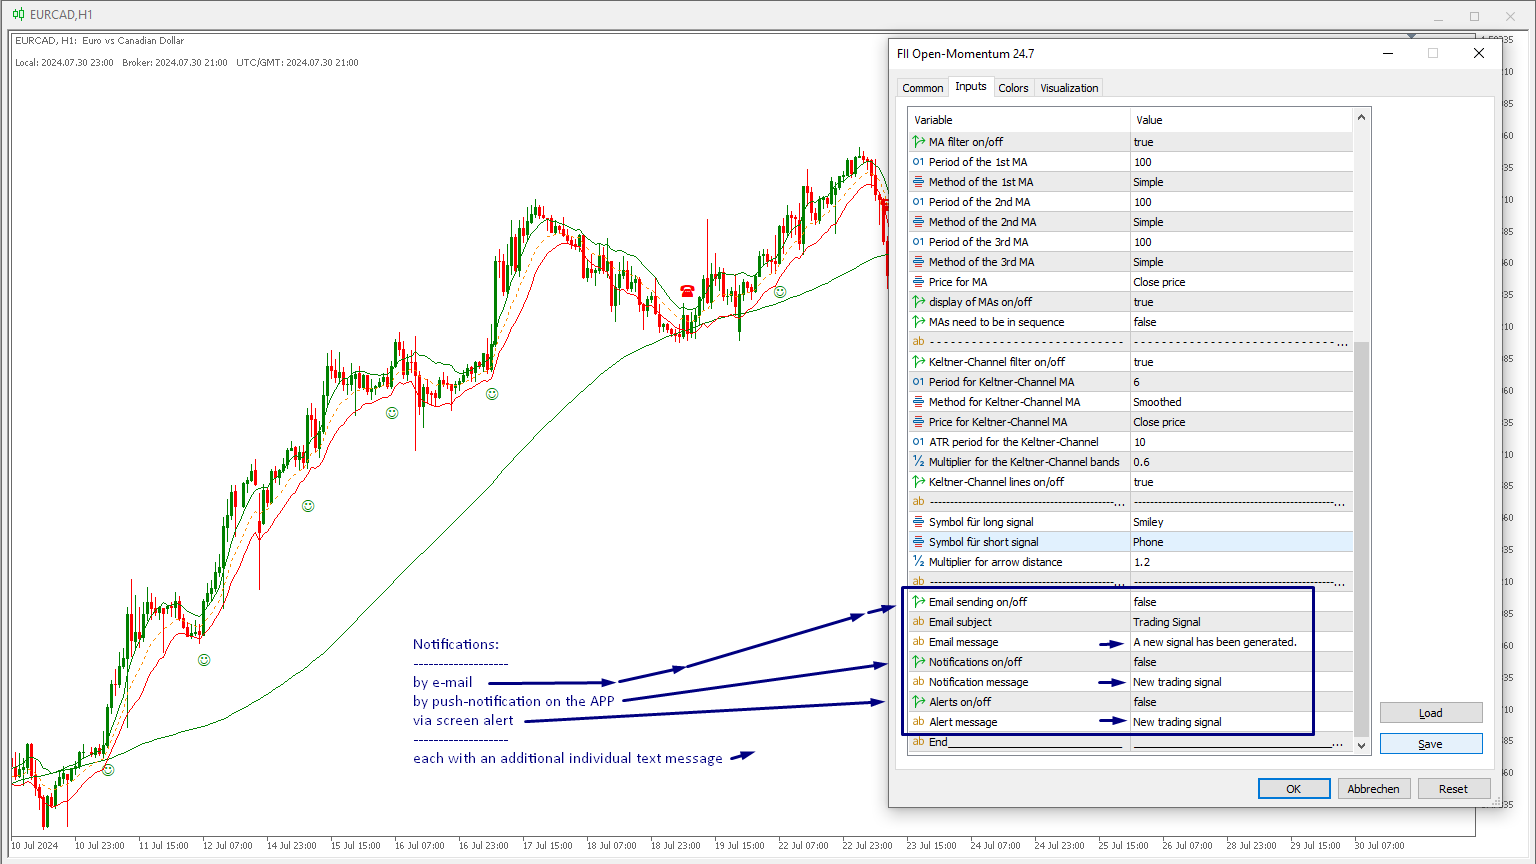
Alerts
- Screen-Alert
- Push-Notification