SolarTrade Suite Mars Market Indicator
- 지표
- Adam Gerasimov
- 버전: 1.0
- 활성화: 5
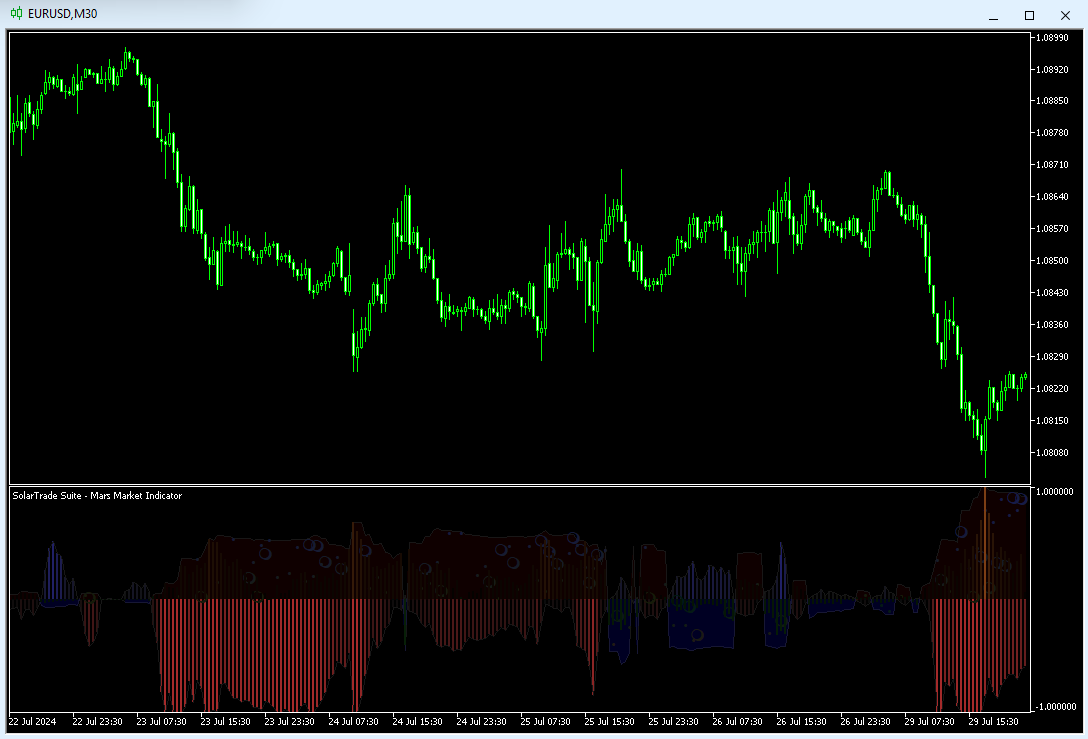
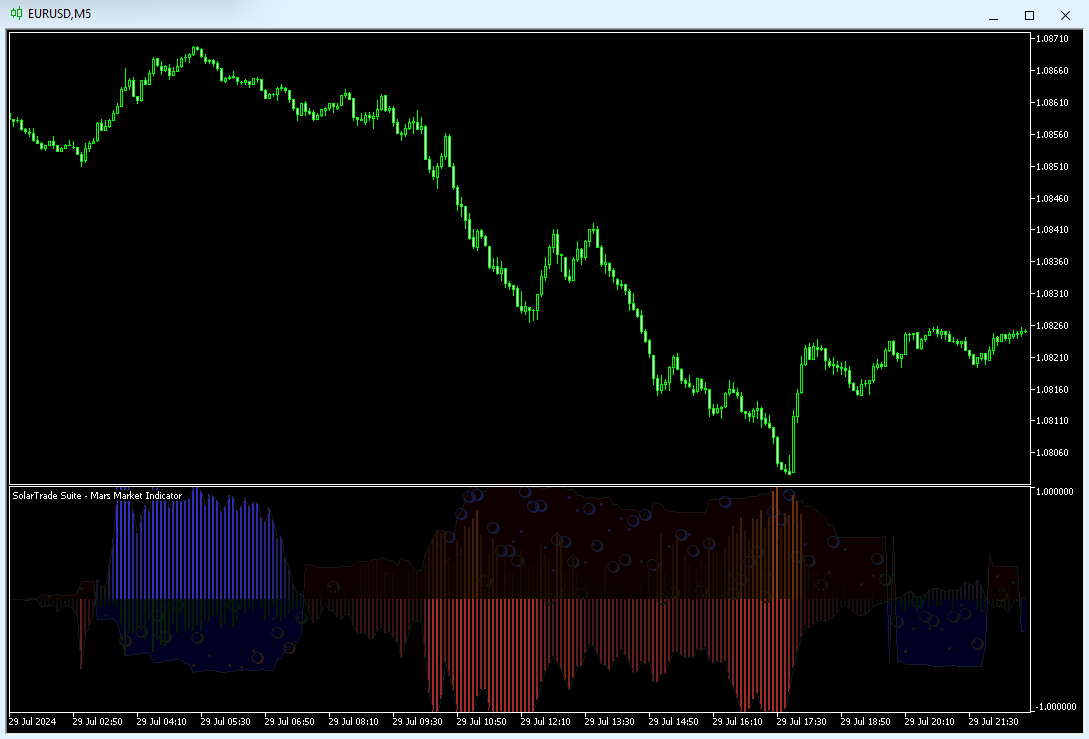
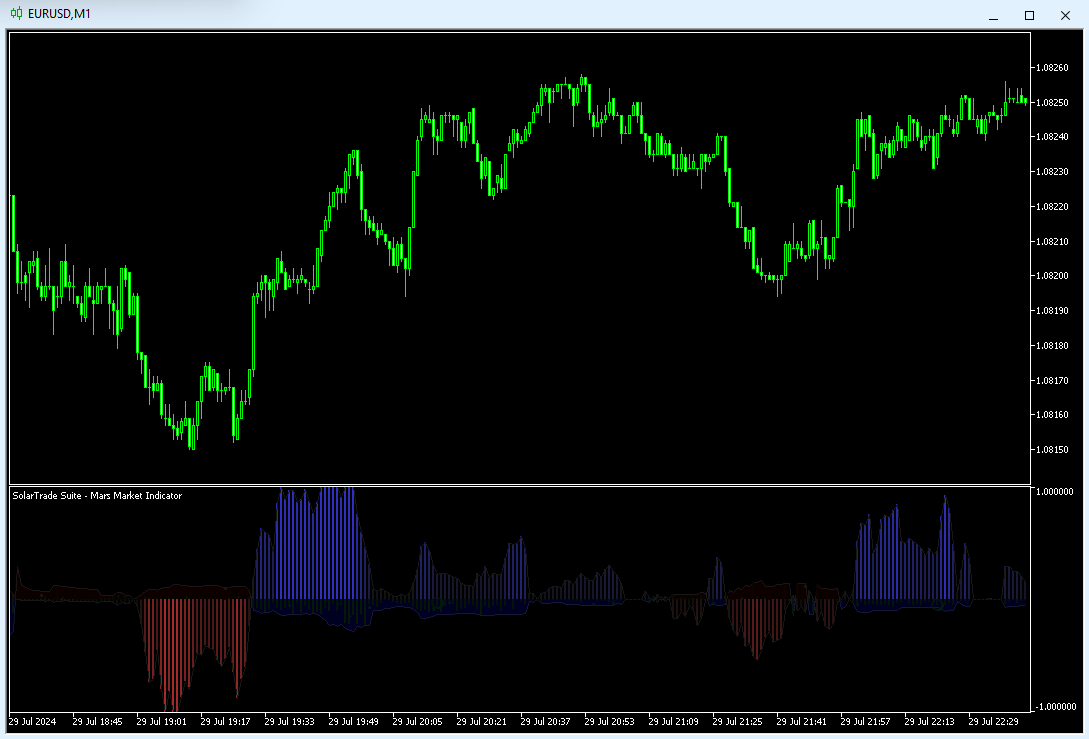
Financial Indicator SolarTrade Suite: Mars Market Indicator - 금융 시장의 세계에서 신뢰할 수 있는 가이드!
이 오실레이터는 특별하고 혁신적이며 진보된 알고리즘을 사용하여 가치를 계산하며, 디자인도 마음에 듭니다.
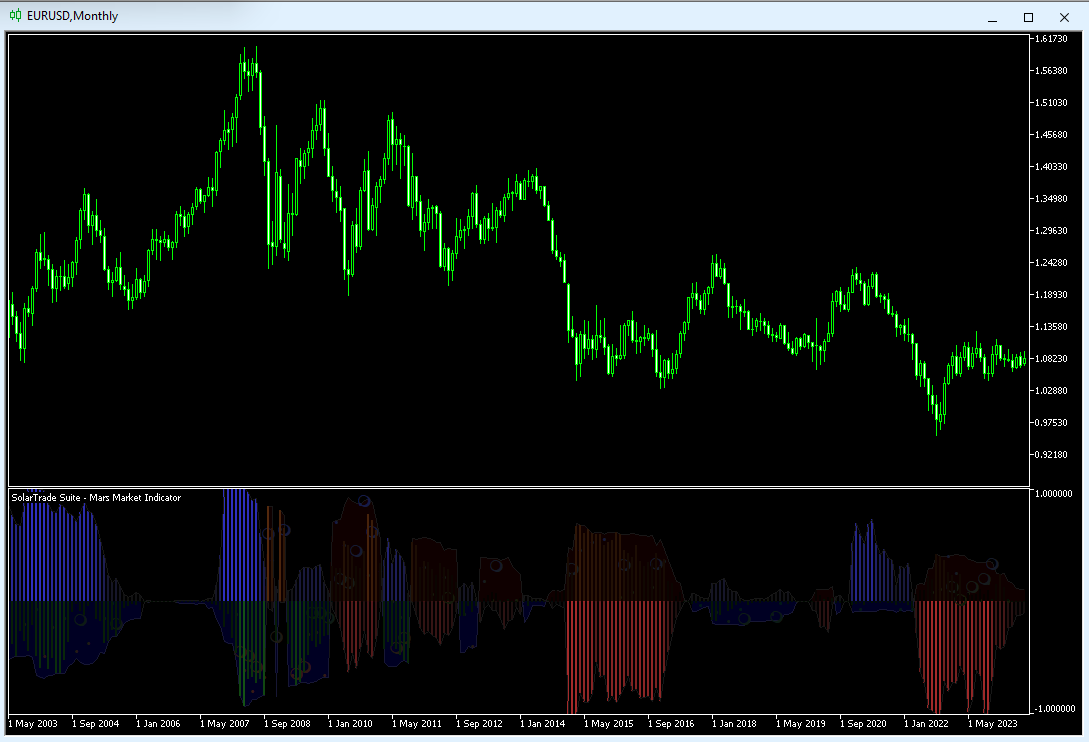
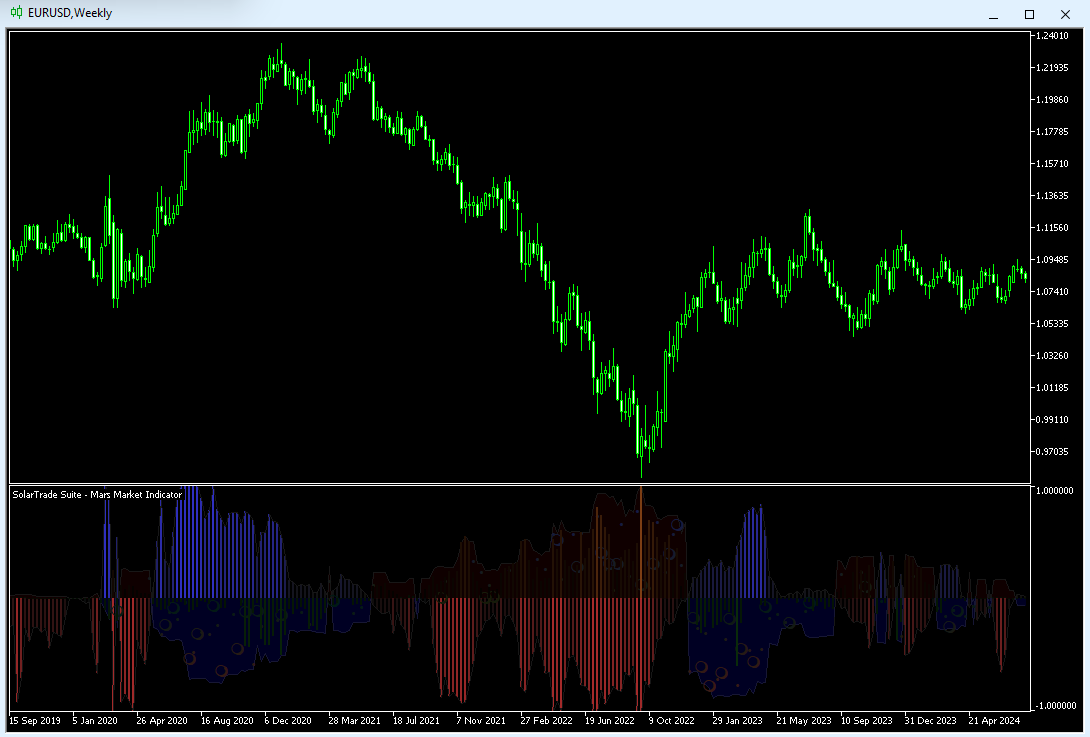
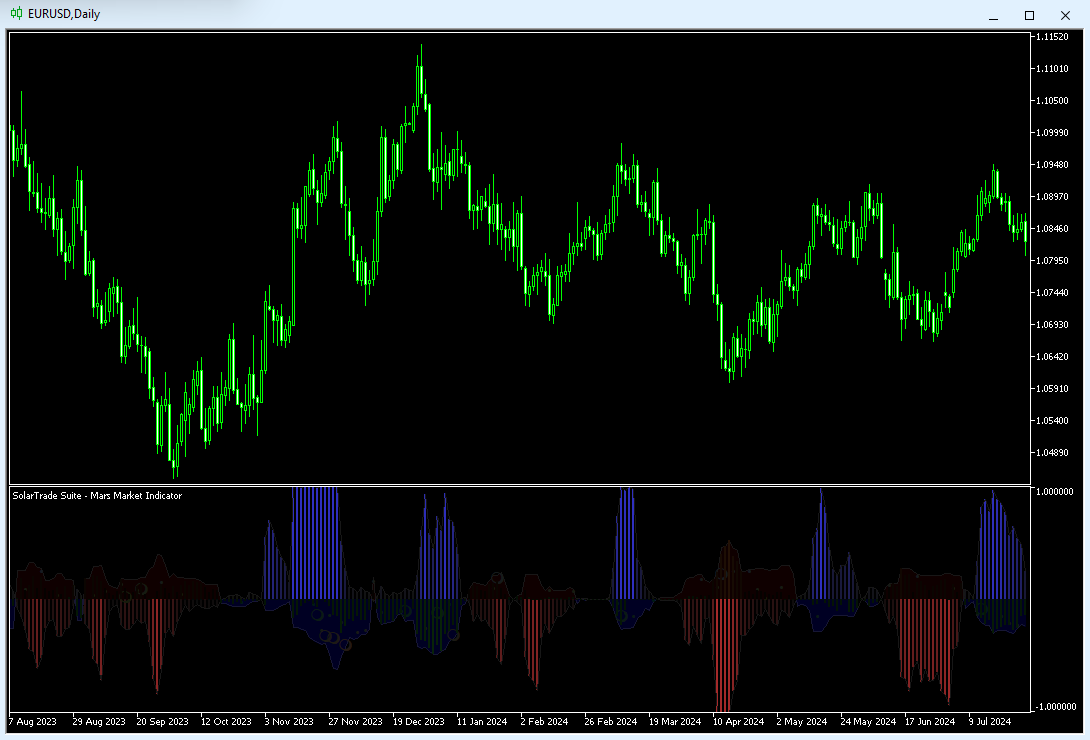
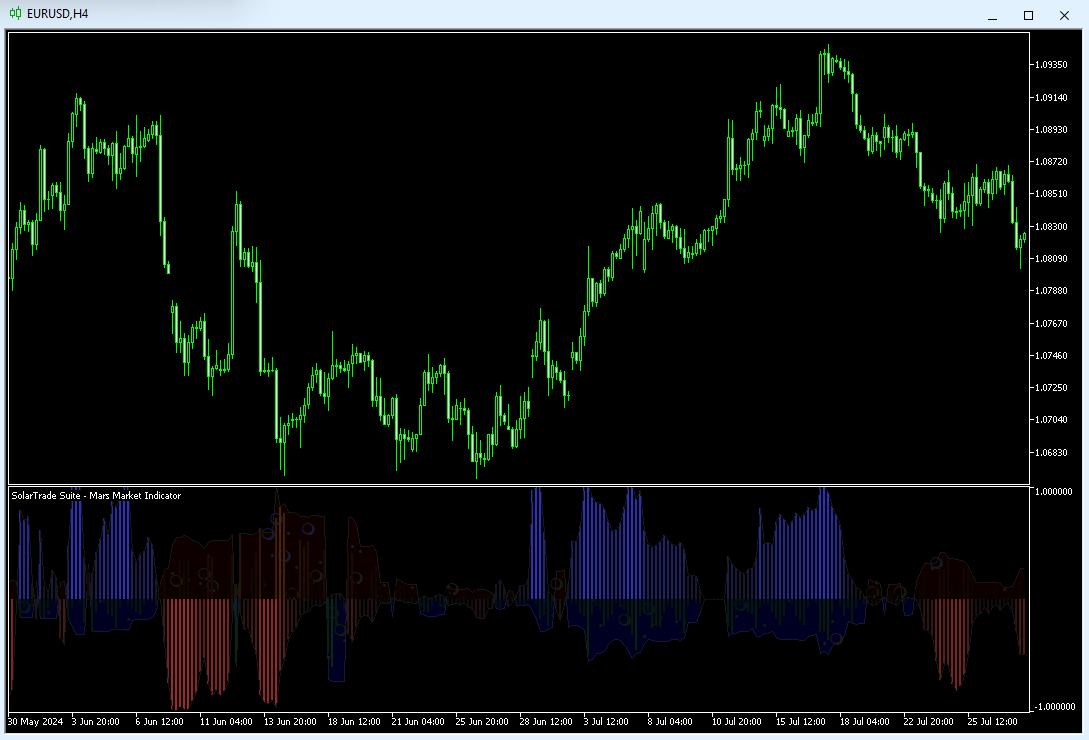
이 지표의 판독값은 이해하기 매우 쉽습니다. 파란색은 매수, 빨간색은 매도입니다.
색상이 밝을수록 신호가 강합니다.
설명 하단에서 SolarTrade Suite 시리즈의 다른 제품을 확인하세요.
투자와 금융 시장의 세계를 자신 있게 탐색하고 싶으신가요? Financial Indicator SolarTrade Suite: Mars Market Indicator는 정보에 입각한 투자 결정을 내리고 수익을 늘리는 데 도움이 되도록 설계된 혁신적인 소프트웨어입니다.
Financial Indicator SolarTrade Suite: Mars Market Indicator의 장점:
- 정확한 예측: 당사의 지표는 고급 알고리즘과 분석 방법을 사용하여 시장 움직임을 정확하게 예측합니다.
자산을 매수 및 매도하기에 가장 좋은 순간에 대한 신호를 받습니다.
- 사용자 친화적 인터페이스: 직관적인 인터페이스를 통해 프로그램을 쉽게 마스터하고 설치 후 바로 장점을 활용할 수 있습니다.
설정에서 선의 색상, 두께 및 스타일을 변경할 수 있으며, 다른 모든 설정은 자동으로 이루어집니다.
- 전문가 지원: 전문가 팀은 언제든지 질문에 답변하고 프로그램 사용에 대한 조언을 제공할 준비가 되어 있습니다.
SolarTrade Suite Financial Indicator: Mars Market Indicator를 선택해야 하는 이유는 무엇입니까?
- 신뢰성 및 정확성: 이 프로그램은 금융 시장을 분석하는 데 신뢰할 수 있고 정확한 도구로 입증되었습니다.
- 자본 성장: SolarTrade Suite Financial Indicator: Mars Market Indicator를 사용하면 보다 정확한 결정을 내릴 수 있어 수익이 증가합니다.
지금 SolarTrade Suite Financial Indicator: Mars Market Indicator를 사용해 보고 투자 결정에 자신감을 가지세요!
SolarTrade Suite 프로그램 시리즈:
- SolarTrade Suite: Mercury Market Indicator.
- SolarTrade Suite Venus Market Indicator.
- SolarTrade Suite Mars Market Indicator.
- SolarTrade Suite: Jupiter Market Indicator.
- SolarTrade Suite: Saturn Market Indicator.
- SolarTrade Suite Uranus Market Indicator.
- SolarTrade Suite Neptune Market Indicator.
- SolarTrade Suite Pluto Market Indicator.
- SolarTrade Suite: Comet Market Indicator.
- SolarTrade Suite: LaunchPad Market Expert.