Pdo VWAP
- 지표
- Smarterbot Software
- 버전: 240.726
- 활성화: 5
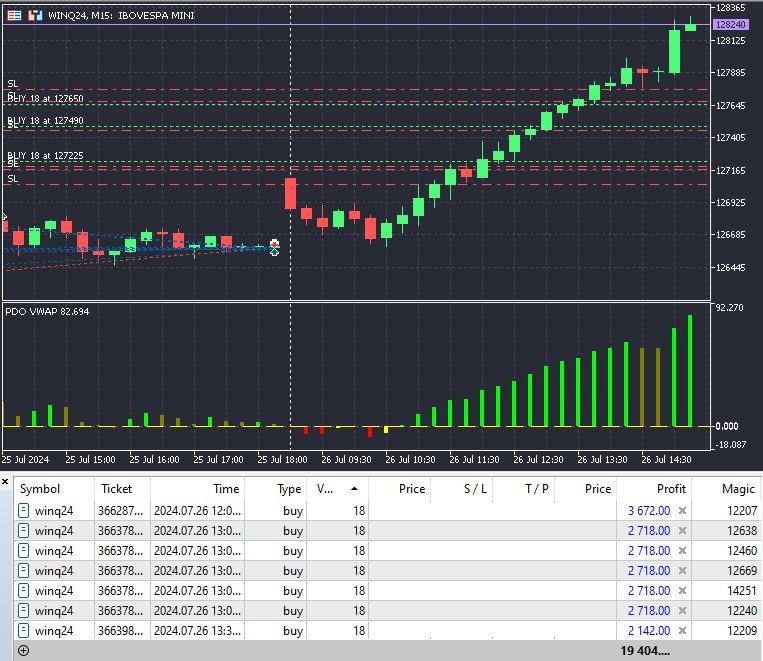
PDO VWAP Indicator
The PDO VWAP Indicator is a powerful tool designed for traders, quantitative traders, and algorithmic traders. This indicator combines the Volume Weighted Average Price (VWAP) with a Price Difference Oscillator (PDO) to provide valuable insights into market dynamics. The PDO VWAP Indicator helps you identify price trends and potential reversal points with precision.
Key Features
- Volume Type Selection: Choose between tick volume and real volume for VWAP calculations.
- Indicator Flexibility: Apply the indicator to various price types including typical, median, weighted, open, close, high, and low prices.
Indicator Parameters
- Price Type: Select the price type used for VWAP calculations.
- Volume Type: Choose between tick volume and real volume.
- Multiplier: Fixed options to scale the PDO values (1, 10, 100, 1000).
- Custom Digits: Define the number of digits to display (0 to 5).
- Shift: Adjust the shift on the chart.
Benefits
- Enhanced Market Analysis: The combination of VWAP and PDO provides a comprehensive view of market trends and potential reversal points.
- Customizable Settings: Tailor the indicator to fit your trading strategy with flexible parameter settings.
- Clear Visual Representation: The color histogram makes it easy to interpret market conditions at a glance.
- Robust Performance: Optimized for efficiency and accuracy, ensuring reliable performance during trading sessions.
Usage
To use the PDO VWAP Indicator, simply attach it to your chart and configure the input parameters according to your preferences. The indicator will automatically calculate and display the PDO VWAP values, providing you with actionable insights for your trading decisions.
Get Started
Enhance your trading strategy with the PDO VWAP Indicator. Download it today and take your market analysis to the next level.