• 미리보기
  • 리뷰
  • 코멘트

Intraday Dynamice Range

Dynamic Range Indicator for MQL4

Introducing our cutting-edge Dynamic Range Indicator, specifically designed for 5-minute charts, featuring a proven back-testing record to ensure reliable performance.

Key Features:

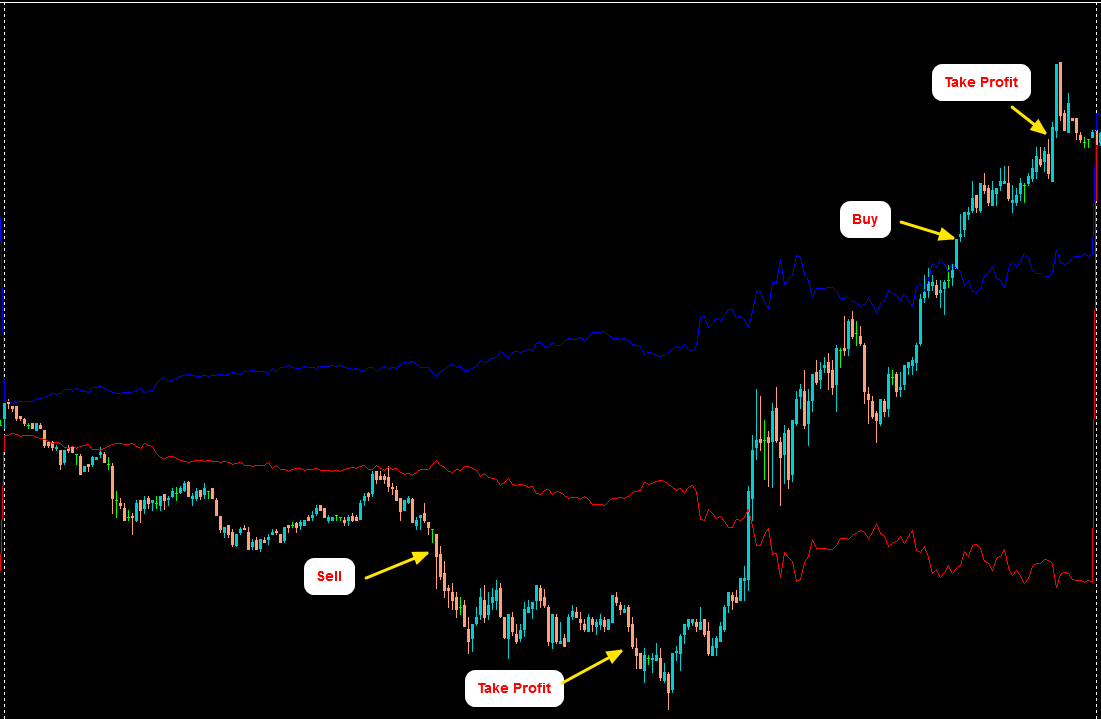
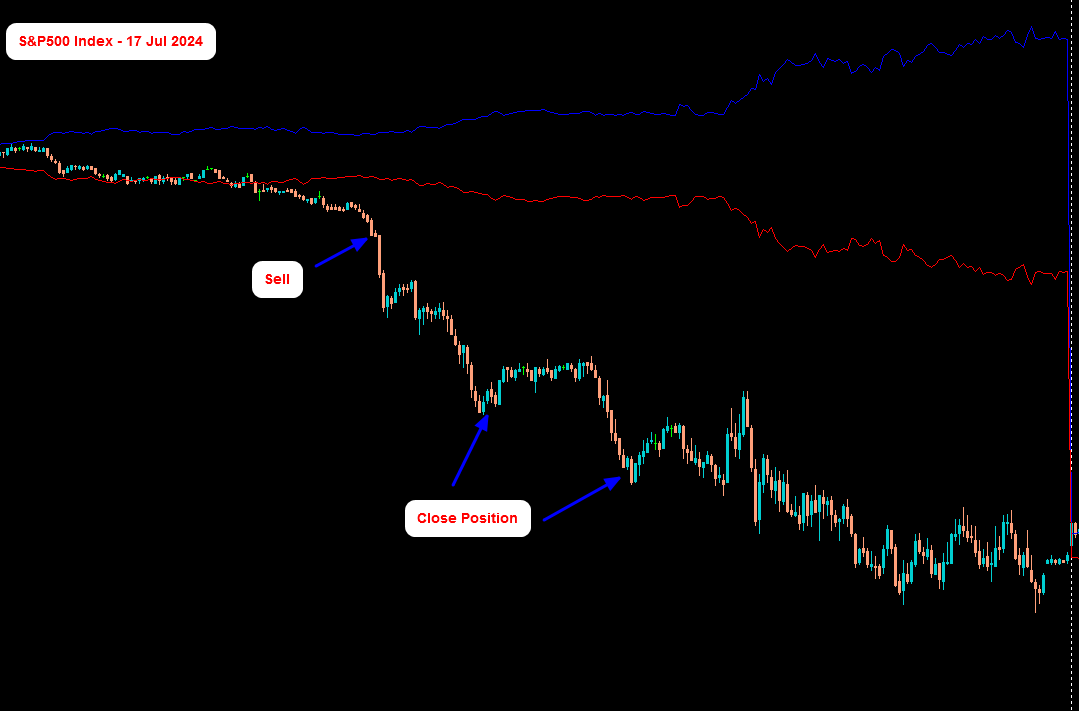
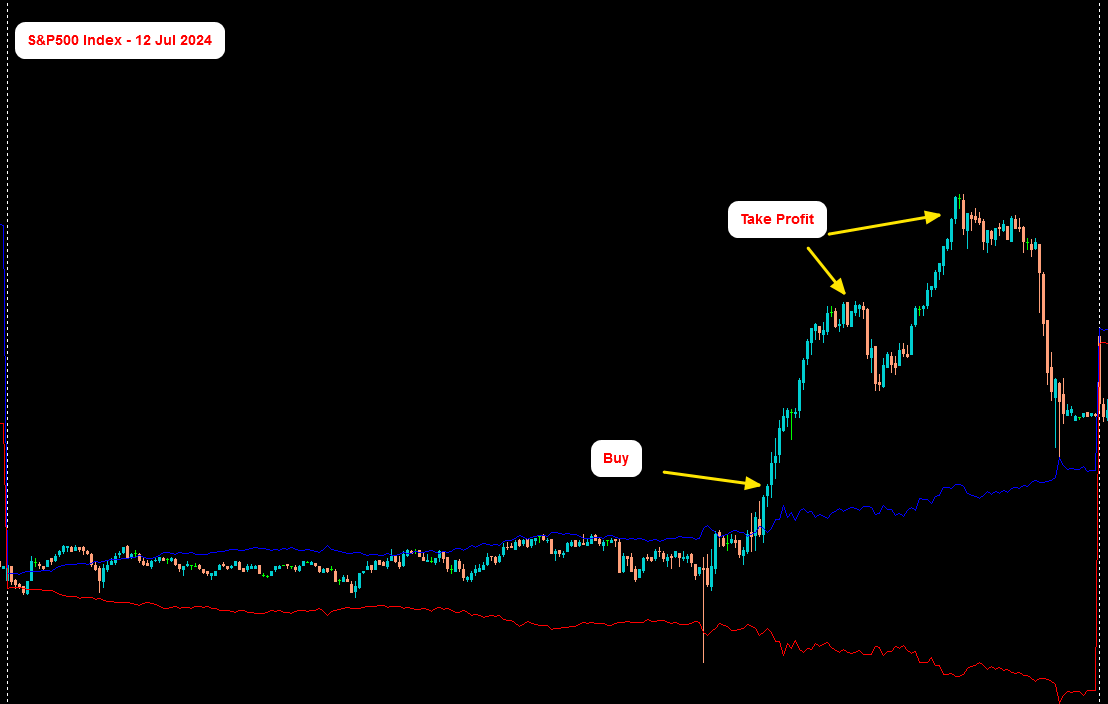
  • Blue and Red Lines: The indicator uses two dynamic lines to represent market volatility.
  • Calculation Method: The lines are constructed using the last 14 days' average absolute movement of 5-minute closing prices, multiplied by today's session open price.
  • Indicator Formula: Today's open price * (1 + (pre-set volatility + 14 days average absolute movement)).
  • Dynamic Adjustment: The blue and red lines adjust dynamically throughout the trading day.
  • Pre-set Volatility: Customize the pre-set volatility value for more conservative or aggressive trading conditions. It can be set to zero or adjusted as per your trading strategy.
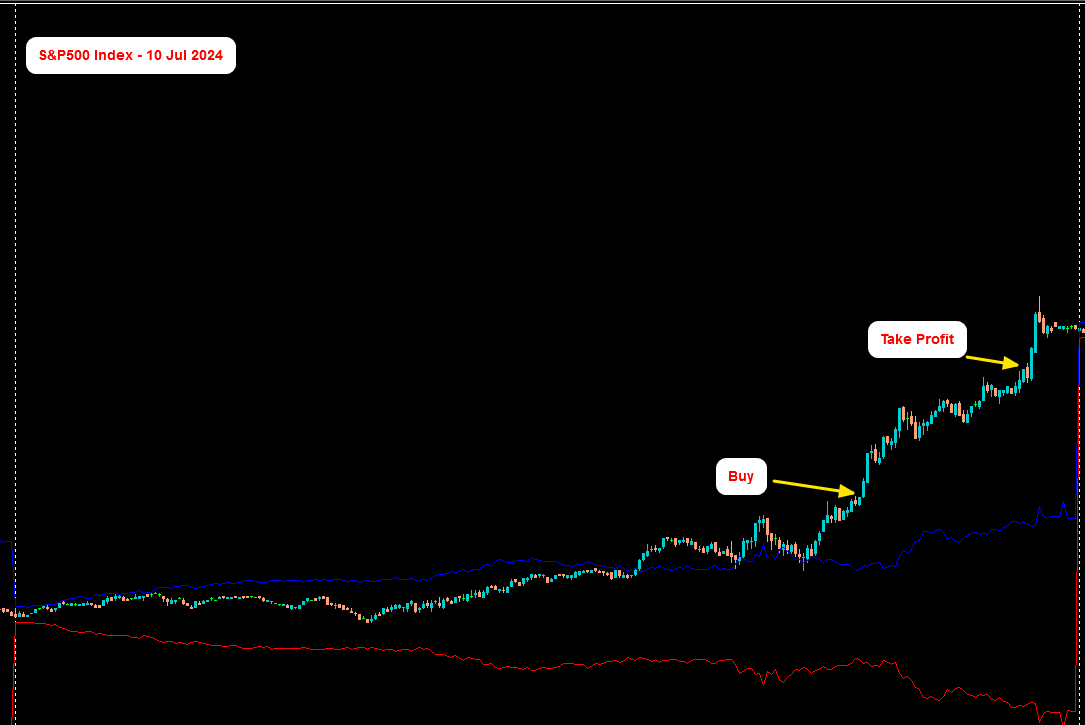
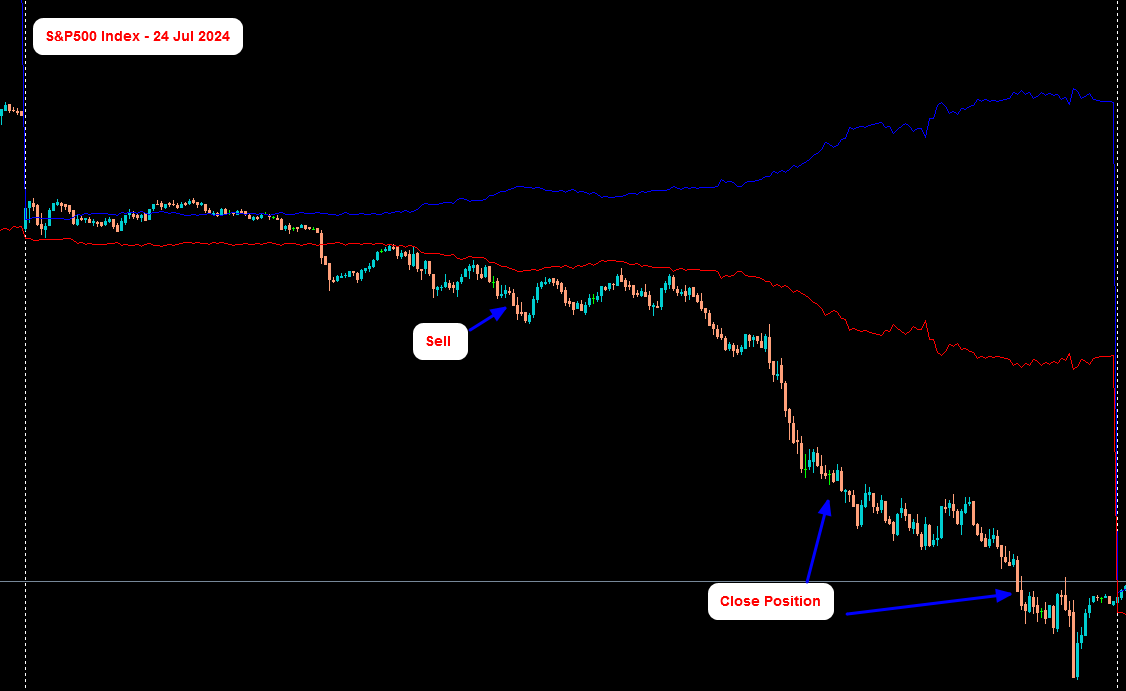
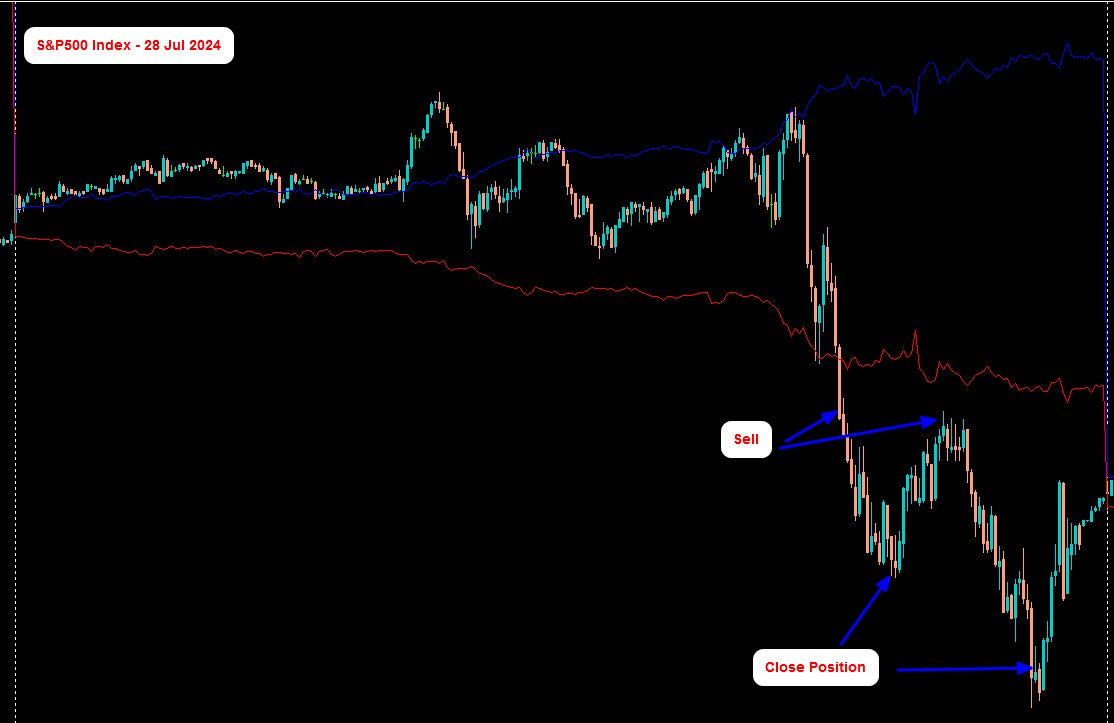
  • Momentum Signals: When the current 5-minute price crosses and stays above the blue line, it may indicate strong upward momentum for the day. Conversely, crossing and staying below the red line may signal strong downward momentum.

Enhance your intraday trading strategy with our Dynamic Range Indicator for precise market insights and informed decision-making.


추천 제품
A   rocket   (from   Italian :   rocchetto ,   lit. 'bobbin/spool') [nb 1] [1]   is a   projectile   that   spacecraft ,   aircraft   or other   vehicles   use to obtain   thrust   from a   rocket engine . Rocket engine exhaust is formed entirely from   propellant   carried within the rocket. [2]   Rocket engines work by   action and reaction   and push rockets forward simply by expelling their exhaust in the opposite direction at high speed, and can therefore work in the   vacuum   of space. In
History Exporter can help to export your orders history from MT4 account. After that you can use another data analysis tools to get what you want.  File format is .csv file, the content such as below OrderID,Symbol,Type,Lots,OpenTime,OpenPrice,StopLoss,TakeProfit,CloseTime,ClosePrice,Commission,Swap,MagicNo,Comment,ProfitUSD,ProfitPips,NetProfit,Duration,(Days),(HH:MM:SS), 21520206,EURCHF,buy,0.05,2020.03.10 08:06:15,1.06304,0.00000,0.00000,2020.03.11 13:37:38,1.06015,-0.60,-0.05,28282888,RedRab
FREE
Delving deep into the sphere of finance and trading strategies, I decided to conduct a series of experiments, exploring approaches based on reinforcement learning as well as those operating without it. Applying these methods, I managed to formulate a nuanced conclusion, pivotal for understanding the significance of unique strategies in contemporary trading.  
FREE
Mongol indicator
Sumiyabazar Buyanjargal
It's a variation of mid of HH and LL since it compares the higher of HH or LL against a period and twice the number of bars back to avoid whipsaws. I used to display this against lines on a chart, but made a histogram out of it and it looks interesting. It looks good at gauging trend strength and general turns (see image below). The name of the indicator is BAM, which is an acronym for "Below and Above Mid". Ways to use it: 1. To see general trend on longer TFs (more than 60 ba
Top Gun Oscillators
Safwan Rushdi Khalil Arekat
5 (1)
Note : New in 1.6: the indicator now exports the trade signal (but not displayed). Go long with light blue. Go short with red. Exit otherwise. Signal to be imported to your EA using iCustom. This indicator provides Best of the Best linear filter momentum oscillators that I am aware of (Low Pass Differentiators, LPD's) . All of them are  recent developments by this developer, or other researchers. The oscillator line is the first buffer of the indicator, and can be called  in other indicators or
FREE
This indicator will display current logined mt4 account's orders information of current symbol chart. It also allow import some formated data: 1) MQL5 Signals History CSV file (*.csv) 2) MT4 Account History Statement file (*.htm -> *.txt) *[Next Version] Allow Import data form 'HF HistoryExporter (*.csv)' Sample Data of MQL5 Signals History File Time;Type;Volume;Symbol;Price;S/L;T/P;Time;Price;Commission;Swap;Profit;Comment 2023.12.20 23:00:02;Buy Limit;0.06;EURUSD;1.08994;1.06024;1.09464;2
Mongol Indicator2
Sumiyabazar Buyanjargal
It's a variation of mid of HH and LL since it compares the higher of HH or LL against a period and twice the number of bars back to avoid whipsaws. I used to display this against lines on a chart, but made a histogram out of it and it looks interesting. It looks good at gauging trend strength and general turns (see image below). The name of the indicator is BAM, which is an acronym for "Below and Above Mid". Ways to use it: 1. To see general trend on longer TFs (more than 30 ba
Boom William
Danni Jumena
This Indicator will notified you when time to entry into the market, build with double william percent range strategy.  --> Buy Notification will flag with the blue arrow --> Sell Notification will flag with the red arrow After Flag Appear, the market usually explode but carefully you must performs double check because weakness of this indicator when in the end of the trend
Levels ResSup MT4
Andrei Salanevich
거래 지표는 예상되는 추가 채널 라인뿐만 아니라 가격 차트에 지원 및 저항 라인을 독립적으로 구축합니다. 표시기에 대한 정보 표시기에는 지원 수준(파란색으로 표시)과 저항 수준(빨간색으로 표시)이 있습니다. 표시기는 또한 더 많은 형성 지원 수준을 가지고 있습니다(이러한 수준은 앞서 언급 한 색상으로 스트로크로 제공됩니다). 내부 지원 수준(녹색으로 표시)과 저항 수준(분홍색으로 표시)도 있습니다. 그들이 방해하는 경우 원하는 경우,당신은 그들을 해제 할 수 있습니다. 주황색 수직 시작 선은 기록을 따라 이동할 수 있으며 선은 자동으로 다시 그려집니다(다시 그려지지 않은 경우 그래프 업데이트). 오른쪽 상단 모서리에는 지원 및 저항 라인 수가 표시됩니다. 표시기는 모든 통화 쌍,암호 화폐 및 주식에서 작동합니다. 모든 시간대에. 표시기 설정 첫 번째 막대=1;//초기 선 구성 막대(수직선 좌표 시작) 삼각근=3;//막대의 최소 선 크기 인
Rira Renko
Vitor Palmeira Abbehusen
RENKO on Time Chart This indicator is an enhanced Renko, so you can watch the Renko bricks on the chart to understand price movement more clearly the other improvement is automated box size according to ATR (Average True Range) period you can set the ATR number as you want and the box size of Renko changes automatically based on price movement Inputs Mode: Box size is the input to specify the size of the Renko box you want to print on the chart. This input lets you choose the fixed b
Octo Tack Pro
Rafael Vega Ruiz
OCTO TACK TREND PRO INDICATOR Summary/Description: Trend indicator Shows signals that tell you the current market trend Shows different signals to execute orders in favor of the current trend Get ready to have the best trend indicator you've ever tried. It does not repaint in any way, once a signal has been captured, it remains there until it is finalized. It generates clear signals and always in favor of the trend (see screenshots) Just be attentive and wait for the alert to tell you when a n
Eau farrow cadjpy
Leandro Morera Delfin
EA  advantages: Operating using regions's characterizations over the curve with four stages , 1) strong buy, 3) strong, sell, 4) soft buy and 2) soft sell . Market alignment between temporality. Adaptive SL. Operation using zone determination. Operation posibilities for other currencies. …The EA was tested by one year 2020-2020 with a robust behavior over market variations and positive profit with the following:
Description A colored multicurrency/multisymbol oscillator of the market mood. The oscillator is designed for detecting the continuation or change of the market mood prior to its occurrence. An excellent example is the screenshots that show all the features of the oscillator. The oscillator may be used with any broker, irrespective of the name of the financial instrument since it is necessary to manually enter the name as an input parameter. If you enter a non-existent or incorrect name of a fin
The indicator calculates delta, the difference in tick volumes between buyers and sellers. Displays the imbalance of market purchases and sales.   Delta imbalance is a special style of presentation based on the ratio of supply and demand volumes Using the indicator in real trading mode, you can observe the behavior of the mood of large market participants, thereby you can visually see who currently controls the price and maintains further control. You can also see the absence of large v
Indicator of tick volumes with the ability to monitor sudden and significant changes in the prices of bars relative to the specified coefficient - Change Factor - to the average value of volumes for a certain period of time - Period Signal. The color of the indicator's histogram characterizes the changes in volume of a bar relative to the previous session and the signal line. Indicator Inputs Period Signal - period of the signal line; Change Factor – volume change factor. By default, the indic
HF Crosshair
Wong Sze Wai
4.5 (4)
For some trader's charts analysis use, specially for  multi timeframe trading strategies . When you need to check something of the time within different timeframe at the same symbol chart, even different symbol charts, this indicator will show the crosshair at sync moving. You just need to load this indicator into some charts, then the crosshair will shown automatic. 
FREE
This Dashboard displays signals in grid view for the 28 major fx currency pairs. It is Mainly used for forex scalping in between 10 to 20 pips maximum and can be used on major trend market decisions. It Uses mainly Moving average and does not give false signal. All you need to note is the point in the grid where the signal occurs.  A beep sound is heard whenever there is a new signal and it will be displayedat the top of the chart.
This is an expert advisor that will trail stop loss of orders selected from the list displayed on the chart. To make it run, add the expert to an empty chart (please set it on a chart that is not in use for analysis or other trading purposes, you can minimize it when setting a new order trail timed stop loss is not required). Set the number of pips to trail and the number of minutes to wait for the next stop loss review at the inputs tab in the Expert Properties window. From the list displayed o
Power Average
Khurram Mustafa
4.33 (3)
This Indicator is a affordable trading tool because with the help of Popular Developers & Support of M Q L Platform I have programmed this strategy. I tried to combine logic of Moving Averages, Parabolic Stop And Reverse, Trend Strength, Oversold, Overbought . Furthermore, I have also care about Support Resistance that Trader can easily get in touch with market by selecting one indicator only. What is in for Trader? Trading Modes: This selection is for activate whole strategy "Power Average" S
FREE
Introducing the revolutionary Expert Advisor for the MT4 trading platform: Deep Pound MT4. This cutting-edge trading expert advisor leverages state-of-the-art technology, incorporating a pre-trained Temporal Fusion Transformer (TFT) model based on deep learning principles to elevate your trading experience with GBPUSD to unprecedented levels. IMPORTANT!  Due to market instability , this bot will temporarily not open any orders from December 15th to January 15th. Please check comment details . 
I Permanent
Vladimir Gorbachev
Universal adaptable indicator. It determines the estimated trading range for the current day based on the available history a real data, and displays the area of the probable price rollback on the chart. All this thanks to the built-in algorithm that automatically adapts to any behavior models of the market quotes. With the parameters adjusted, the indicator shows its effectiveness on most of the currency pairs, that have a rollback from the reached extremums during the current or the next tradi
CloseBarInfo
Dmitrii Korchagin
표시기는 현재 서버 시간과 차트에서 현재 막대가 닫힐 때까지 시간을 표시합니다. 이 정보는 거래자가 촛불이 닫히고 거래 세션을 시작하기를 기다리는 뉴스 릴리스의 순간에 매우 유용 할 수 있습니다. 글꼴 크기 및 색상은 차트 템플릿에 맞게 조정할 수 있습니다. 설정: 텍스트 색상-표시 텍스트의 색상 텍스트 크기-표시 텍스트의 크기 당신이 지표에 대한 긍정적 인 피드백을 떠날 경우 나는 매우 기쁠 것이다. 토론에 당신이 당신의 무기고에서보고 싶은 다른 지표 및 기타 도구를 작성하십시오. 존경과 함께 새로운 로봇의 업데이트 및 릴리스를 놓치지 않도록 나를 친구로 추가하십시오-> 드미트리 코르 차긴 시장에 내 다른 제품을 참조하십시오-> 내 제품 내 로봇은 곧 출시 될 예정이지만 그 동안 거래 방식을 지켜보십시오-> 히어 신호
FREE
This Expert Advisor uses scalping as its main strategy based on a statistical model called Bollinger Band. It embedded with two exit market strategies called 1st and 2nd dagger. The 1st dagger exits on the mid line of the band and the 2nd dagger exits by trailing until the maximum profit. It is recommended to use both strategies to lower the risk since it would split the lot into half for each dagger. Recommended: M5/M15, EURAUD/GBPAUD, ECN account Please add the news link (http://ec.forexprosto
US30 And US100 Top-Down Analysis EA MT4 analyzing the overall market environment and economic conditions first before zooming in to the lower timeframe for entry. Starting from the big picture DAILY and then narrowing down to 1 HOUR and take the entry in 5M timeframe This EA adapt to changing market conditions, continuously monitoring macroeconomic indicators and sector performance, and adjust the trading strategies to capitalize on emerging trends. US30 And US100 Top-Down Analysis EA MT4 does n
T Dog
Chi Hi Wu
1 (1)
T Dog is a fully automatic trading robot which is the result of more than 10 years of the market study and programming expert advisors. You could run on all Forex, Indexes and Commodities. It uses a multiple indicators to determine the market entry with an advanced exit-algorithms. T Dog build-in News filter which able to stop trading during the news releases. It also possible to enable the trailing stop to secure your profits. No Grid No Martingale No Hedging No Arbitrage It is advised to use a
ToolBox 360 is the swiss knife of all indicators. It is full packed with useful tools to help you with your trading. It can be used to find best entry and exit points and help you to decide if you should open a trade or not. It shows market trends, candlestick formations outside / inside bars and you can sett time based allerts. Main features: Time based Fibonacci lines Choose a start and end time and the indicator shows you Fibonacci lines within the selected time range including range high
Telegram MT4 Order Channel Manager is a tool to manage order and send text message to channel through Telegram chat app . Attention: This EA can only work for One Telegram Bot in One MT4 Account . If you want to attach to another account, you should make new Telegram Bot and use new token for that account . It does not work in backtest. Watch the video to see how it works. There are 9 menu to choose: 1. Account Info - Gives information about Balance, Equity, Profit, Order List. 2. Quotes - Gives
Stop Hunting
Erdenebayar Lamjav
The indicator of stop hunting shows the level zone of Day marketing. Zones are displayed as background rectangles. The length of the rectangle corresponds to the duration of the active trading, and the height to the trading range. For the current trading day, there is still the opportunity to show the extreme prices of each zone. The following parameters can be configured in the indicator: NumberOfDays = 200 - The number of days displayed.
HF PriceGrid
Wong Sze Wai
5 (1)
This indicator help you to easily calculate the price moving. You can change the gird size withing the input parameter for your trading style, such as hedge, swing trader, ect. It can let you easy to find your takeprofit and stoploss target price in chart. For more about my tools and EA, you can join my channel below, thank you. Telegram channel:   t.me/HenryEAChannel
FREE
My FX Journal
Nguyen Duy Thanh
This is a script in the entire application that records your trading logs that I created myself to practice trading skills. The whole set includes: script, and web app: https://myfxjournal.cloud It is very simple with only two options: Type (select dropdown) and Ticket (input). If you choose to record open positions, please choose Type = Opening_Trade, otherwise choose Type = Closed_Trading (this is under the Account History tab) ***********This is the part used on the website**********
이 제품의 구매자들이 또한 구매함
Gann Made Easy
Oleg Rodin
4.86 (83)
Gann Made Easy 는 mr.의 이론을 사용하여 최고의 거래 원칙을 기반으로 하는 전문적이고 사용하기 쉬운 Forex 거래 시스템입니다. W.D. 간. 이 표시기는 Stop Loss 및 Take Profit Levels를 포함하여 정확한 BUY 및 SELL 신호를 제공합니다. PUSH 알림을 사용하여 이동 중에도 거래할 수 있습니다. 구매 후 연락주세요! 내 거래 팁과 훌륭한 보너스 지표를 무료로 공유하겠습니다! 아마도 Gann 거래 방법에 대해 이미 여러 번 들었을 것입니다. 일반적으로 Gann의 이론은 초보자 거래자뿐만 아니라 이미 거래 경험이 있는 사람들에게도 매우 복잡한 것입니다. Gann의 거래 방식은 이론적으로 적용하기 쉽지 않기 때문입니다. 나는 그 지식을 연마하고 Forex 지표에 최고의 원칙을 적용하기 위해 몇 년을 보냈습니다. 표시기는 적용하기가 매우 쉽습니다. 차트에 첨부하고 간단한 거래 권장 사항을 따르기만 하면 됩니다. 지표는 지속적으로 시장 분석 작업
- Real price is 80$ - 40% Discount ( It is 49$ now ) Contact me for instruction, add group and any questions! Related Products:  Bitcoin Expert , Gold Expert Introduction The breakout and retest strategy is traded support and resistance levels. it involves price breaking through a previous level.  The break and retest strategy is designed to help traders do two main things, the first is to avoid false breakouts. Many false breakouts start with a candlestick that breaks out of a level but ends w
FX Volume
Daniel Stein
4.58 (33)
모닝 브리핑을 통해 세부 정보와 스크린샷으로 매일 시장 업데이트를 받으세요 여기 mql5 및 텔레그램에서 FX 거래량은 브로커의 관점에서 시장 심리에 대한 실제 통찰력을 제공하는 최초이자 유일한 거래량 지표입니다. 브로커와 같은 기관 시장 참여자가 외환 시장에서 어떤 포지션을 취하고 있는지에 대한 훌륭한 통찰력을 COT 보고서보다 훨씬 빠르게 제공합니다. 차트에서 이 정보를 직접 확인하는 것은 트레이딩의 진정한 판도를 바꾸고 획기적인 솔루션입니다. 다음과 같은 고유한 시장 데이터 인사이트의 이점 비율 는 통화의 매수/매도 포지션 비율을 백분율로 표시 비율 변화 는 선택한 기간 내 매수 비율과 비율 변화를 표시 총 거래량 는 해당 통화의 총 거래량(롱 및 숏)을 로트 단위로 보여줍니다 Volumes Long 는 해당 통화의 모든 롱 포지션의 거래량을 보여줍니다 Volumes Short 는 해당 통화의 모든 숏 포지션의 거래량을 보여줍니다 Net Long 는 순 롱 포지션의 거래량
Enigmera
Ivan Stefanov
5 (3)
에니메라: 시장의 핵심 https://www.enigmera.com 소개 이 지표 및 트레이딩 시스템은 금융 시장에 대한 놀라운 접근 방식입니다. 에니메라는 프랙탈 주기를 사용하여 지지선과 저항선을 정확하게 계산합니다. 진정한 축적 단계를 보여주고 방향과 목표를 제시합니다.  추세에 있든 조정에 있든 작동하는 시스템입니다.  어떻게 작동하나요? 에니메라는 지지선/저항선, 목표선, 편차선의 세 가지 라인으로 구성됩니다. 이 시스템은 과거 데이터를 현재와 미래로 추정하는 일반적인 시장 지표와 달리 현재에 대한 완전한 그림을 제공합니다. 지지선 위에 있으면 실제 지지를 의미하고 저항선 위에 있으면 실제 저항을 의미합니다. 레벨이 깨지면 추세의 변화를 나타냅니다. 다시 그리지 않습니다. 시장이 지속적으로 진화함에 따라 에니메라는 평가 도구를 조정하여 전략을 정기적으로 수정합니다.   이를 통해 모든 시나리오를 철저히 평가할 수 있습니다. 이 시장 지표의 고유성은 분명하며 그 기
Gold Stuff
Vasiliy Strukov
4.89 (241)
Gold Stuff는 금을 위해 특별히 설계된 추세 지표이며 모든 금융 상품에서도 사용할 수 있습니다. 표시기가 다시 그려지지 않고 지연되지 않습니다. 권장 기간 H1. 표시기에서 완전 자동 Expert Advisor EA Gold Stuff를 작동합니다. 내 프로필에서 찾을 수 있습니다. 설정 및 개인 보너스를 받으려면 구매 후 즉시 저에게 연락하십시오!   강력한 지원 및 트렌드 스캐너 표시기의 무료 사본을 받으실 수 있습니다. 메시지를 보내주세요. 나!   설정 화살표 그리기 - 켜기 끄기. 차트에 화살표 그리기. 경고 - 가청 경고를 끕니다. 이메일 알림 - 켜기 끄기. 이메일 알림. Puch-notification - 켜기 끄기. 푸시 알림. 다음으로 색 영역을 조정합니다. Gold Stuff는 금을 위해 특별히 설계된 추세 지표이며 모든 금융 상품에서도 사용할 수 있습니다. 표시기가 다시 그려지지 않고 지연되지 않습니다. 권장 기간 H1. 표시기에서 완
Atomic Analyst
Issam Kassas
5 (2)
우선적으로 언급할 점은이 거래 지표가 다시 그리지 않고 지연되지 않으며 이를 통해 수동 및 로봇 거래 모두에 이상적이라는 점입니다. 사용자 매뉴얼: 설정, 입력 및 전략. Atomic Analyst는 가격의 강도와 모멘텀을 활용하여 시장에서 더 나은 이점을 찾는 PA Price Action Indicator입니다. 고급 필터를 장착하여 잡음과 거짓 신호를 제거하고 거래 잠재력을 높이는 데 도움이 됩니다. 복잡한 지표의 다중 레이어를 사용하여 Atomic Analyst는 차트를 스캔하고 복잡한 수학적 계산을 간단한 신호와 색상으로 변환하여 초보 트레이더가 이해하고 일관된 거래 결정을 내릴 수 있도록합니다. "Atomic Analyst"는 새로운 및 경험이 풍부한 트레이더를위한 종합적인 거래 솔루션입니다. 프리미엄 지표와 최고 수준의 기능을 하나의 거래 전략에 결합하여 모든 종류의 트레이더에 대한 다재다능한 선택지가되었습니다. 인트라데이 거래 및 스캘핑 전략 : 빠르고 정확한
FX Power MT4 NG
Daniel Stein
5 (13)
모닝 브리핑 여기 mql5 와 텔레그램에서 FX Power MT4 NG 는 오랫동안 인기 있는 통화 강도 측정기인 FX Power의 차세대 버전입니다. 이 차세대 강도 측정기는 무엇을 제공합니까? 기존 FX Power에서 좋아했던 모든 것 PLUS GOLD/XAU 강도 분석 더욱 정밀한 계산 결과 개별 구성 가능한 분석 기간 더 나은 성능을 위한 사용자 정의 가능한 계산 한도 특별 멀티더 많은 것을보고 싶은 사람들을위한 특별한 다중 인스턴스 설정 모든 차트에서 좋아하는 색상을위한 끝없는 그래픽 설정 수많은 알림 옵션, 중요한 것을 다시는 놓치지 않도록 Windows 11 및 macOS 스타일의 둥근 모서리가 있는 새로운 디자인 마법처럼 움직이는 인디케이터 패널 FX 파워 키 특징 모든 주요 통화의 완전한 강세 이력 모든 시간대에 걸친 통화 강세 이력 모든 브로커 및 차트에서 고유 계산 결과 100% 신뢰할 수있는 실시간100 % 신뢰할 수있는 실시간 계산-> 다시 칠하지 않음
Trend Punch
Mohamed Hassan
4.95 (19)
This indicator is unstoppable when combined with our other indicator called  Support & Resistance . After purchase, send us a message and you will get it   for  FREE as a BONUS! Introducing Trend Punch , the revolutionary forex trend indicator that will transform the way you trade! Trend Punch is uniquely designed to provide precise buy and sell arrows during strong market trends, making your trading decisions clearer and more confident. Whether you're trading major currency pairs or exotic sym
Gann Swing Structure
Kirill Borovskii
5 (1)
This indicator is based on the mathematics of the great trader W.D. Ganna. With its help, you can easily find strong levels by analyzing swings to find the optimal entry point. The indicator works on all instruments and all timeframes. The indicator is fully manual and has control buttons. All you need to do is press the NEW button, a segment will appear, which you can place on any movement, swing or even 1 candle that you want to analyze. By placing the segment, press the OK button. A grid (th
Scalper Inside PRO
Alexey Minkov
4.73 (56)
An exclusive indicator that utilizes an innovative algorithm to swiftly and accurately determine the market trend. The indicator automatically calculates opening, closing, and profit levels, providing detailed trading statistics. With these features, you can choose the most appropriate trading instrument for the current market conditions. Additionally, you can easily integrate your own arrow indicators into Scalper Inside Pro to quickly evaluate their statistics and profitability. Scalper Inside
Dynamic Forex28 Navigator
Bernhard Schweigert
5 (1)
Dynamic Forex28 Navigator - 차세대 외환 거래 도구. 현재 49% 할인. Dynamic Forex28 Navigator는 오랫동안 인기 있는 지표의 진화형으로, 세 가지의 힘을 하나로 결합했습니다. 고급 통화 Strength28 지표(695개 리뷰) + 고급 통화 IMPULSE with ALERT(520개 리뷰) + CS28 콤보 신호(보너스). 지표에 대한 자세한 정보 https://www.mql5.com/en/blogs/post/758844 차세대 Strength 지표는 무엇을 제공합니까?  원래 지표에서 좋아했던 모든 것이 새로운 기능과 더 높은 정확도로 강화되었습니다. 주요 기능: 독점적인 통화 Strength 공식.  모든 시간대에 걸쳐 부드럽고 정확한 강도선. 추세와 정확한 진입을 식별하는 데 이상적입니다. 역동적인 시장 피보나치 수준(시장 피보나치).  이 지표에만 있는 고유한 기능. 가격 차트가 아닌 통화 강도에 피보나치가 적용
현재 20% 할인 ! 초보자 또는 전문가 트레이더를 위한 최고의 솔루션! 이 대시보드 소프트웨어는 28개의 통화 쌍에서 작동합니다. 2가지 주요 지표(Advanced Currency Strength 28 및 Advanced Currency Impulse)를 기반으로 합니다. 전체 Forex 시장에 대한 훌륭한 개요를 제공합니다. 고급 통화 강도 값, 통화 이동 속도 및 모든(9) 시간대의 28 Forex 쌍에 대한 신호를 보여줍니다. 추세 및/또는 스캘핑 기회를 정확히 파악하기 위해 차트의 단일 지표를 사용하여 전체 시장을 볼 수 있을 때 거래가 어떻게 개선될지 상상해 보십시오! 잠재적인 거래를 식별하고 확인하면서 강력한 통화와 약한 통화를 더욱 쉽게 식별할 수 있도록 이 지표에 기능을 내장했습니다. 이 표시기는 통화의 강세 또는 약세가 증가 또는 감소하는지 여부와 모든 시간대에서 수행되는 방식을 그래픽으로 보여줍니다. 추가된 새로운 기능은 현재 시장 조건 변화에 적
Trend Screener
STE S.S.COMPANY
4.81 (88)
트렌드 표시기, 트렌드 트레이딩 및 필터링을 위한 획기적인 고유 솔루션, 하나의 도구 안에 내장된 모든 중요한 트렌드 기능! Forex, 상품, 암호 화폐, 지수 및 주식과 같은 모든 기호/도구에 사용할 수 있는 100% 다시 칠하지 않는 다중 시간 프레임 및 다중 통화 표시기입니다. 기간 한정 특가: 지원 및 저항 스크리너 지표는 단 100달러에 평생 제공됩니다. (원래 가격 50 달러) (제안 연장) Trend Screener는 차트에 점이 있는 화살표 추세 신호를 제공하는 효율적인 지표 추세 추종 지표입니다. 추세 분석기 표시기에서 사용할 수 있는 기능: 1. 트렌드 스캐너. 2. 최대 이익 분석이 있는 추세선. 3. 추세 통화 강도 측정기. 4. 경고가 있는 추세 반전 점. 5. 경고가 있는 강력한 추세 점. 6. 추세 화살표 Trend Screener Indicator가 있는 일일 분석 예, 일일 신호 성능...등은 여기에서 찾을 수 있습니다.   여기를 클릭하십시오.
TPSproTREND PrO
Roman Podpora
4.79 (19)
TPSpro TREND PRO는   시장을 자동으로 분석하여 추세와 각 변화에 대한 정보를 제공할 뿐만 아니라 다시 그리지 않고도 거래에 진입할 수 있는 신호를 제공하는 추세 지표입니다! 지표는 각 양초를 사용하여 개별적으로 분석합니다. 다른 임펄스를 언급합니다 - 업 또는 다운 임펄스. 통화, 암호화폐, 금속, 주식, 지수 거래의 정확한 진입점! 버전 MT5                   표시기에 대한 전체 설명       표시기   와 함께 사용하는 것이 좋습니다   -   RFI LEVELS 주요 기능: 렌더링 없이 정확한 입력 신호! 신호가 나타나면 관련성은 유지됩니다! 이는 신호를 제공한 후 변경하여 예금 자금 손실을 초래할 수 있는 다시 그리기 지표와의 중요한 차이점입니다. 이제 더 큰 확률과 정확도로 시장에 진입할 수 있습니다. 화살표가 나타난 후 목표에 도달(이익실현)하거나 반전 신호가 나타날 때까지 캔들을 색칠하는 기능도 있습니다. STOP LOSS / TAK
ON Trade Waves Patterns Harmonic Elliot Wolfe를 소개합니다. 이는 수동 및 자동 방법을 사용하여 다양한 시장 패턴을 감지하기 위해 개발된 고급 지표입니다. 다음은 그 작동 방식입니다: 조화적 패턴: 이 지표는 차트에 나타나는 조화적 패턴을 식별할 수 있습니다. 이러한 패턴은 Scott Carney의 "Harmonic Trading vol 1 및 2"에서 설명한 것처럼 조화적 거래 이론을 연습하는 트레이더에게 중요합니다. 수동으로 그리든 자동 감지를 사용하든 ON Trade Waves Patterns가 도움을 줄 것입니다. 컨트롤 패널: 이 지표에는 사용자 친화적인 컨트롤 패널이 있습니다. 차트 및 시간 프레임 설정을 저장하여 다양한 구성 간에 쉽게 전환할 수 있습니다. 차트 공간을 최대화하려면 최소화할 수도 있습니다. 다른 분석 도구를 사용하는 것을 선호하는 경우 닫기 버튼을 클릭하여 모든 지표 데이터를 숨길 수 있습니다. 템플릿 저장: 설정을 사
Scalper Vault
Oleg Rodin
5 (27)
Scalper Vault 는 성공적인 스캘핑에 필요한 모든 것을 제공하는 전문 스캘핑 시스템입니다. 이 표시기는 외환 및 바이너리 옵션 거래자가 사용할 수 있는 완전한 거래 시스템입니다. 권장 시간 프레임은 M5입니다. 시스템은 추세 방향으로 정확한 화살표 신호를 제공합니다. 또한 상단 및 하단 신호와 Gann 시장 수준을 제공합니다.  이 시스템은 사용하기가 매우 쉽습니다. 원하는 시장 지역의 화살표만 따라가면 됩니다. 엑시트는 가격이 적정 수준에 도달하거나 시장의 고점 또는 저점 신호가 나타날 때 수행됩니다.  표시기는 PUSH 알림을 포함한 모든 유형의 경고를 제공합니다. 인디케이터 구매 후 연락주세요. 내 개인 거래 권장 사항과 훌륭한 보너스 지표를 무료로 공유합니다! 나는 당신에게 행복하고 유익한 거래를 기원합니다!
TPA True Price Action indicator reveals the true price action of the market makers through 100% non-repainting signals (except early signals mode) strictly at the close of a candle! TPA shows entries and re-entries, every time the bulls are definitely stronger than the bears and vice versa. Not to confuse with red/green candles. The shift of power gets confirmed at the earliest stage and is ONE exit strategy of several. There are available now two free parts of the TPA User Guide for our custo
Stratos Pali
Michela Russo
5 (1)
Stratos Pali Indicator   is a revolutionary tool designed to enhance your trading strategy by accurately identifying market trends. This sophisticated indicator uses a unique algorithm to generate a complete histogram, which records when the trend is Long or Short. When a trend reversal occurs, an arrow appears, indicating the new direction of the trend. Important Information Revealed Leave a review and contact me via mql5 message to receive My Top 5 set files for Stratos Pali at no cost! D
Currency Strength Wizard
Oleg Rodin
4.93 (44)
통화 강도 마법사는 성공적인 거래를 위한 올인원 솔루션을 제공하는 매우 강력한 지표입니다. 표시기는 여러 시간 프레임의 모든 통화 데이터를 사용하여 이 또는 해당 외환 쌍의 힘을 계산합니다. 이 데이터는 특정 통화의 힘을 확인하는 데 사용할 수 있는 사용하기 쉬운 통화 지수 및 통화 전력선의 형태로 표시됩니다. 필요한 것은 거래하려는 차트에 표시기를 부착하는 것뿐입니다. 표시기는 거래하는 통화의 실제 강세를 보여줍니다. 지표는 또한 추세와 거래할 때 유리하게 사용할 수 있는 구매 및 판매 거래량 압력의 극한값을 보여줍니다. 지표는 또한 피보나치에 기반한 가능한 대상을 보여줍니다. 표시기는 PUSH 알림을 포함한 모든 유형의 알림을 제공합니다. 구매 후 연락주세요. 나는 당신과 거래 팁을 공유하고 당신에게 무료로 훌륭한 보너스 지표를 줄 것입니다! 나는 당신에게 행복하고 유익한 거래를 기원합니다!
PRO Renko System
Oleg Rodin
5 (25)
PRO Renko System 은 RENKO 차트 거래를 위해 특별히 고안된 매우 정확한 거래 시스템입니다. 이것은 다양한 거래 상품에 적용될 수있는 보편적 인 시스템입니다. 체계는 효과적으로 당신에게 정확한 반전 신호에 접근을 주는 소위 시장 소음을 중화합니다. 이 표시기는 사용하기가 매우 쉽고 신호 생성을 담당하는 매개 변수가 하나만 있습니다. 당신은 쉽게 당신의 선택의 어떤 무역 계기에 공구를 적응시킬 수 있고 renko 막대기의 크기. 나는 항상 당신이 내 소프트웨어로 수익성있게 거래 할 수 있도록 추가 지원을 제공 할 준비가되어 있습니다! 나는 당신에게 행복하고 수익성있는 거래를 기원합니다! 구매 후 저에게 연락하십시오! 내 렌코 차트 생성기를 보내드립니다. 또한 내 개인 권장 사항 및 시스템의 다른 모듈을 무료로 공유 할 것입니다!
TPSpro RFI Levels
Roman Podpora
4.82 (22)
지침         러시아   -        영어       표시기와 함께 사용하는 것이 좋습니다   .       -       TPSpro   트렌드 프로 -   MT4 버전         거래에서 핵심 요소는 거래 상품을 매수 또는 매도하기로 결정하는 구역 또는 수준입니다. 주요 업체가 시장에서 자신의 존재를 숨기려는 시도에도 불구하고, 그들은 필연적으로 흔적을 남깁니다. 우리의 과제는 이러한 흔적을 식별하고 올바르게 해석하는 방법을 배우는 것이었습니다. 주요 기능:: 판매자와 구매자를 위한 활성 영역을 표시합니다! 이 지표는 매수 및 매도를 위한 모든 올바른 초기 임펄스 레벨/존을 보여줍니다. 진입점 검색이 시작되는 이러한 레벨/존이 활성화되면 레벨의 색상이 바뀌고 특정 음영으로 채워집니다. 또한 상황을 보다 직관적으로 이해하기 위해 화살표가 나타납니다. 더 높은 시간대의 레벨/존 표시(MTF 모드) 더 높은 시간 간격을 사용하여 레벨/존을 표시하는 기능을 추가했습니다.
Currency Strength Exotics
Bernhard Schweigert
4.87 (30)
현재 20% 할인! 초보자 또는 전문가 트레이더를 위한 최고의 솔루션! 이 표시기는 Exotic Pairs Commodities, Indexes 또는 Futures와 같은 기호에 대한 통화 강도를 표시하는 데 특화되어 있습니다. 금, 은, 석유, DAX, US30, MXN, TRY, CNH 등의 진정한 통화 강도를 보여주기 위해 9번째 줄에 모든 기호를 추가할 수 있습니다. 이것은 독특하고 고품질이며 저렴한 거래 도구입니다. 우리는 많은 독점 기능과 새로운 공식을 통합했습니다. 새로운 추세 또는 스캘핑 기회의 정확한 트리거 포인트를 정확히 찾아낼 수 있기 때문에 거래가 어떻게 개선될지 상상해 보십시오. 사용 설명서: 여기를 클릭 https://www.mql5.com/en/blogs/post/708876 모든 시간대에 작동합니다. TREND를 빠르게 확인할 수 있습니다! 새로운 기본 알고리즘을 기반으로 설계되어 잠재적인 거래를 더욱 쉽게 식별하고 확인할 수 있습니다.
Trend Pulse
Mohamed Hassan
5 (4)
Please contact me after purchase to immediately get your PDF strategy + documentation for Trend Pulse !  Introducing Trend Pulse , a unique and robust indicator capable of detecting bullish, bearish, and even ranging trends! Trend Pulse uses a special algorithm to filter out market noise with real precision. If the current symbol is moving sideways, Trend Pulse will send you a ranging signal, letting you know that it's not a good time to enter a trade. This excellent system makes Trend Pulse
우선적으로, 이 거래 도구는 전문적인 거래에 이상적인 비-다시 그리기 및 지연되지 않는 지표입니다.  온라인 강좌, 사용자 매뉴얼 및 데모. 스마트 가격 액션 컨셉트 인디케이터는 신규 및 경험 많은 트레이더 모두에게 매우 강력한 도구입니다. Inner Circle Trader Analysis 및 Smart Money Concepts Trading Strategies와 같은 고급 거래 아이디어를 결합하여 20가지 이상의 유용한 지표를 하나로 결합합니다. 이 인디케이터는 스마트 머니 컨셉트에 중점을 두어 대형 기관의 거래 방식을 제공하고 이동을 예측하는 데 도움을 줍니다.  특히 유동성 분석에 뛰어나 기관이 어떻게 거래하는지 이해하는 데 도움을 줍니다. 시장 트렌드를 예측하고 가격 변동을 신중하게 분석하는 데 탁월합니다. 귀하의 거래를 기관 전략에 맞추어 시장의 동향에 대해 더 정확한 예측을 할 수 있습니다. 이 인디케이터는 시장 구조를 분석하고 중요한 주문 블록을 식별하고 다양한
MetaBands M4
Vahidreza Heidar Gholami
5 (2)
MetaBands uses powerful and unique algorithms to draw channels and detect trends so that it can provide traders with potential points for entering and exiting trades. It’s a channel indicator plus a powerful trend indicator. It includes different types of channels which can be merged to create new channels simply by using the input parameters. MetaBands uses all types of alerts to notify users about market events. Features Supports most of the channel algorithms Powerful trend detection algorith
ICT, SMC, SMART MONEY CONCEPTS, SMART MONEY, Smart Money Concept, Support and Resistance, Trend Analysis, Price Action, Market Structure, Order Blocks, BOS/CHoCH,   Breaker Blocks ,  Momentum Shift,   Supply&Demand Zone/Order Blocks , Strong Imbalance, HH/LL/HL/LH,    Fair Value Gap, FVG,  Premium  &   Discount   Zones, Fibonacci Retracement, OTE, Buy Side Liquidity, Sell Side Liquidity, BSL/SSL Taken, Equal Highs & Lows, MTF Dashboard, Multiple Time Frame, BigBar, HTF OB, HTF Market Structure, 
Gold Channel XAUUSD
Paulo Rocha
5 (2)
Gold Channel is a volatility-based indicator, developed with a specific timing algorithm for the XAUUSD pair, which consists of finding possible corrections in the market. This indicator shows two outer lines, an inner line (retracement line) and an arrow sign, where the theory of the channel is to help identify overbought and oversold conditions in the market. The market price will generally fall between the boundaries of the channel. If prices touch or move outside the channel it is a tra
Market Reversal Alerts
LEE SAMSON
4.19 (113)
가격이 역전되고 후퇴함에 따라 시장 구조가 변경됩니다. 시장 구조 반전 경고 표시기는 추세 또는 가격 움직임이 고갈에 가까워지고 반전할 준비가 되었음을 식별합니다. 일반적으로 반전이나 큰 하락이 일어나려고 할 때 발생하는 시장 구조의 변화를 알려줍니다. 지표는 가능한 고갈 지점 근처에서 새로운 고점 또는 저점이 형성될 때마다 초기에 돌파와 가격 모멘텀을 식별합니다. 표시기는 반대쪽에 있는 마지막 촛불에 직사각형을 그립니다. 그런 다음 현재의 단기 추세에서 계속 움직이기 때문에 가격과 함께 직사각형을 따라갈 것입니다. 가격이 사각형 위나 아래로 다시 닫힐 정도로 약해지면 시장 구조에 잠재적인 변화가 일어나고 있음을 나타냅니다. 그런 다음 표시기는 방향의 잠재적인 이동과 추세 또는 주요 하락의 가능한 반전 시작에 대해 경고합니다. 작동 방식을 보려면 아래의 작동 표시기를 참조하십시오! 여기에서 모든 쌍 및 기간을 모니터링하기 위한 선택적 대시보드 추가 기능: https://
Automated Trendlines
Georgios Kalomoiropoulos
5 (16)
추세선은 외환 거래에서 기술적 분석의 가장 필수적인 도구입니다. 불행히도, 대부분의 거래자는 올바르게 그리지 않습니다. 자동 추세선 표시기는 시장의 추세 움직임을 시각화하는 데 도움이 되는 진지한 거래자를 위한 전문 도구입니다. 추세선 강세 추세선과 약세 추세선에는 두 가지 유형이 있습니다. 상승 추세에서 Forex 추세선은 가격 움직임의 가장 낮은 스윙 포인트를 통해 그려집니다. 최소 두 개의 "최저 저점"을 연결하면 추세선이 생성됩니다. 하락 추세에서 추세선은 가격 움직임의 가장 높은 스윙 포인트를 통해 그려집니다. 최소 두 개의 "최고 최고점"을 연결하면 추세선이 생성됩니다. 추세선이 깨질 때? 강세 추세선은 약세 양초가 강세 추세선 아래에서 닫히고 양초의 고점이 추세선 위에 있을 때 깨집니다. 약세 추세선은 강세 양초가 약세 추세선 위로 마감되고 양초 저점이 추세선 아래에 있을 때 깨집니다. 추세선이 삭제되면? 강세 추
Reversal Sniper is designed to find the extreme reversals of the price. Indicator collects data of Cycle Sniper Indicator. NOTE: REVERSAL SNIPER Indicator is made for Cycle Sniper Users as an additional tool.  However, it can be used by the traders who look for finding out strong reversal levels. Indicator works on all timeframes and all instruments. Reversal  Sniper  Checks: Harmonic Patterns RSI Zig Zag and Harmonic Swings Cycle Sniper Indicator's Buy / Sell Signals The complex algo i
필터:
리뷰 없음
리뷰 답변