ChartOverlay
- 지표
- Sergii Krasnyi
- 버전: 1.0
ChartOverlay indicator has two main functions
1. mirroring - i.e. for example, it will make USDEUR from EURUSD
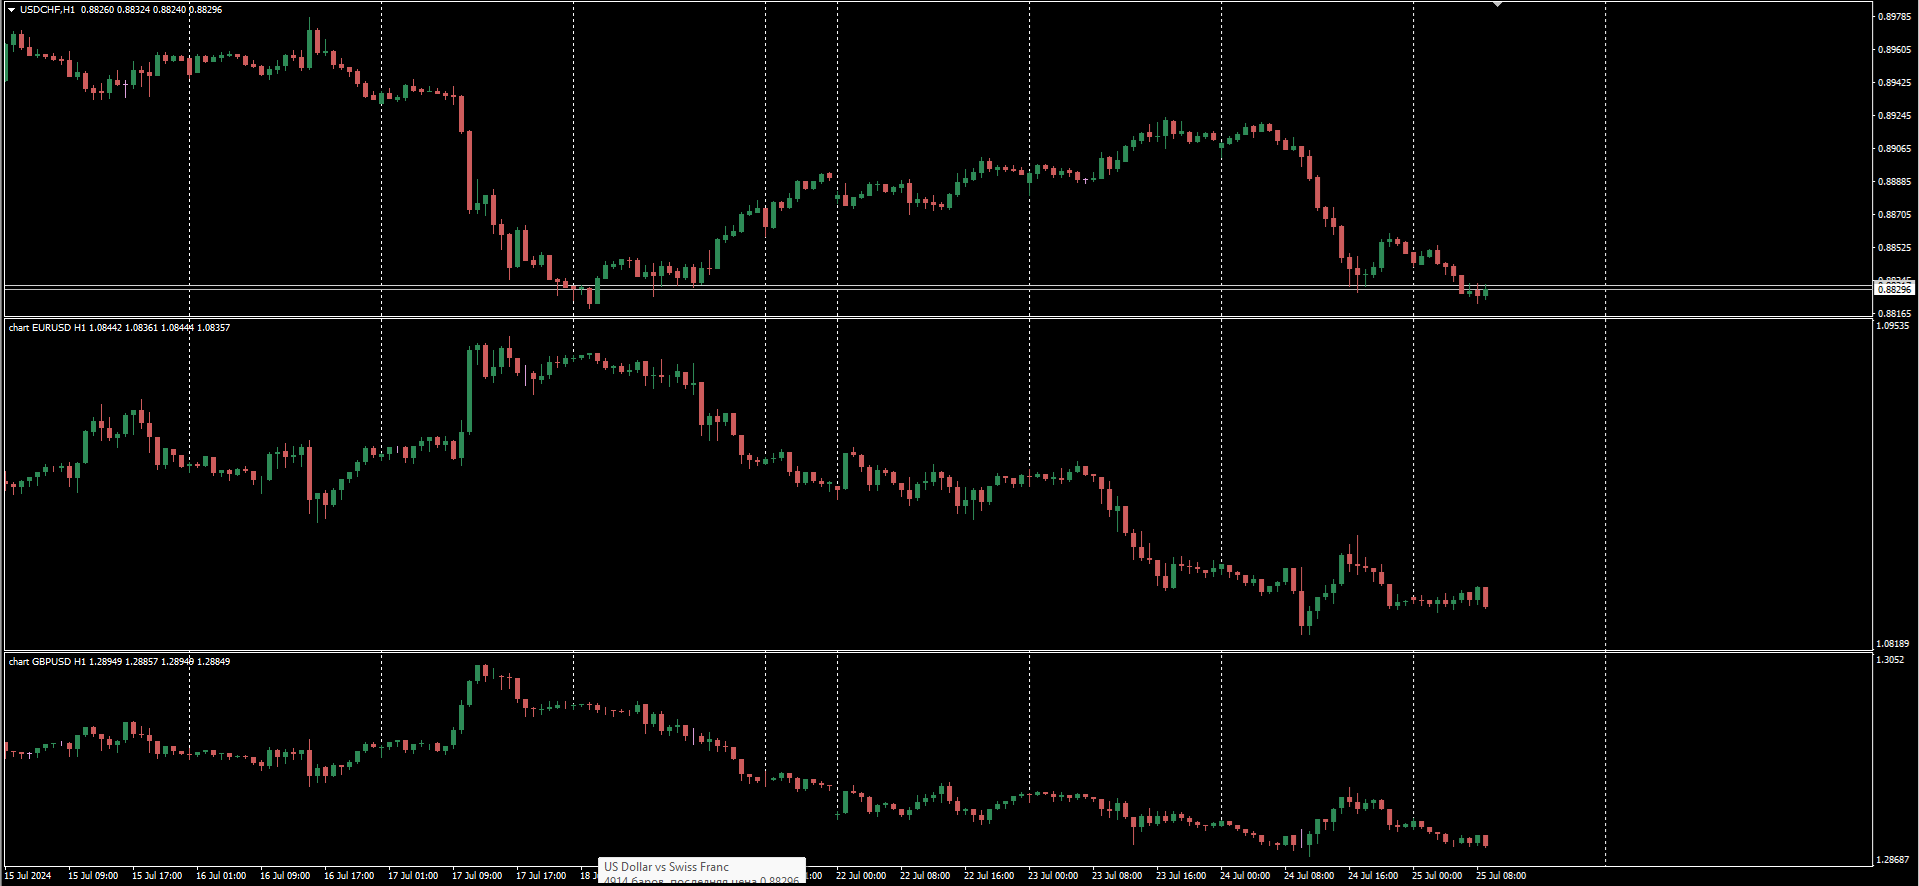
2. displaying the price chart of the selected financial instrument (with selected period) in the subwindow of the main chart.
This tool allows traders to easily analyze the relationship between different currency pairs and assets, offering unique customization and visualization features.
Key Features:
-
Price Chart Display:
The indicator displays the price chart of the selected instrument in a separate sub-window, allowing users to track its changes alongside the main chart.
-
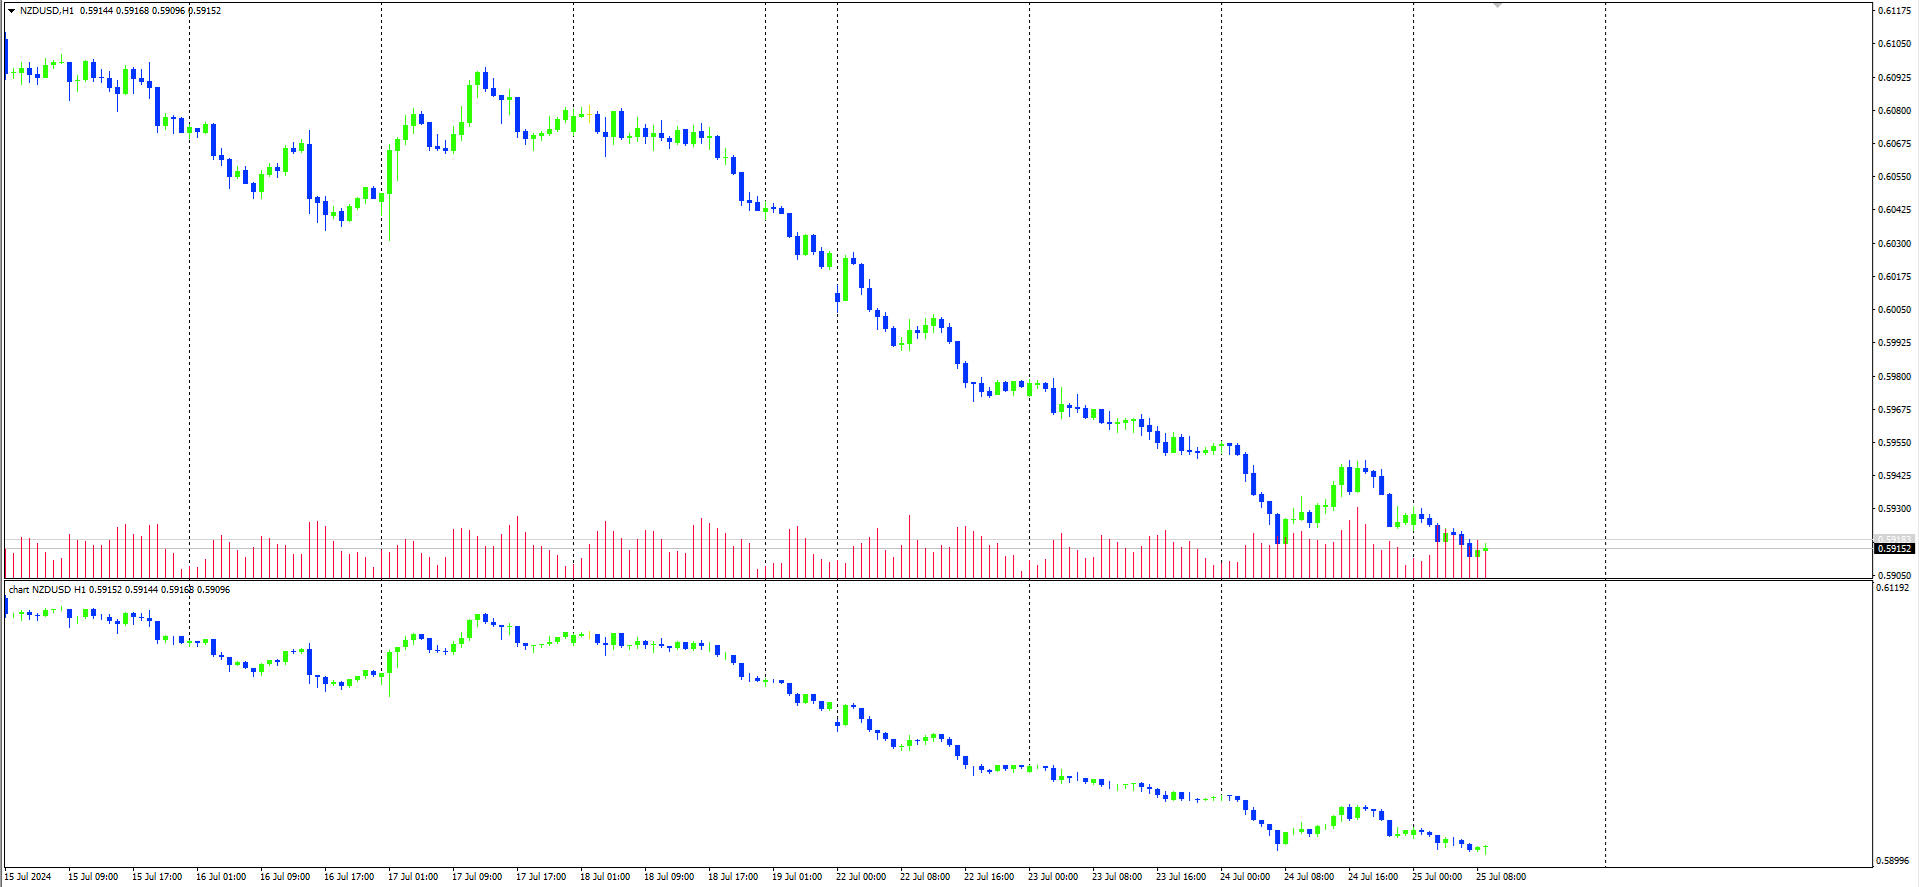
Redrawing (Mirroring) Function:
The indicator supports a mirroring function, allowing, for example, to transform the EUR/USD chart into USD/EUR. This enables analysis of reverse currency pairs without the need to switch between instruments.
-
Color Customization:
Users can choose whether the indicator's colors will copy the main chart's colors or set their own colors for better visualization and personalization.
-
Instrument and Timeframe Selection:
The indicator's parameters include selecting the financial instrument (e.g., currency pair, stock, index) and the timeframe (e.g., minute, hourly, daily chart). This provides flexibility and convenience in data analysis.
Advantages of Using ChartOverlay:
- Ease of Analysis: Displaying an additional chart in the sub-window allows for more efficient comparison and analysis of the relationships between instruments.
- Personalization: The ability to customize colors and display parameters allows the indicator to be tailored to the trader's individual preferences.
- Mirroring Function: The unique mirroring capability offers new ways to analyze and make trading decisions.