Separated Volume
- 지표
- Ivan Stefanov
- 버전: 1.2
- 업데이트됨: 19 8월 2024
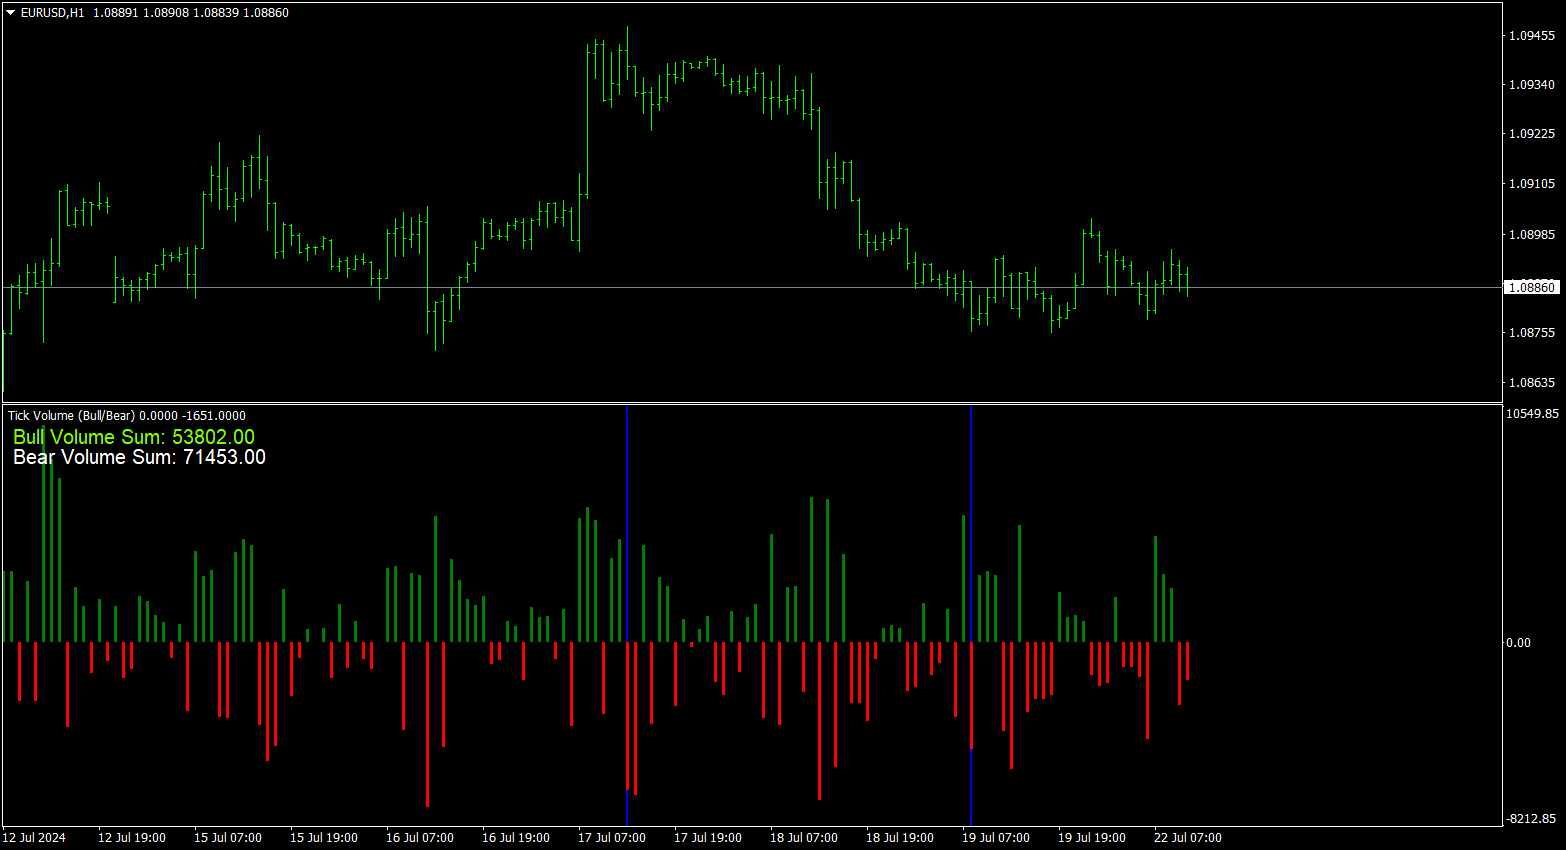
이 지표는 외환 시장의 틱 거래량을 강세와 약세 카테고리로 효과적으로 구분합니다.
또한 선택한 기간 동안 강세 및 약세 틱 거래량의 합계를 계산하여 표시하는 기능도 제공합니다.
차트에서 파란색 선 두 개를 움직여 기간을 쉽게 조정할 수 있으므로 거래 요구에 맞는 맞춤형 거래량 분석을 할 수 있습니다.
유용하게 사용하셨다면 리뷰를 남겨주시면 감사하겠습니다!
행복한 거래 되세요!
이 지표는 외환 시장의 틱 거래량을 강세와 약세 카테고리로 효과적으로 구분합니다.
또한 선택한 기간 동안 강세 및 약세 틱 거래량의 합계를 계산하여 표시하는 기능도 제공합니다.
차트에서 파란색 선 두 개를 움직여 기간을 쉽게 조정할 수 있으므로 거래 요구에 맞는 맞춤형 거래량 분석을 할 수 있습니다.
유용하게 사용하셨다면 리뷰를 남겨주시면 감사하겠습니다!
행복한 거래 되세요!