Fractal Bot Gold
- Experts
- Denys Babiak
- 버전: 1.0
- 활성화: 5
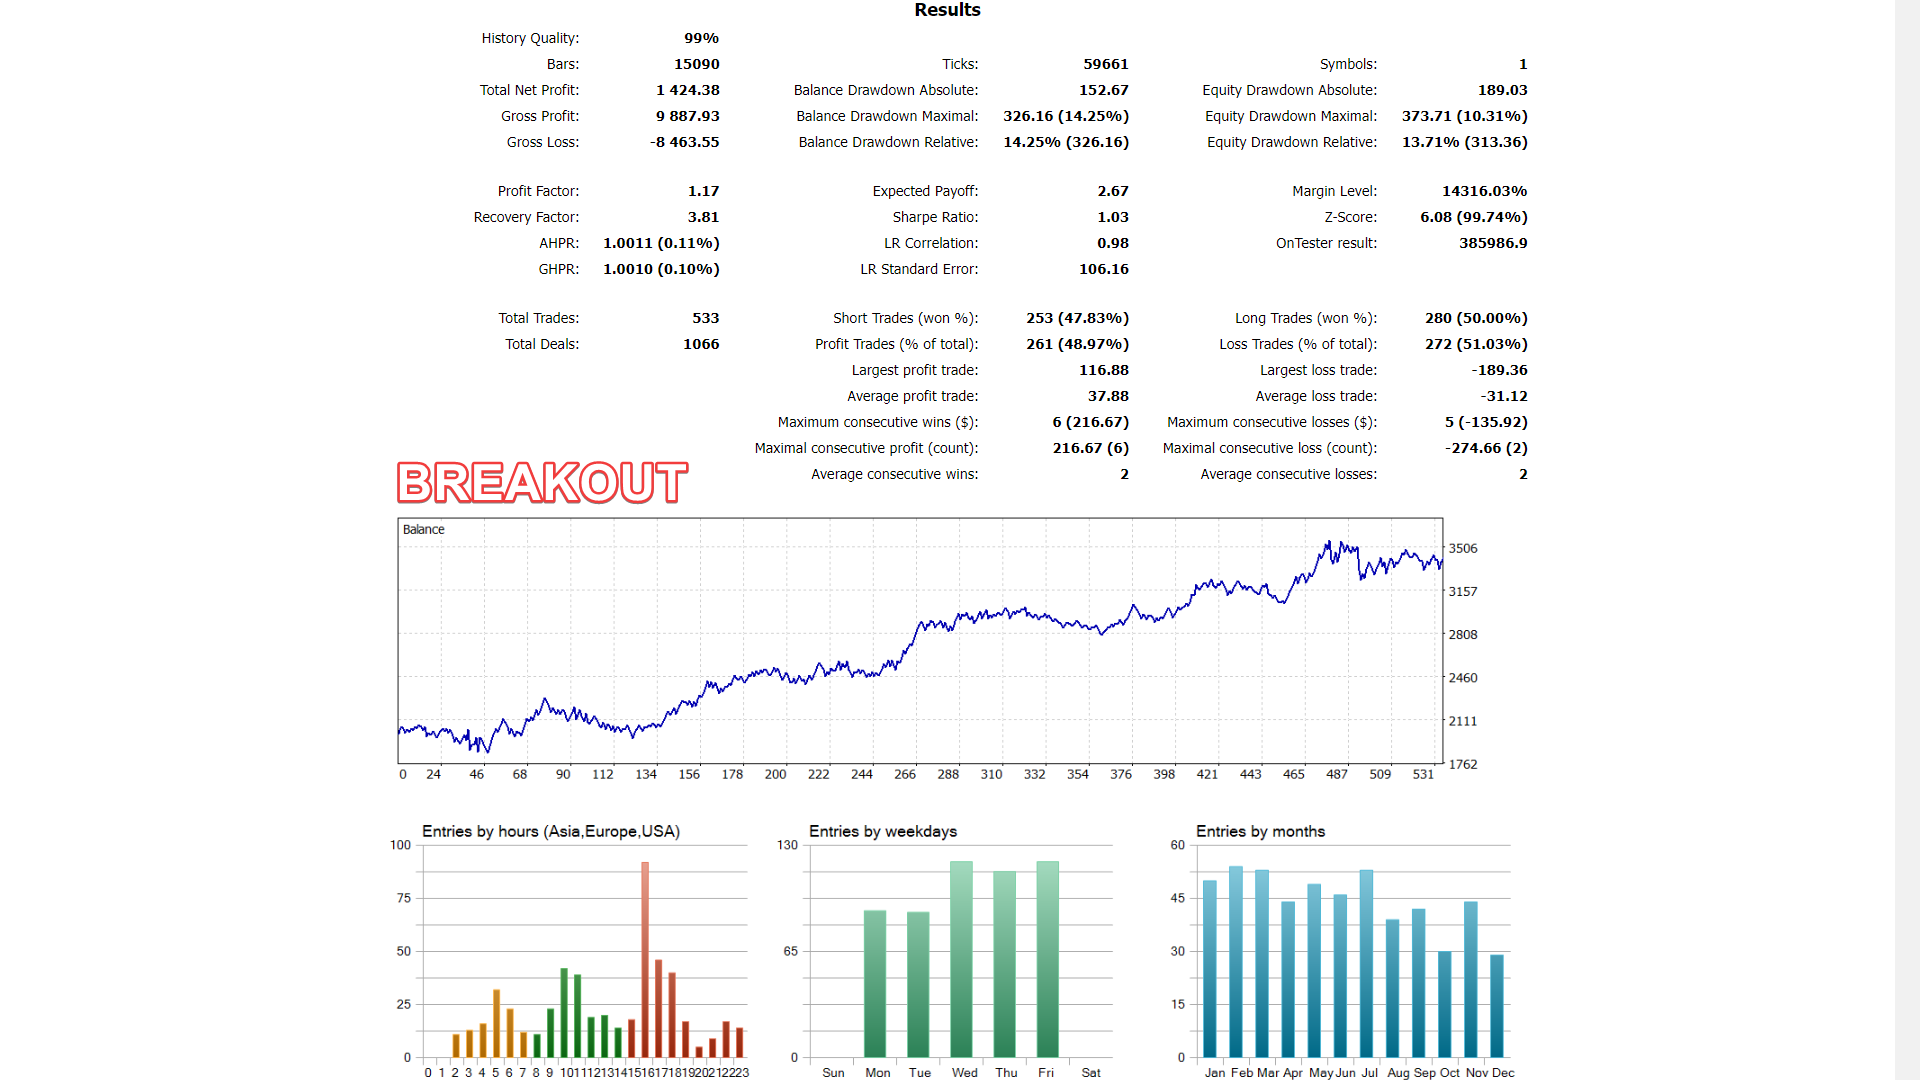
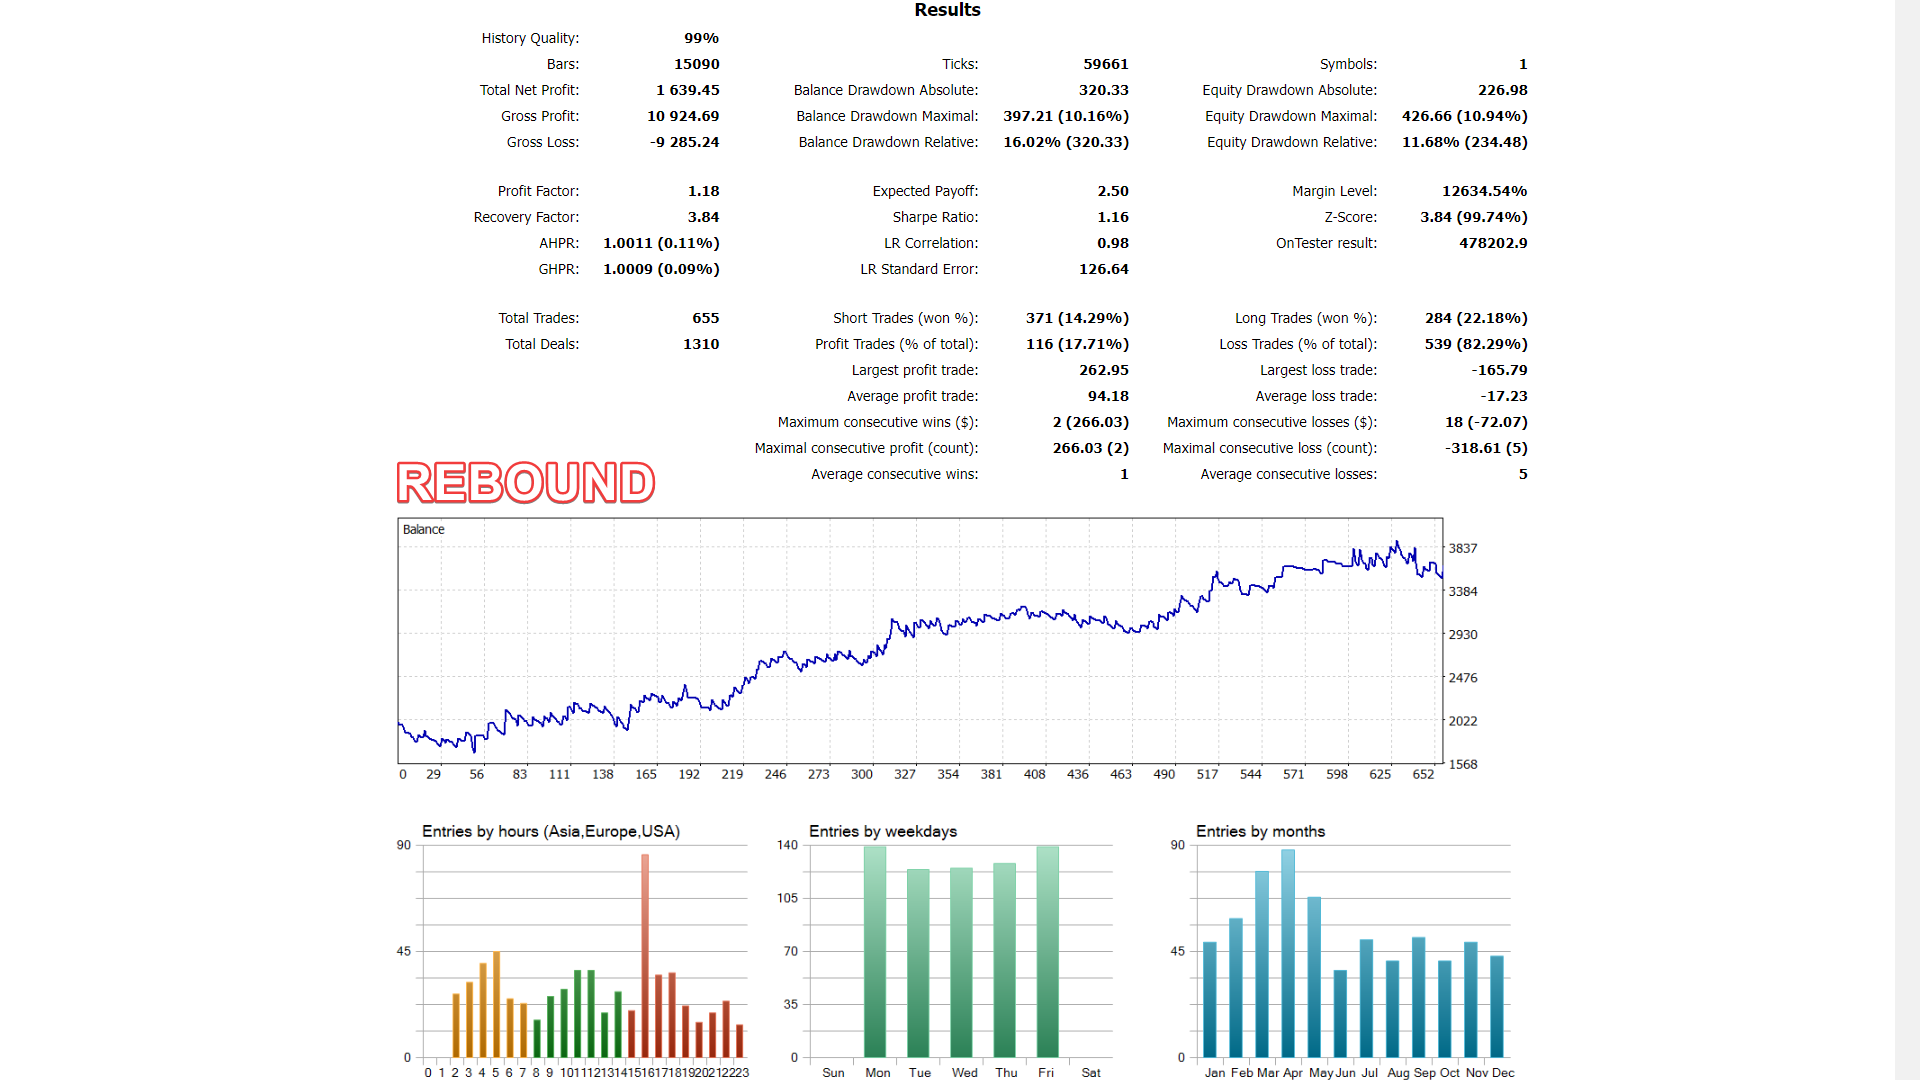
Fractal Bot Gold is a trading bot that utilizes breakout and rebound strategies from fractal levels to determine effective entry points for positions, as well as to set safe stop-losses and take-profits. Combined with the Average True Range (ATR) indicator and precise adaptation to market conditions, it minimizes the impact of market noise and volatility, providing reliable risk management and optimizing profits.
The bot’s parameters are carefully optimized and adapted for trading the Gold (XAUUSD) instrument. In the comments section, you will also find configuration (*.set) files for both breakout and rebound trading styles. Due to the openness of the input parameters, you can easily optimize the bot for any other preferred trading instruments.
This product is also available for MetaTrader 4 terminal: https://www.mql5.com/en/market/product/120443
Bot Advantages:
- Key Level Identification: Fractal Bot Gold uses fractals to precisely identify support and resistance levels, aiding in market direction forecasting and potential reversals.
- Market Reversal Identification: The bot effectively identifies price reversal points, allowing you to open and close positions in a timely manner, reducing loss risk and increasing profit potential.
- Market Dynamics Analysis: Fractal Bot Gold analyzes the current trend and its strength, providing accurate signals for determining bullish and bearish trends, as well as potential direction changes.
- Noise Reduction: The bot smooths out market noise and excludes insignificant fluctuations, helping you focus on significant movements and improving the accuracy of trading decisions.
- Flexible Trading Strategies: Fractal Bot Gold adapts to both trending and counter-trending strategies, allowing for effective trading in various market conditions.
- Objective Trading Signals: The use of fractals ensures objective signals for entry and exit, reducing emotional influence and enhancing trading efficiency.
- Volatility Resilience: The bot handles high market volatility effectively, providing decisions based on significant levels rather than random fluctuations.
Key Features of the Bot:
- 1. Using Fractals for Position Entry:
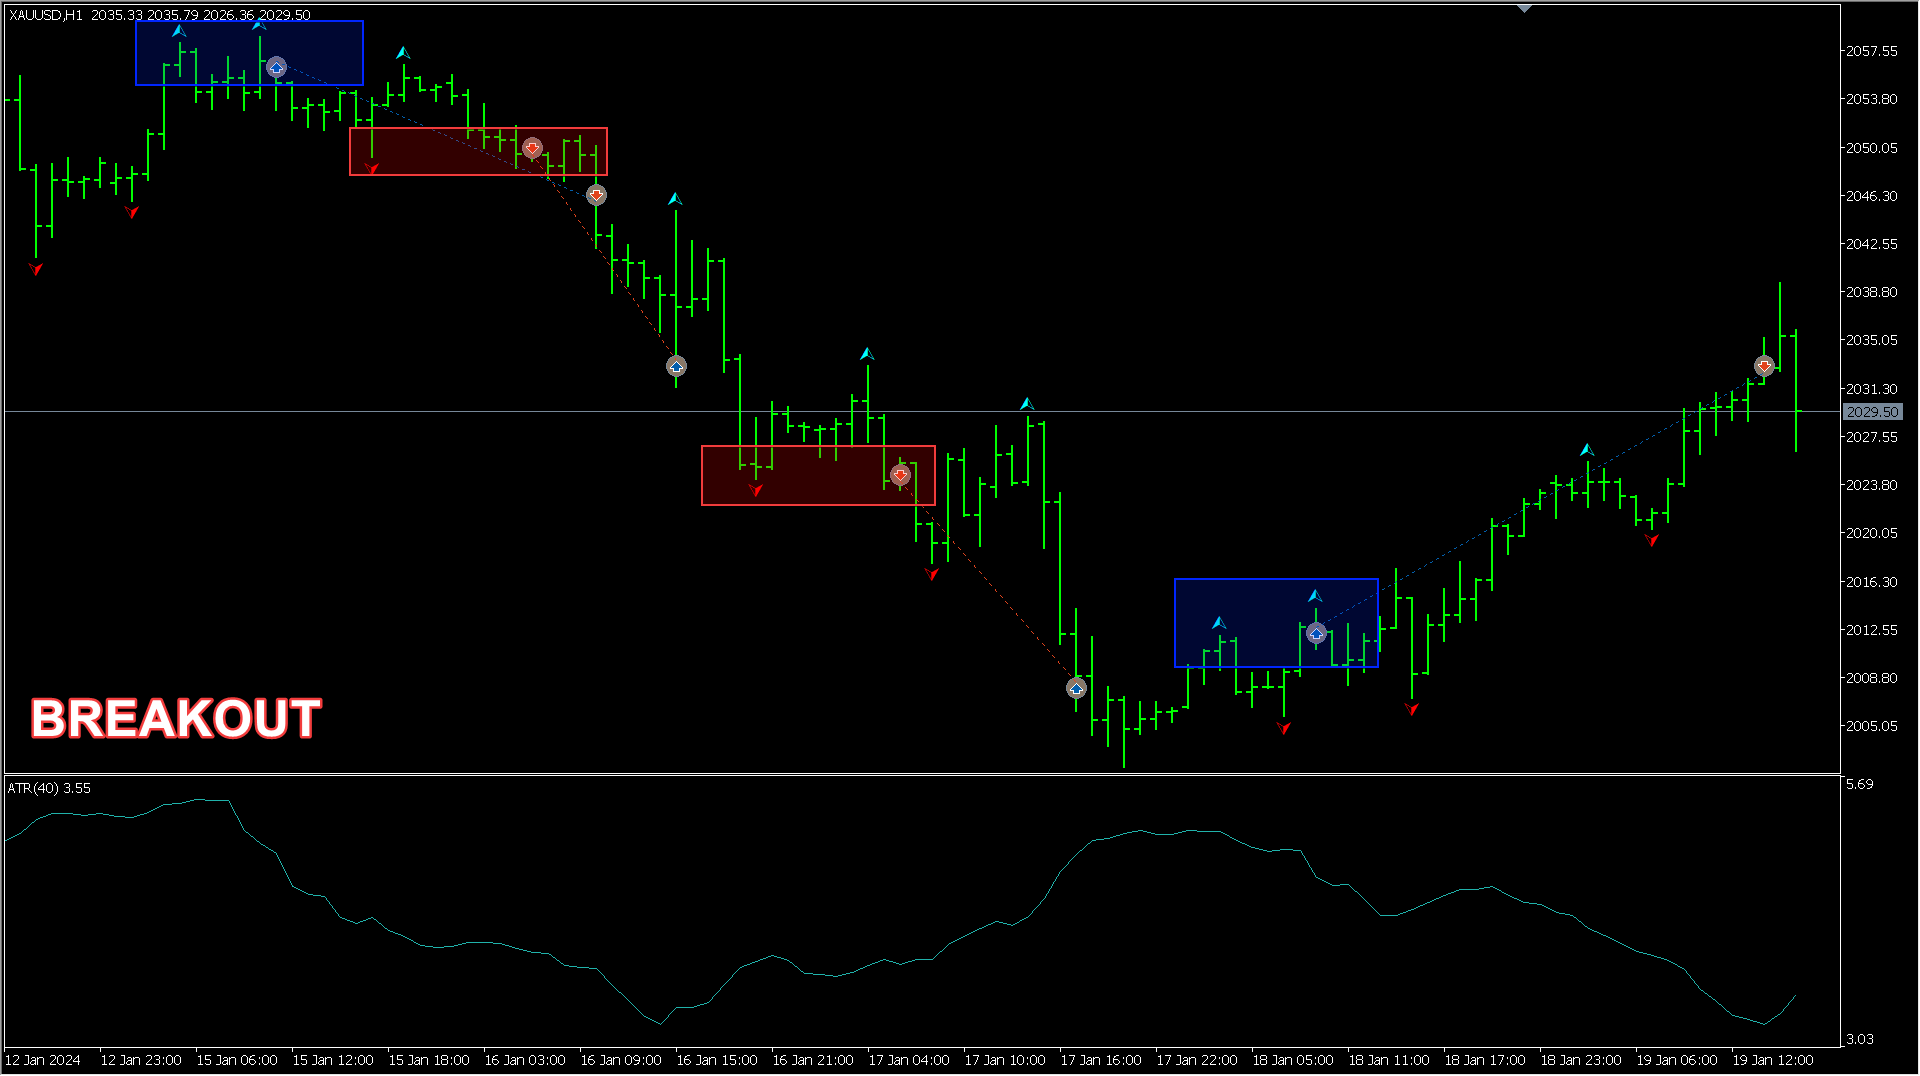
- Fractals for Market Entry: The bot analyzes fractals with a specific period to open positions. Positions can be opened on either a fractal breakout or a rebound.
- Fractal Breakout: A position is opened when the price breaks through the level of the last (unbroken) fractal in the direction of the breakout.
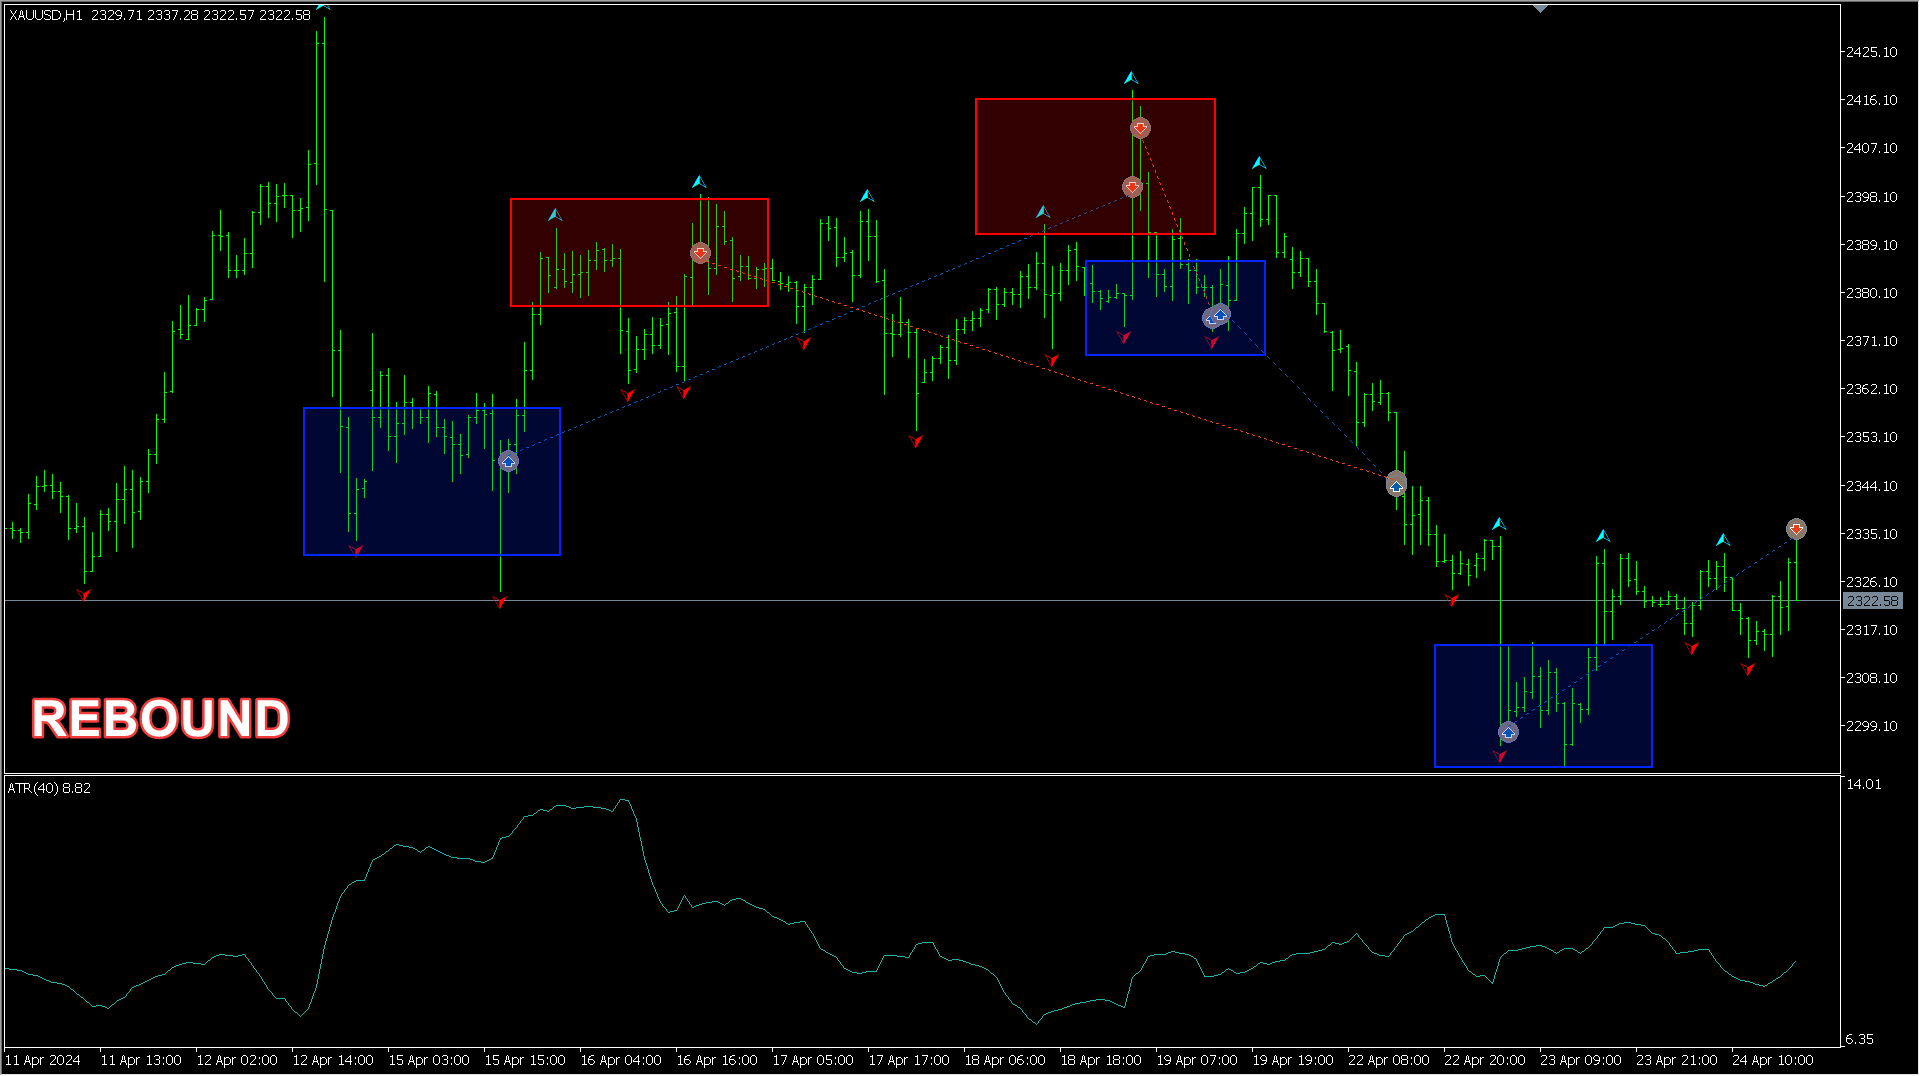
- Fractal Rebound: A position is opened in the direction opposite to the breakout of the last (unbroken) fractal, i.e., on the rebound from the fractal.
- 2. Setting Stop-Loss:
- Fractals for Stop-Loss: Separate fractals with a specific period are used to set stop-loss levels.
- ATR for Stop-Loss: Stop-loss can be set at a certain distance from the current price, determined by the ATR (Average True Range) indicator.
- 3. Setting Take-Profit:
- ATR for Take-Profit: Take-profit can be set based on the values of the ATR indicator.
- Take-Profit Multiplier: Take-profit can also be determined based on a multiplier applied to the stop-loss value.
When to Use Breakout vs. Rebound from Fractals:
- 1. Fractal Breakout:
- Recommended for Trending Markets: Effective when the price shows a consistent movement in one direction. A fractal breakout indicates trend continuation.
- Effective in Strong Momentum Situations: Useful when there is a strong momentum and a high probability of the price continuing in the direction of the breakout.
- 2. Fractal Rebound:
- Ideal for Ranging Markets: Perfect for markets that are moving sideways or in a range. A fractal rebound indicates a price reversal within the range.
- Useful at Key Support or Resistance Levels: Helpful when the price reaches significant support or resistance levels, where the likelihood of a reversal is high.
Input Parameters:
| === ATR INDICATOR === | ATR indicator settings. |
|---|---|
| ATR Period | ATR indicator period. |
| === FRACTAL INDICATOR === | Fractal settings. |
|---|---|
| Fractal Entry Period | Fractal period for entering a position. |
| Fractal Up Color | Color of the top fractal. |
| Fractal Down Color | Color of the lower fractal. |
| Fractal Width | Width of fractal. |
| Fractal Stop-Loss Period | Fractal period for Stop-Loss of a position. |
| === POSITIONS === | Positions settings. |
|---|---|
| Positions Open Type | Type of opening trading positions: By Fractal Breakout - price breakthrough of the fractal level; By Fractal Rebound - price rebound from the fractal level. |
| Positions Open In One Side Max Count | Maximum allowed number of trading positions opened in one side. |
| Positions Open Min Intervals ATRs | Minimum interval (in ATR values) between opening of trading positions. |
| Positions Close Current By Contra | Close the current open trading position when a signal appears in the opposite direction: No Close - do not close, Close Only In Plus - close only if the current position is in plus, Close Always - close always. |
| Positions Volume | Volume of trading positions. |
| Positions Stop-Loss Type | Stop-Loss type of trading positions: Stop-Loss By ATR - Stop-Loss is calculated by ATR indicator; Stop-Loss By Fractal - Stop-Loss is calculated by fractal level. |
| Positions Stop-Loss ATRs | Stop-Loss of trading positions (in ATR values). |
| Positions Take-Profit Type | Take-Profit type of trading positions: Take-Profit By ATR - Take-Profit is calculated by ATR indicator; Take-Profit By Stop-Loss - Take-Profit is calculated by Stop-Loss value. |
| Positions Take-Profit ATRs | Take-Profit of trading positions (in ATR values). |
| Positions Take-Profit By Stop-Loss Multiplier | Multiplier of Stop-Loss value for Take-Profit calculation. |
| Positions Magic Number | Magic number of trading positions. |
| Positions Comment | Comment of trading positions. |
| === STOP-KRAN === | Stop-Kran settings. |
|---|---|
| Stop-Kran Max Drawdown -$ | Maximum drawdown (the sum of profit of all open and closed trading positions) for Stop-Kran (emergency closing of all open positions). |
| Stop-Kran Start Date | Date from which the sum of profit of closed trading positions for Stop-Kran starts counting. |