Vega indicator
- 지표
- Teofil Creanga
- 버전: 1.0
- 활성화: 5
Vega indicator
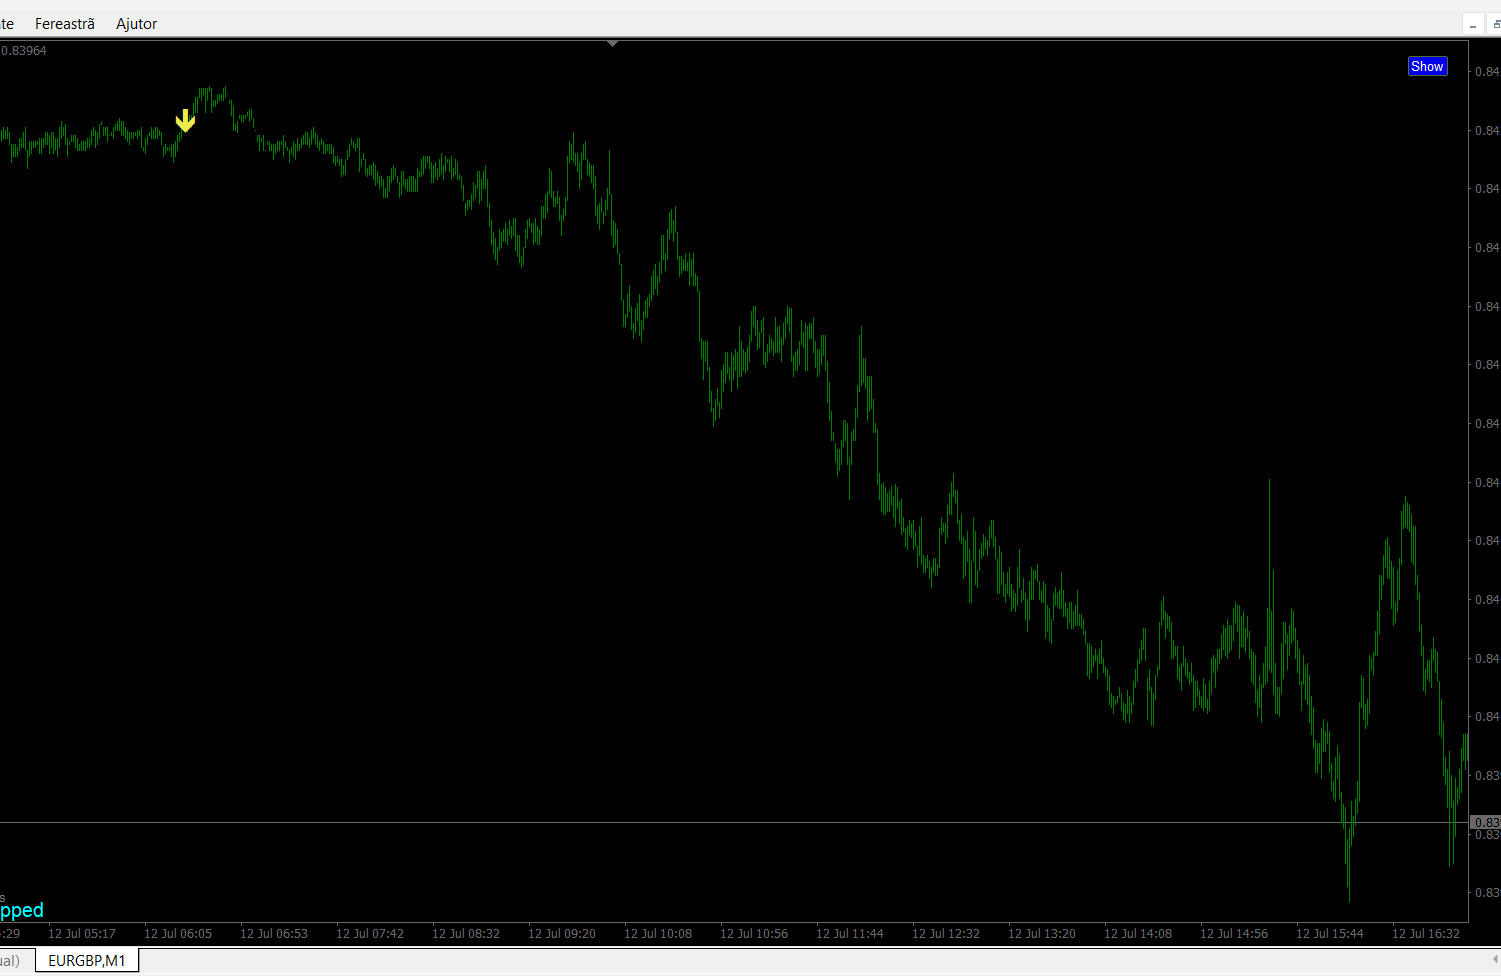
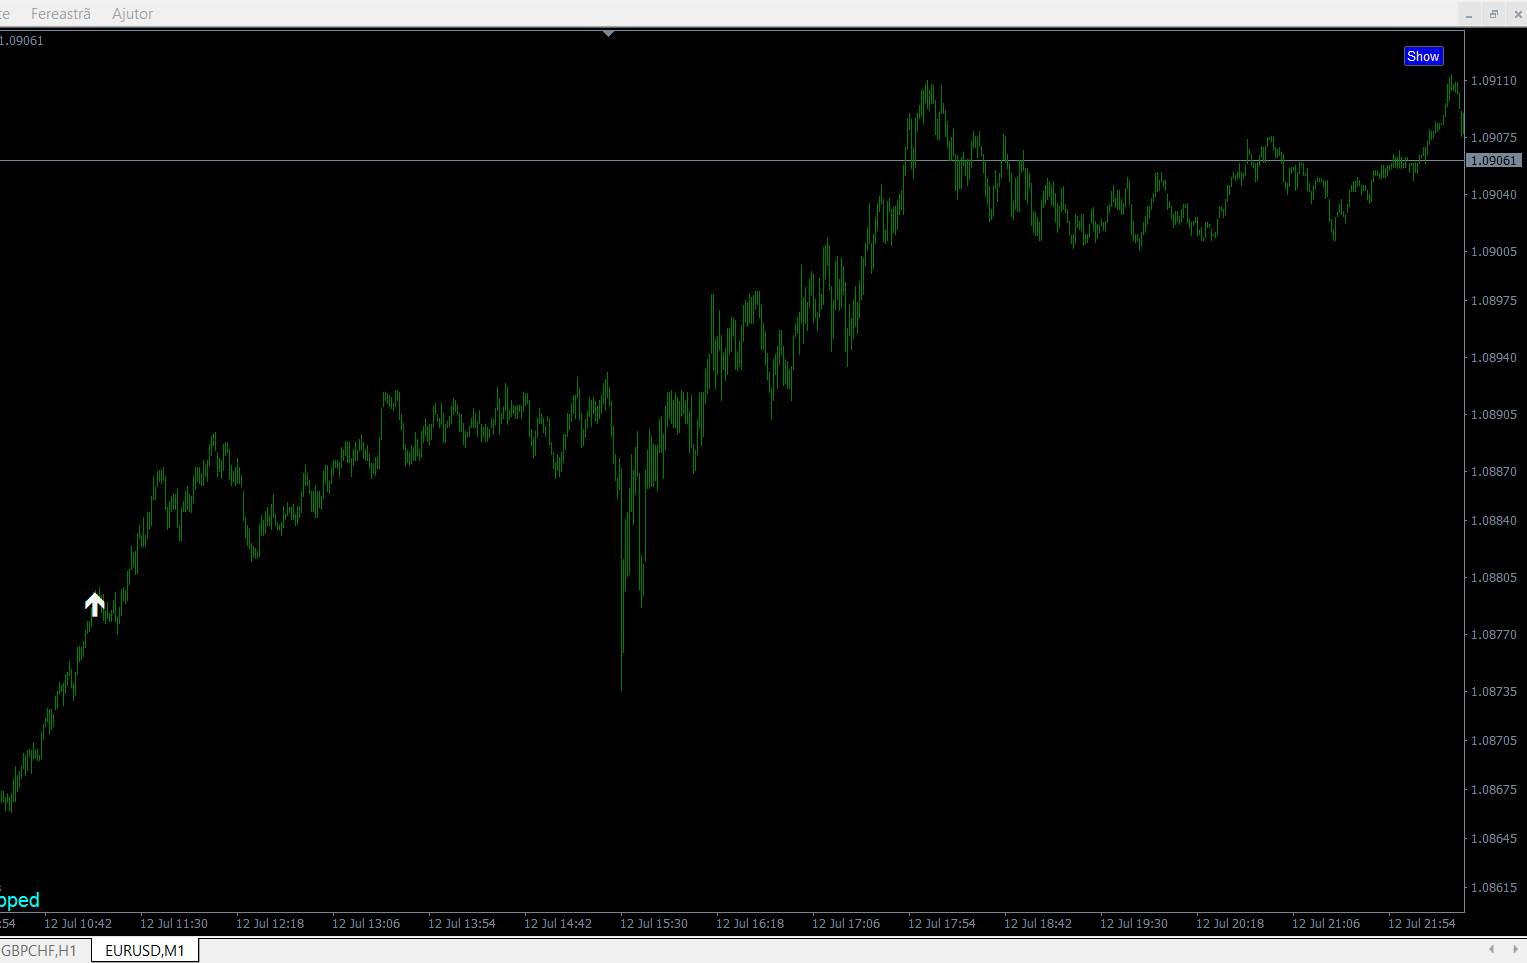
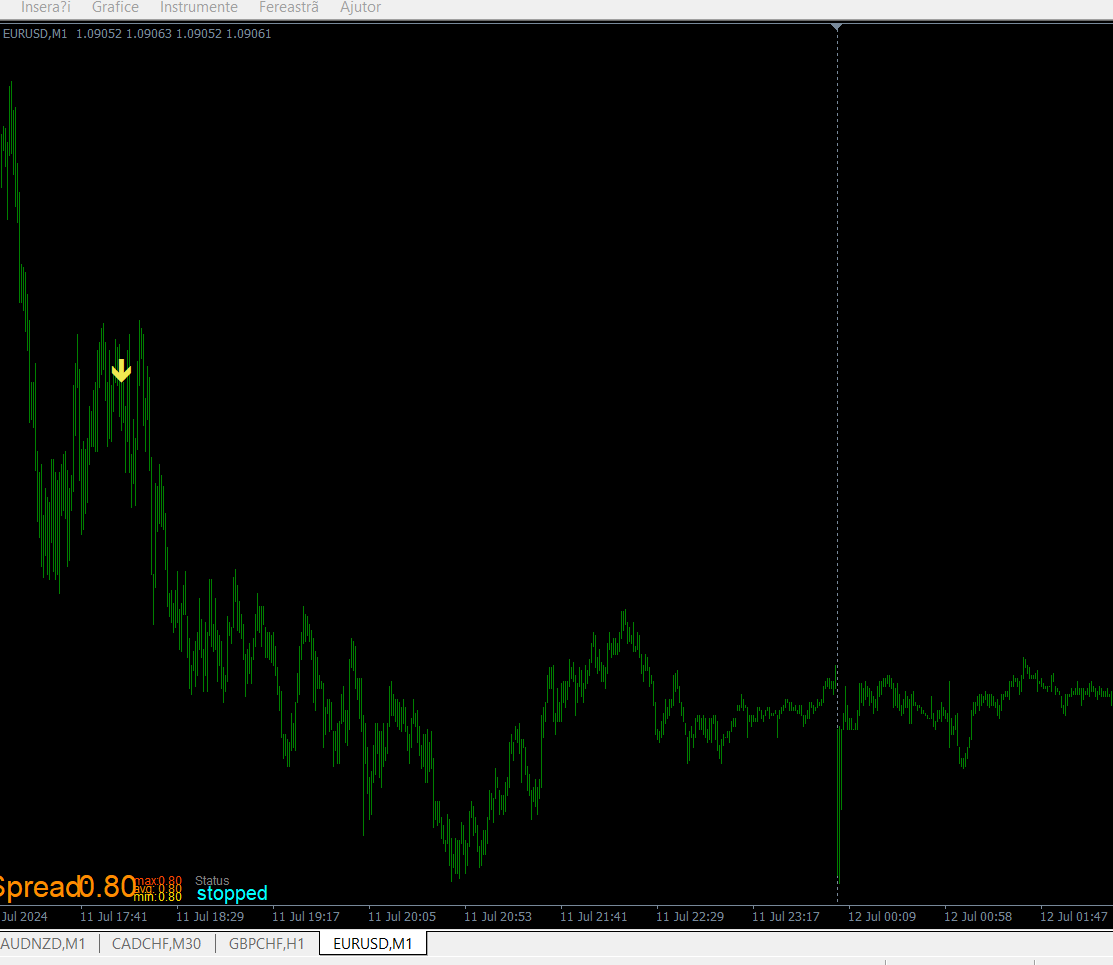
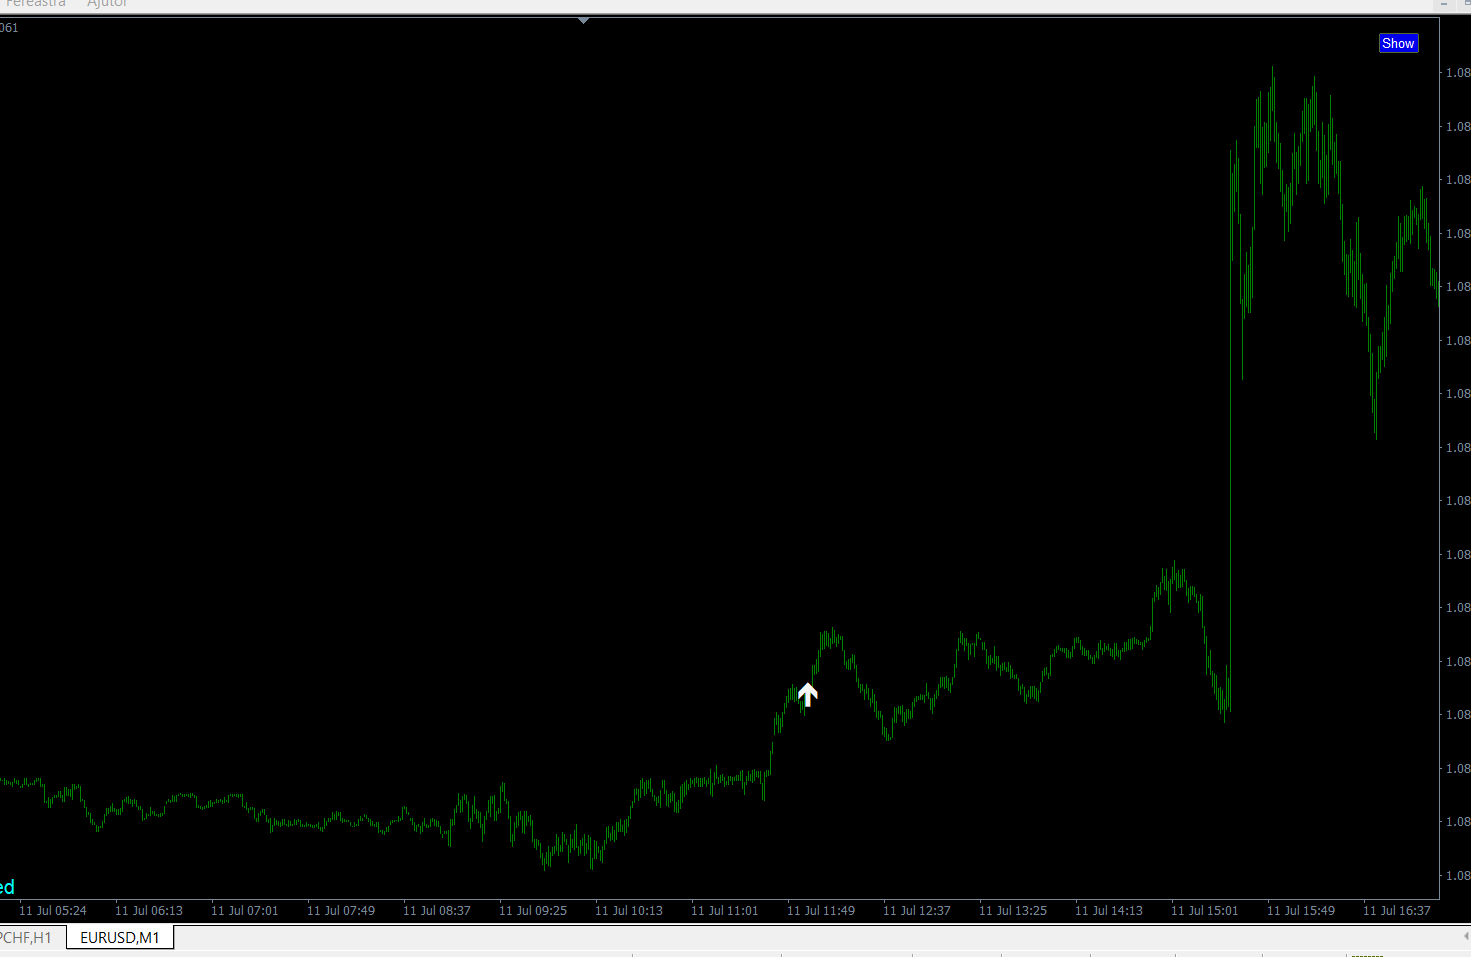
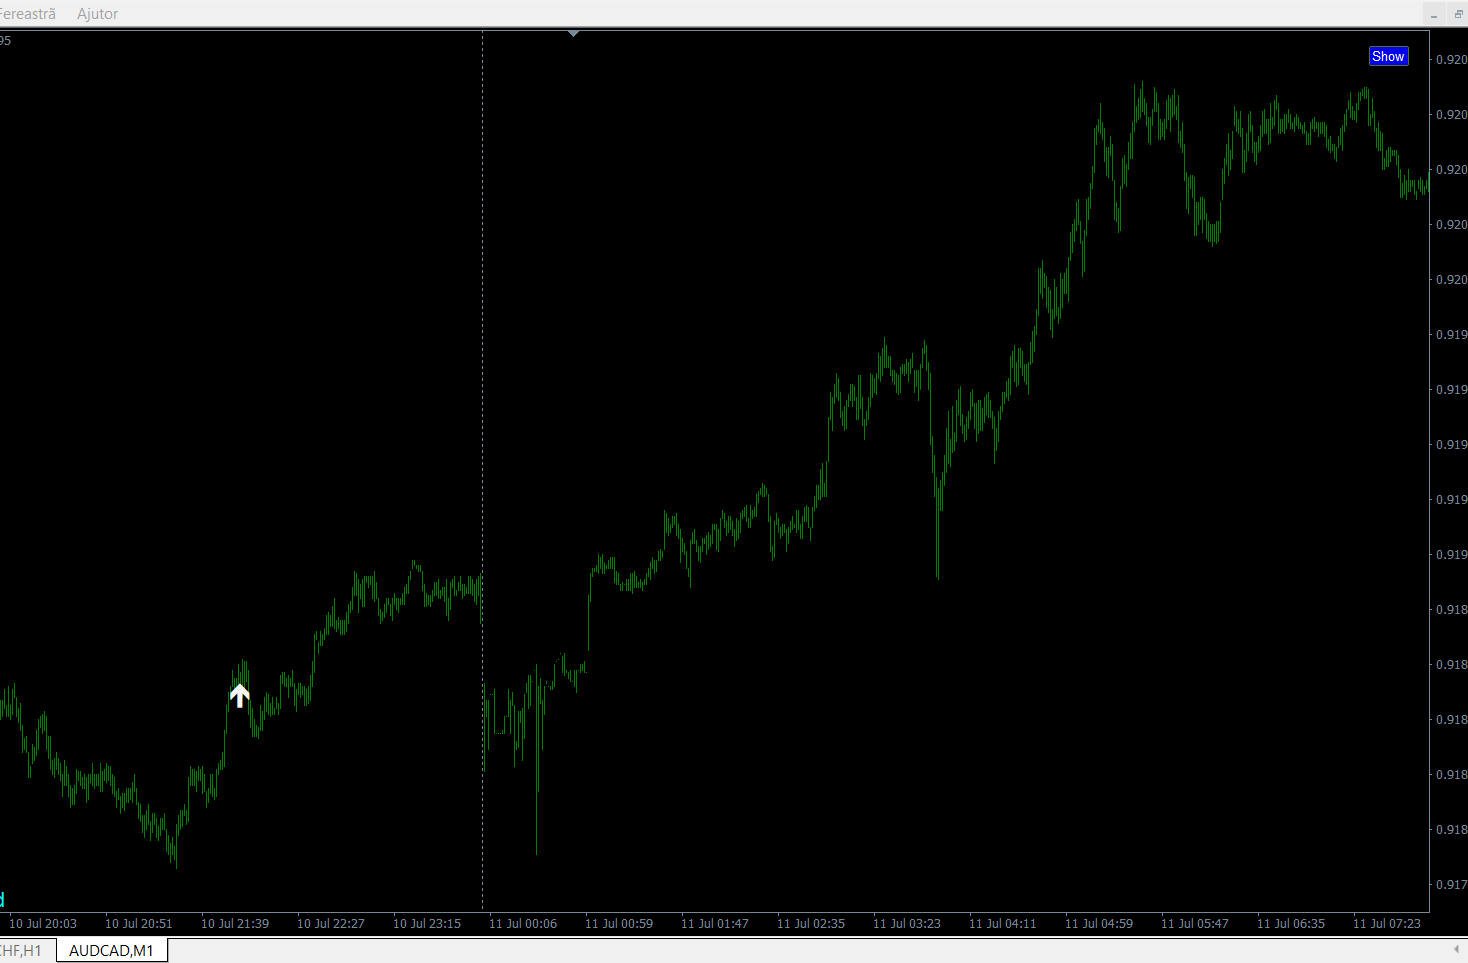
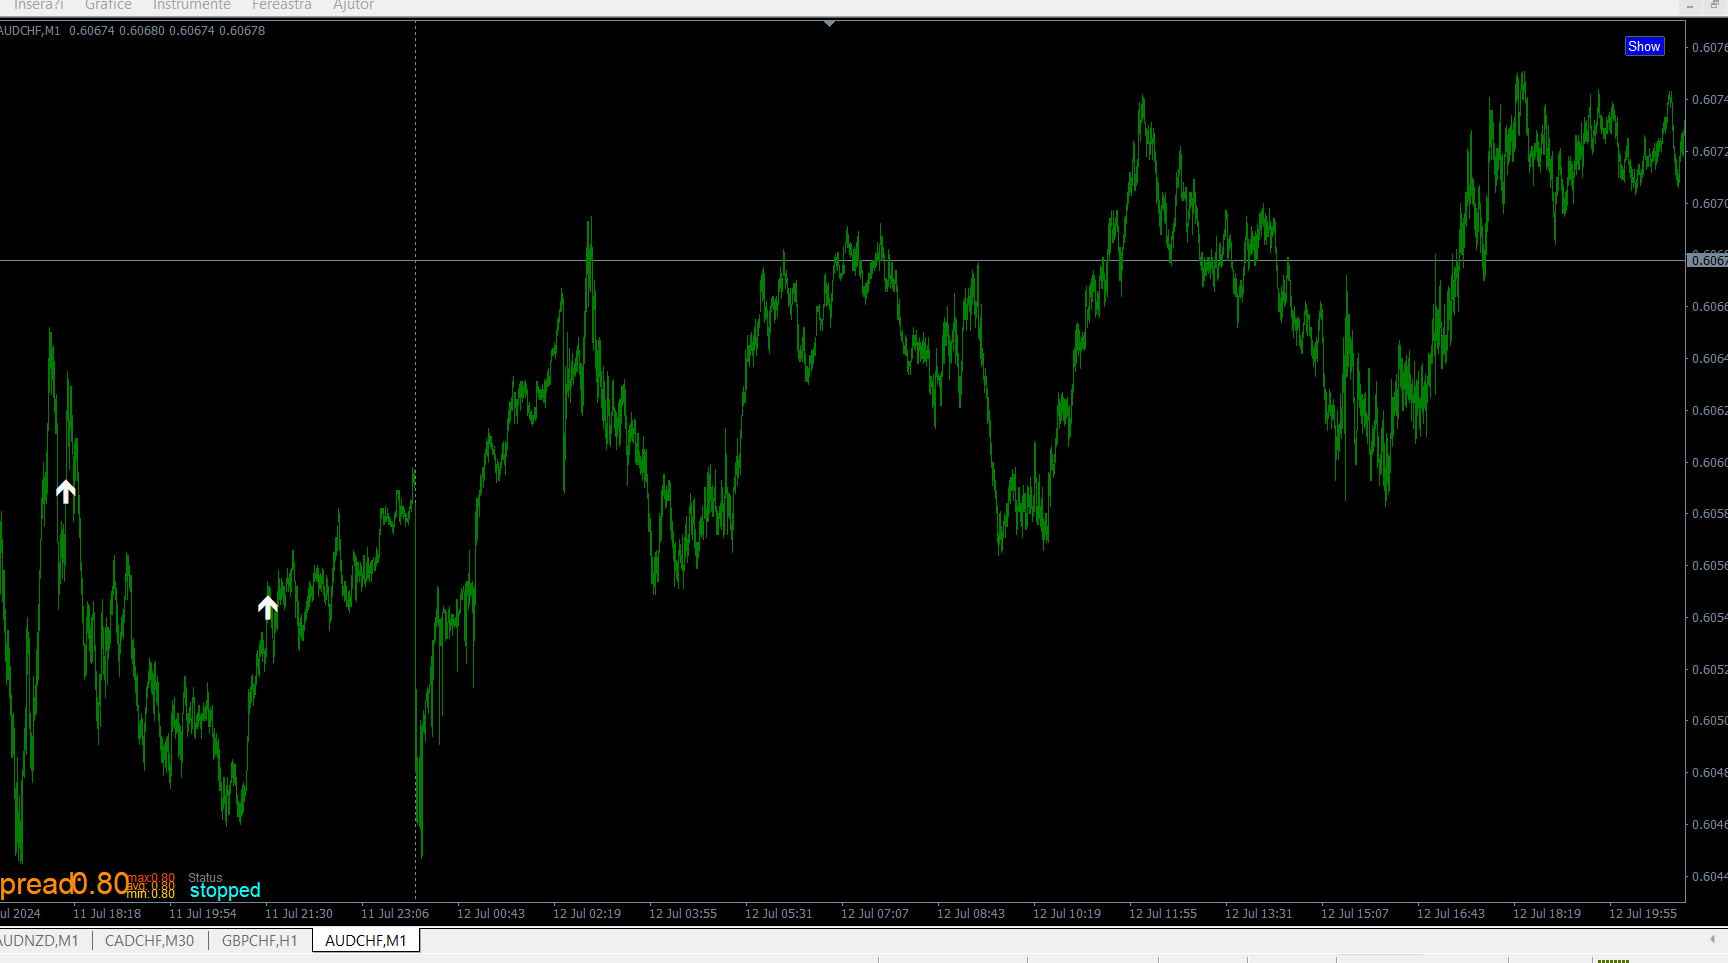
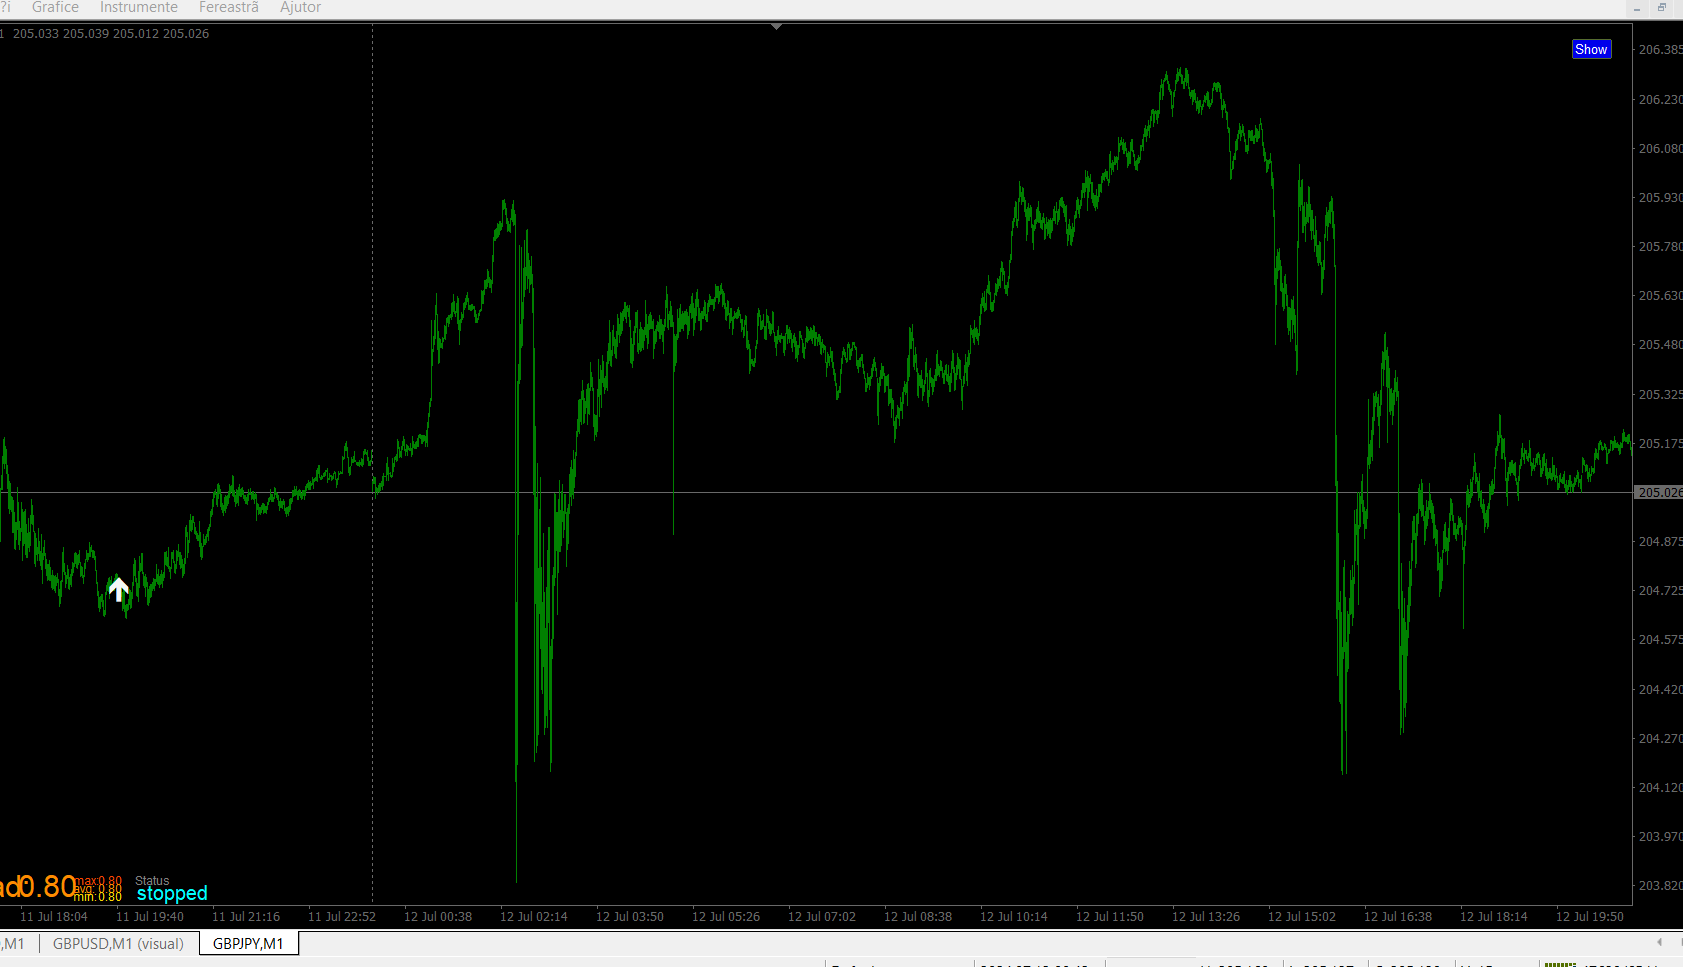
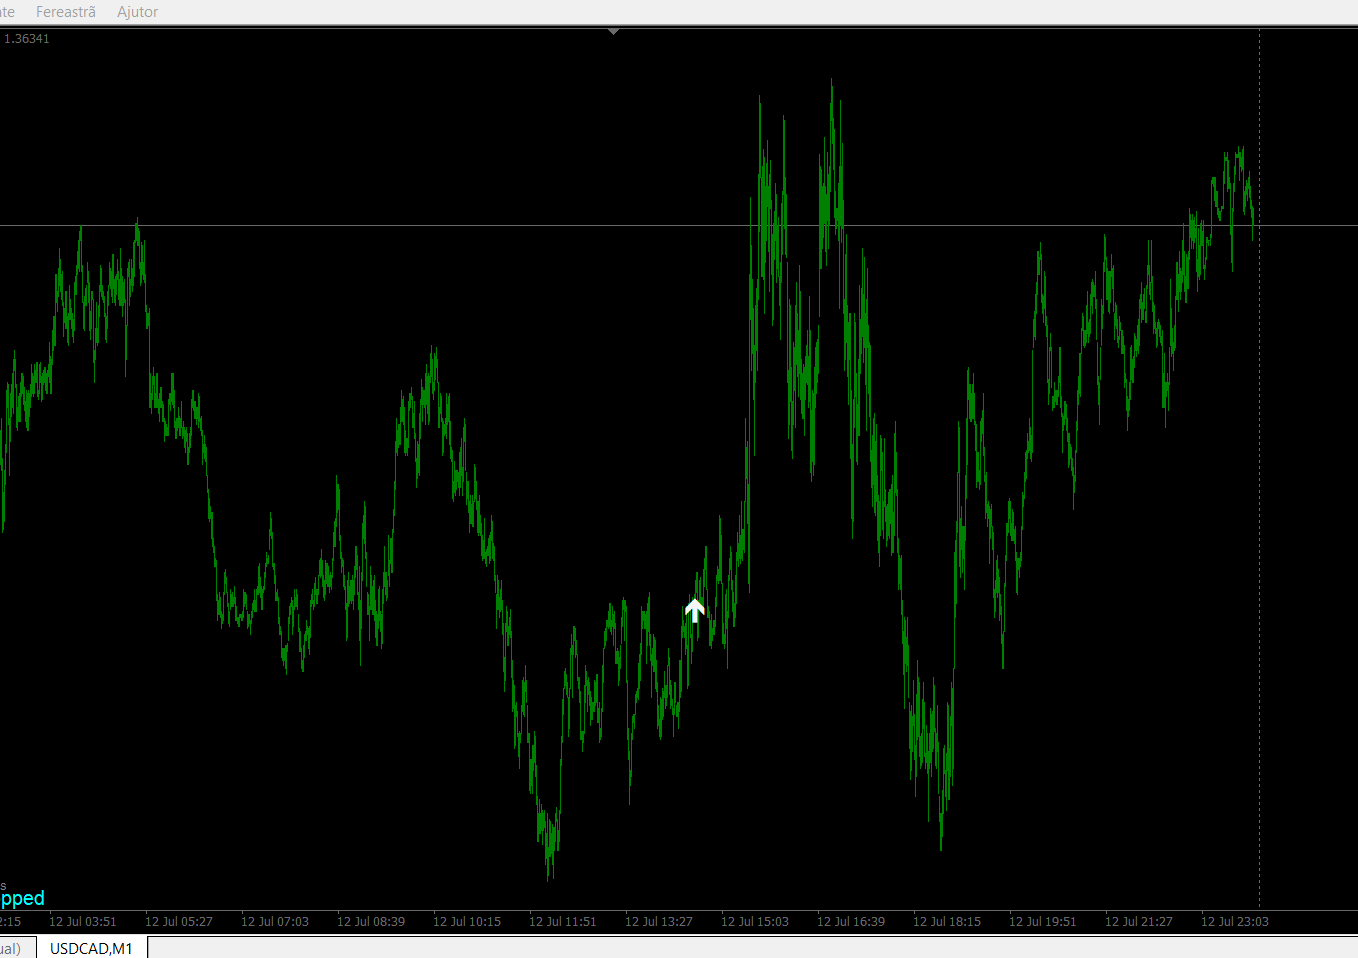
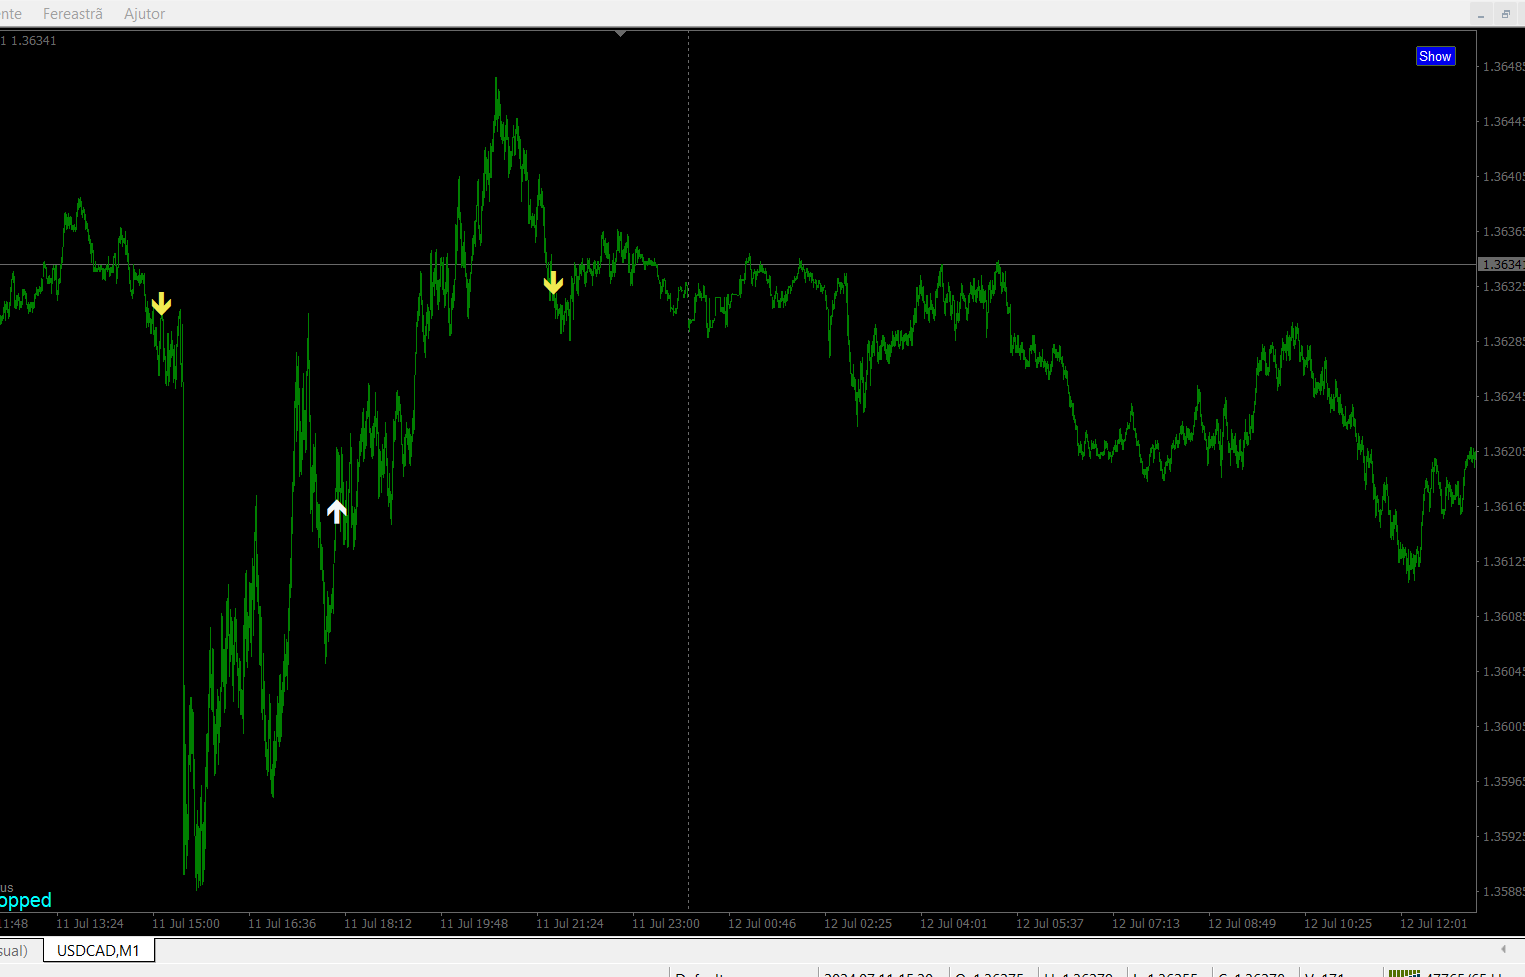
The indicator is created for M1.
Signals are rare, but with a higher chance of success.
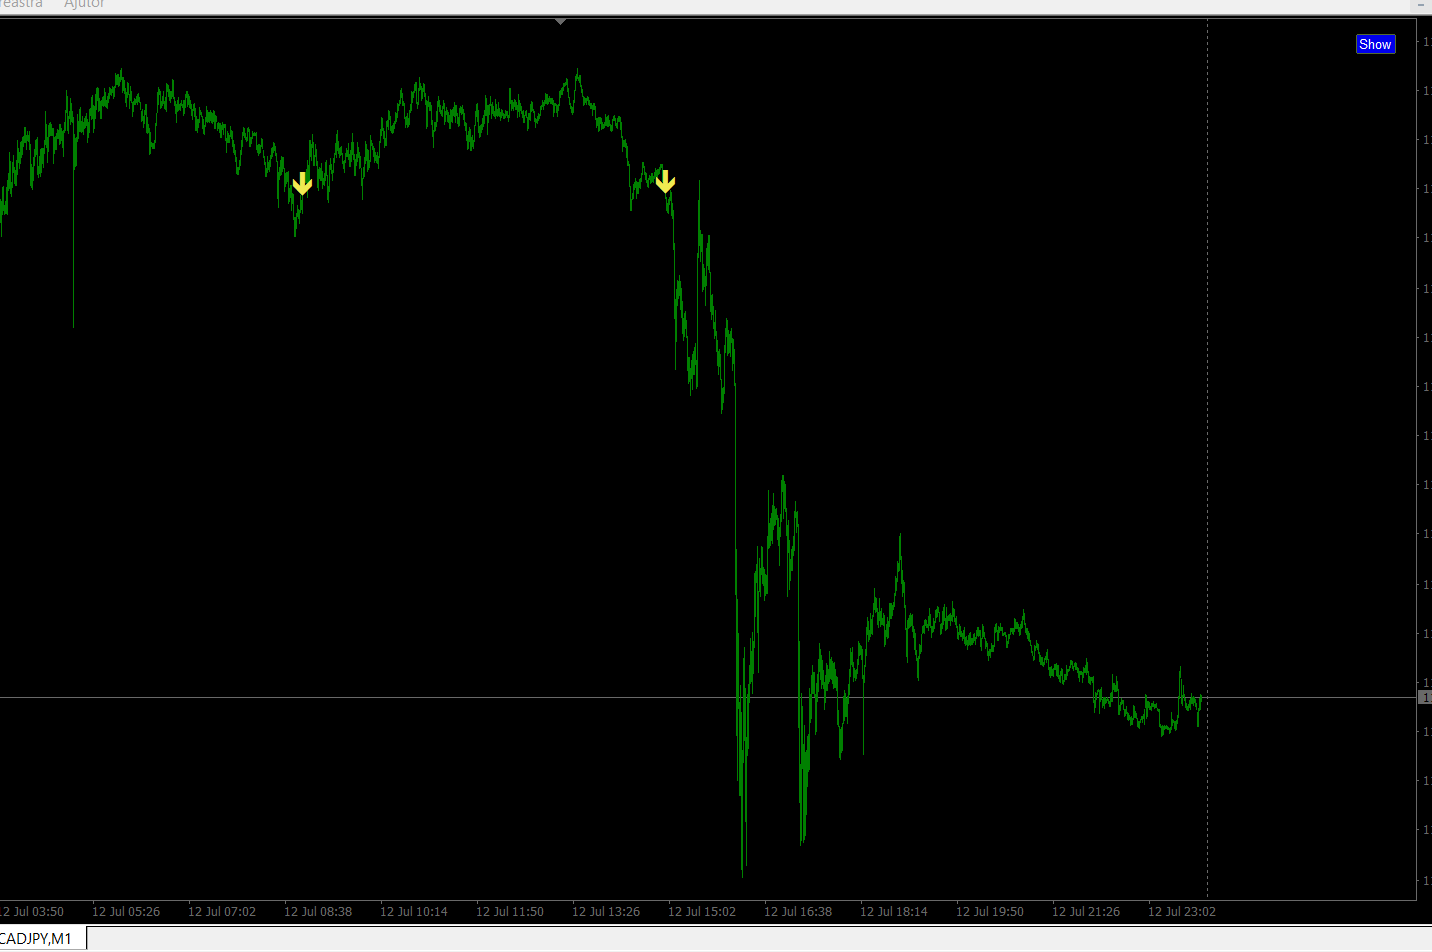
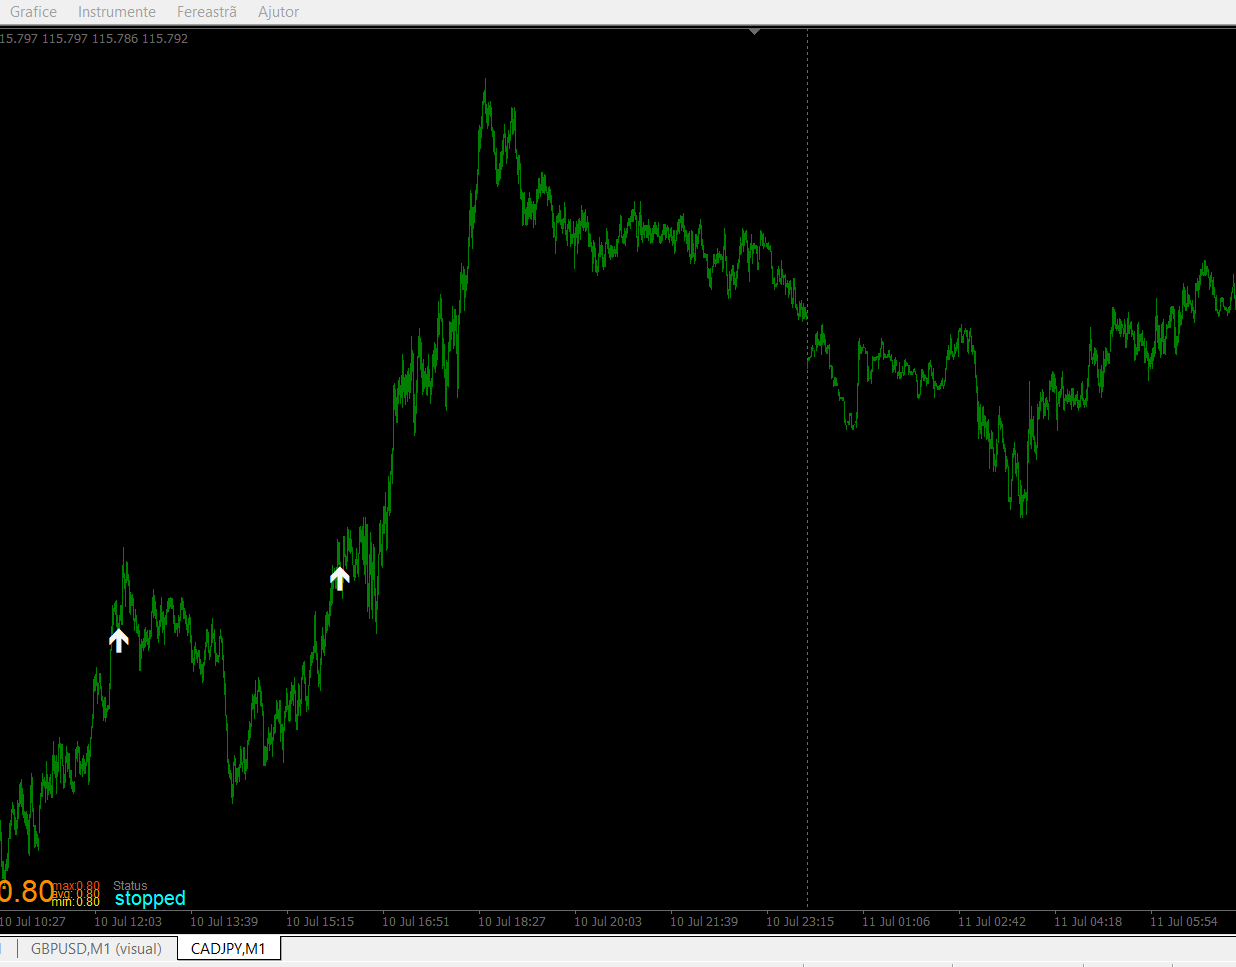
Follow the pictures.
Signals come at a rate of one per day.
The white arrow indicates the trigger of the operation to buy.
And the yellow arrow indicates the trigger of the operation to sell.
Of course a demo download is indicated beforehand.
If the indicator doesn't show, read my comment in the comments section.
Goodbye!