Lossless M1 signal A
- 지표
- Teofil Creanga
- 버전: 1.0
- 활성화: 5
Lossless M1 signal A
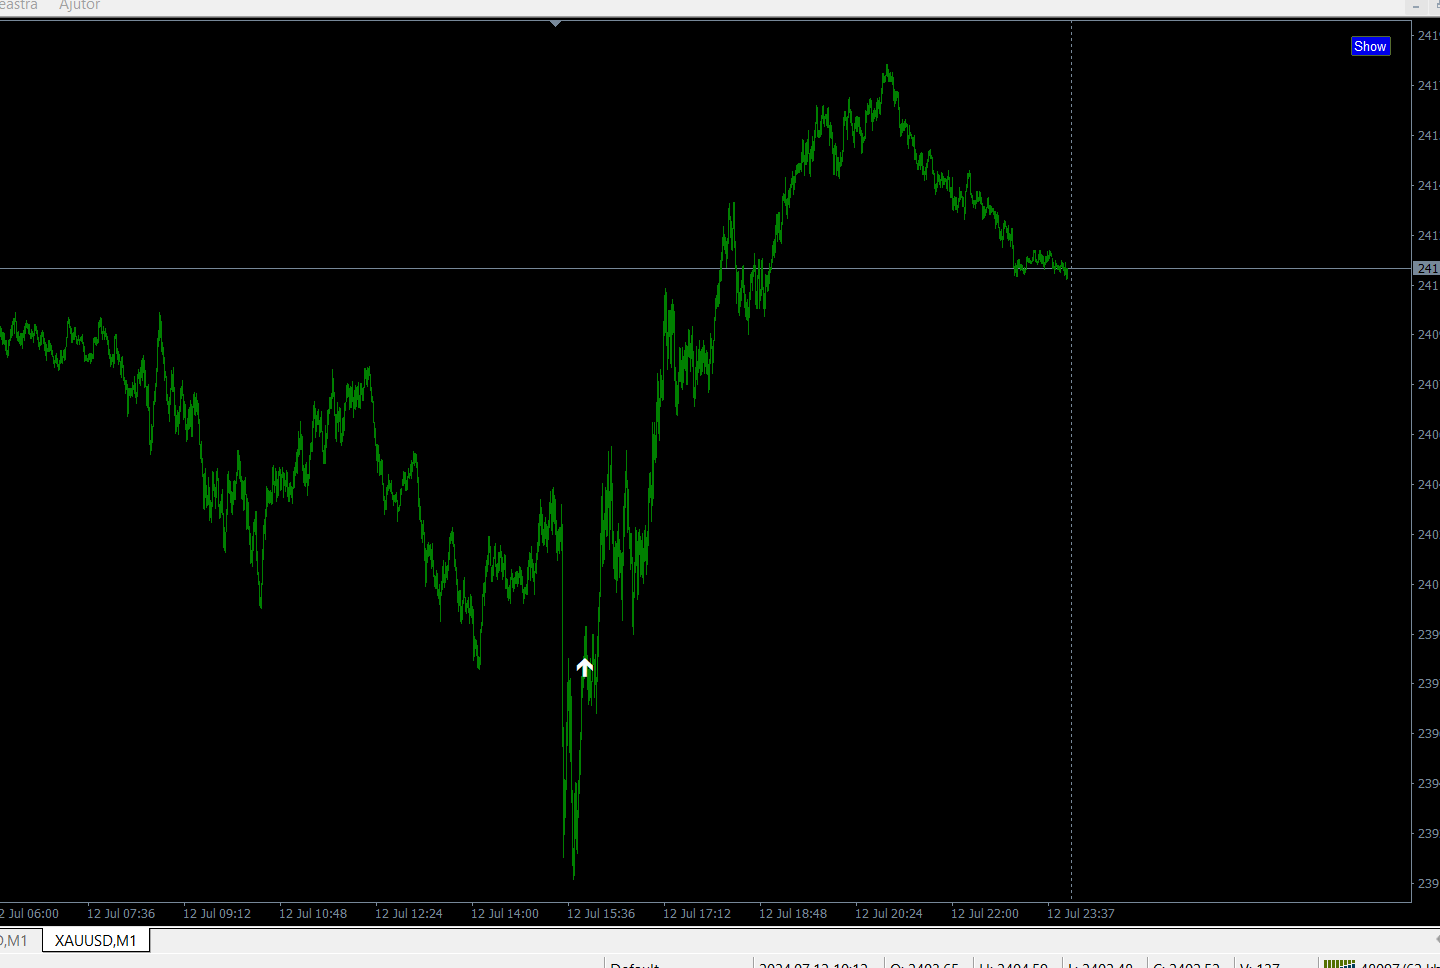
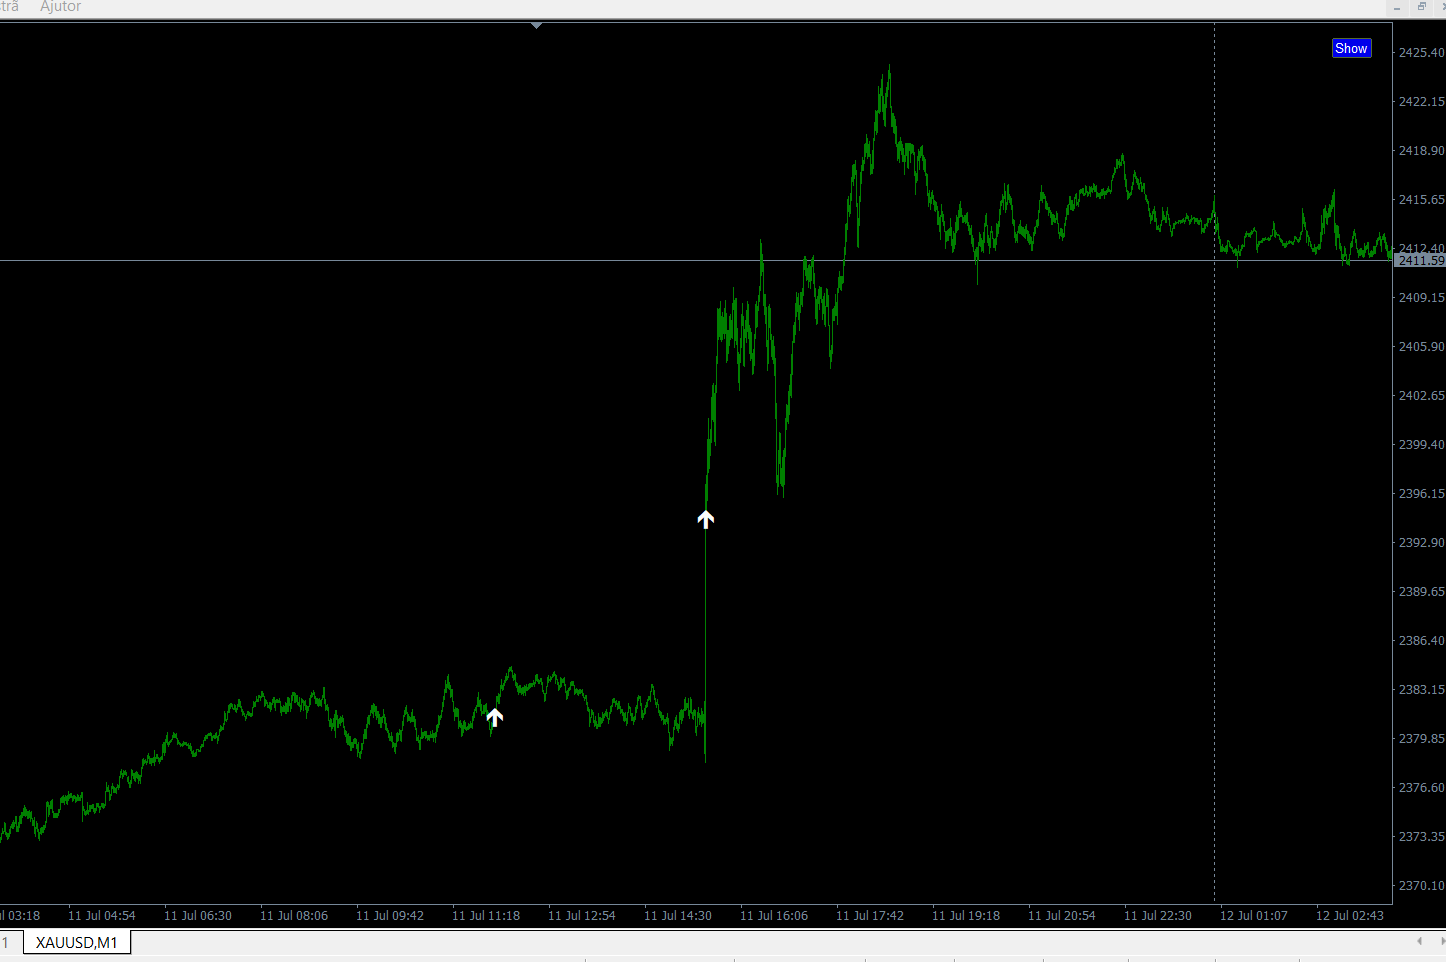
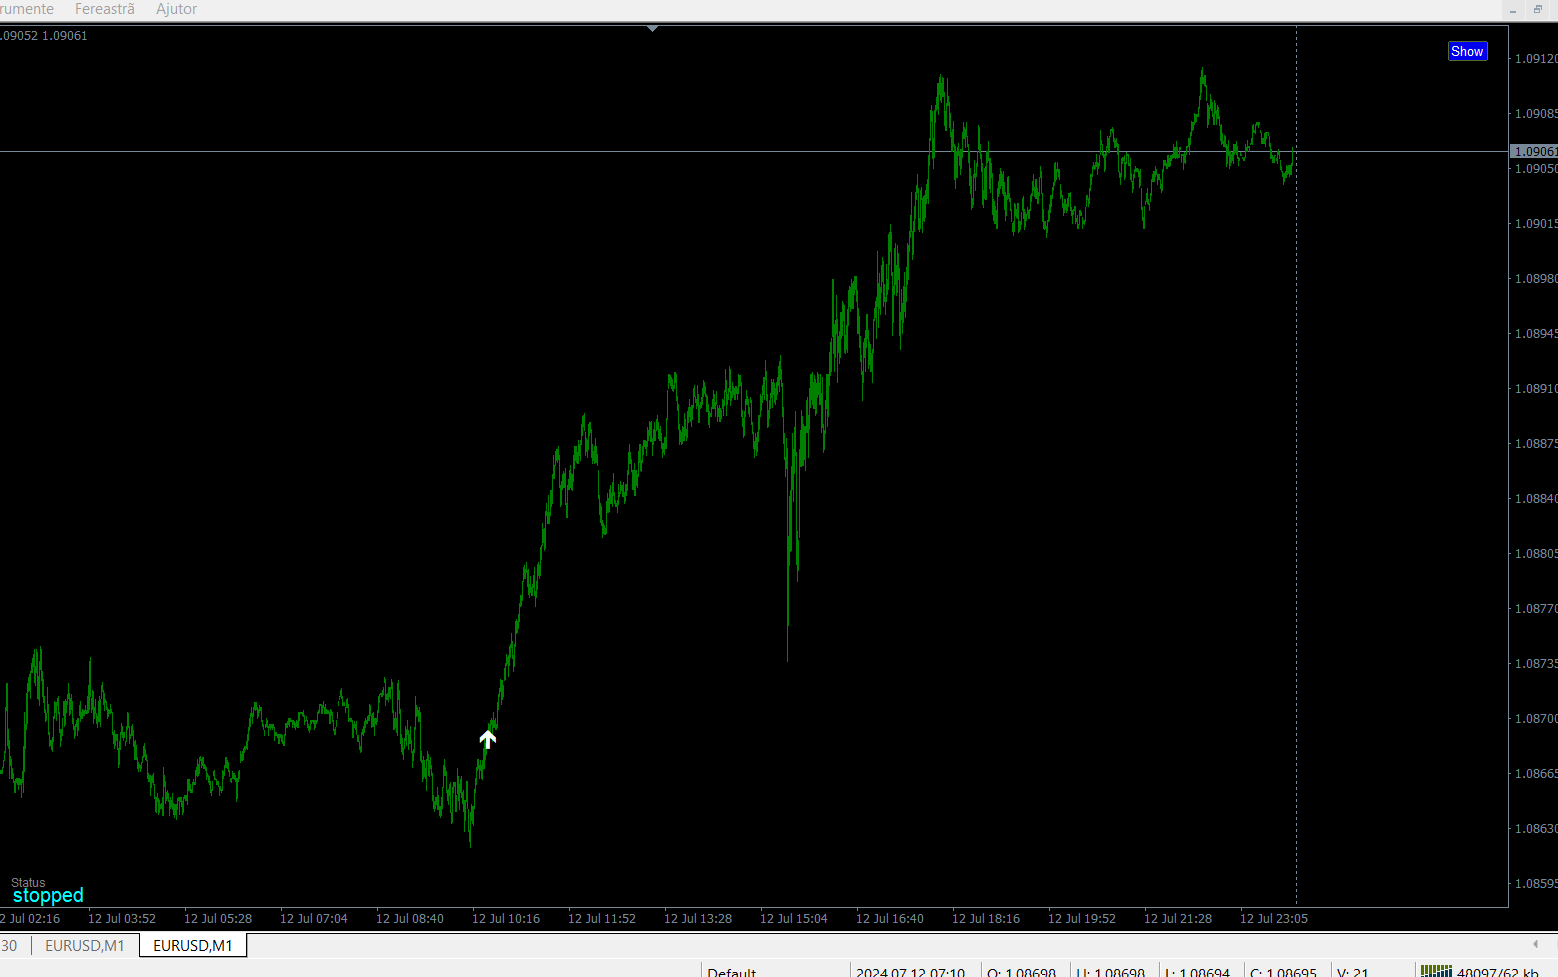
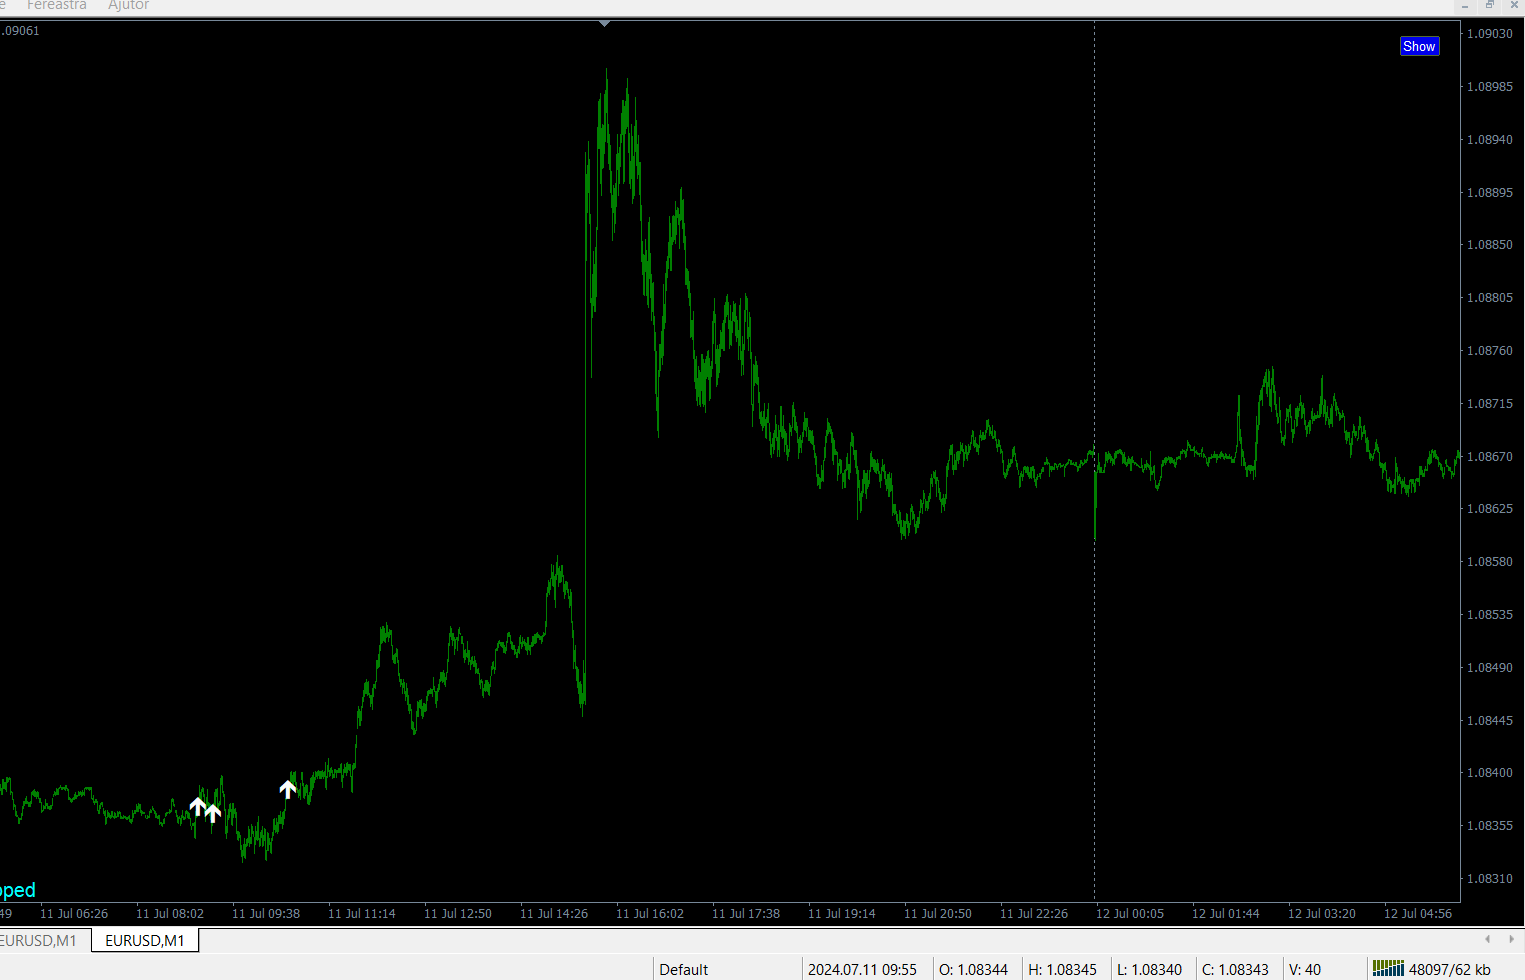
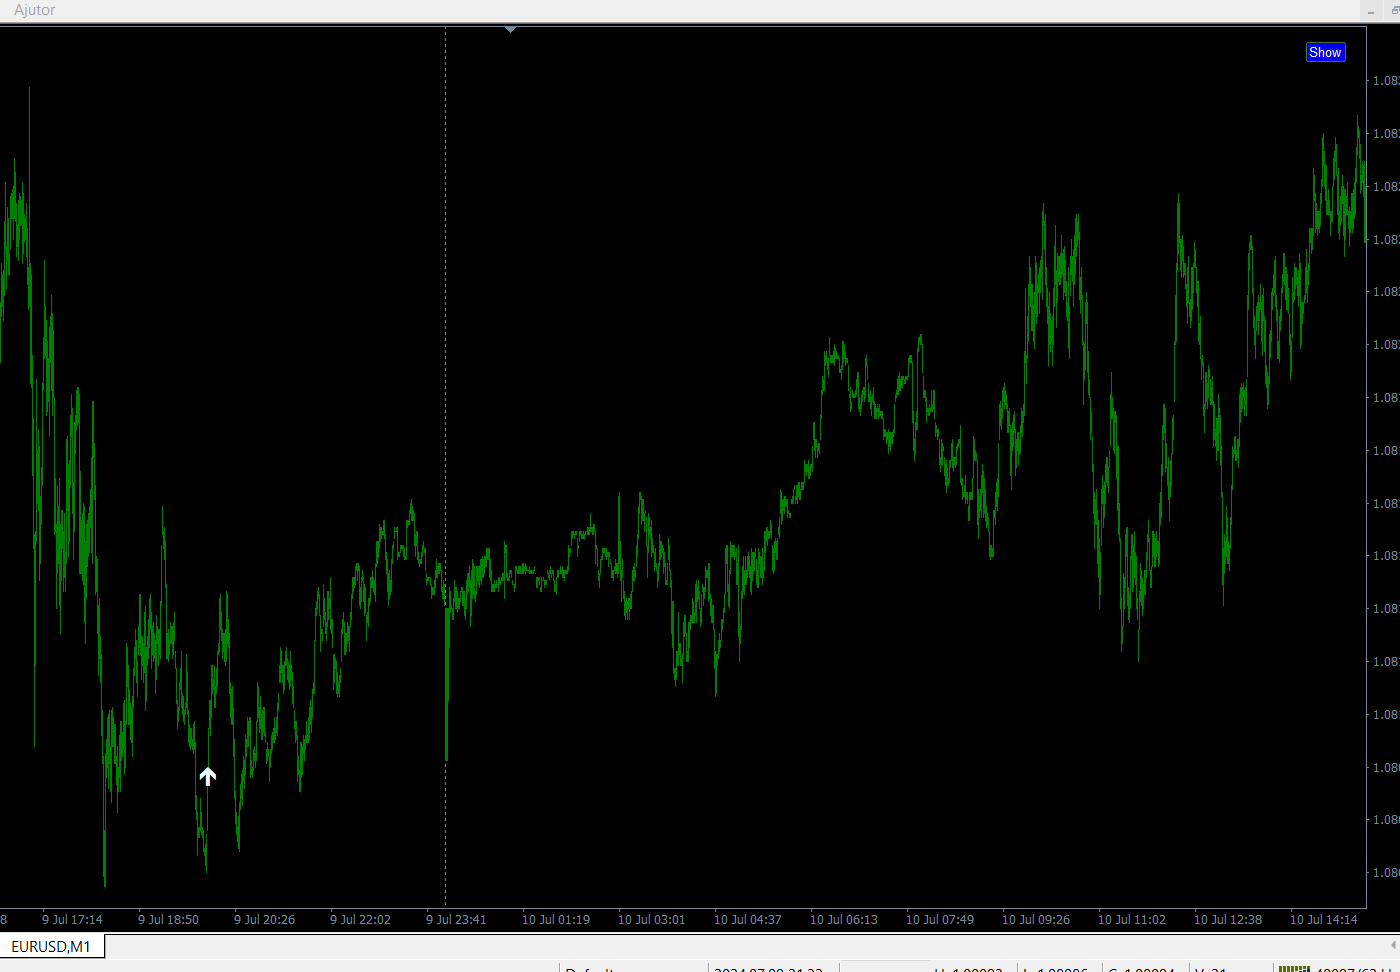
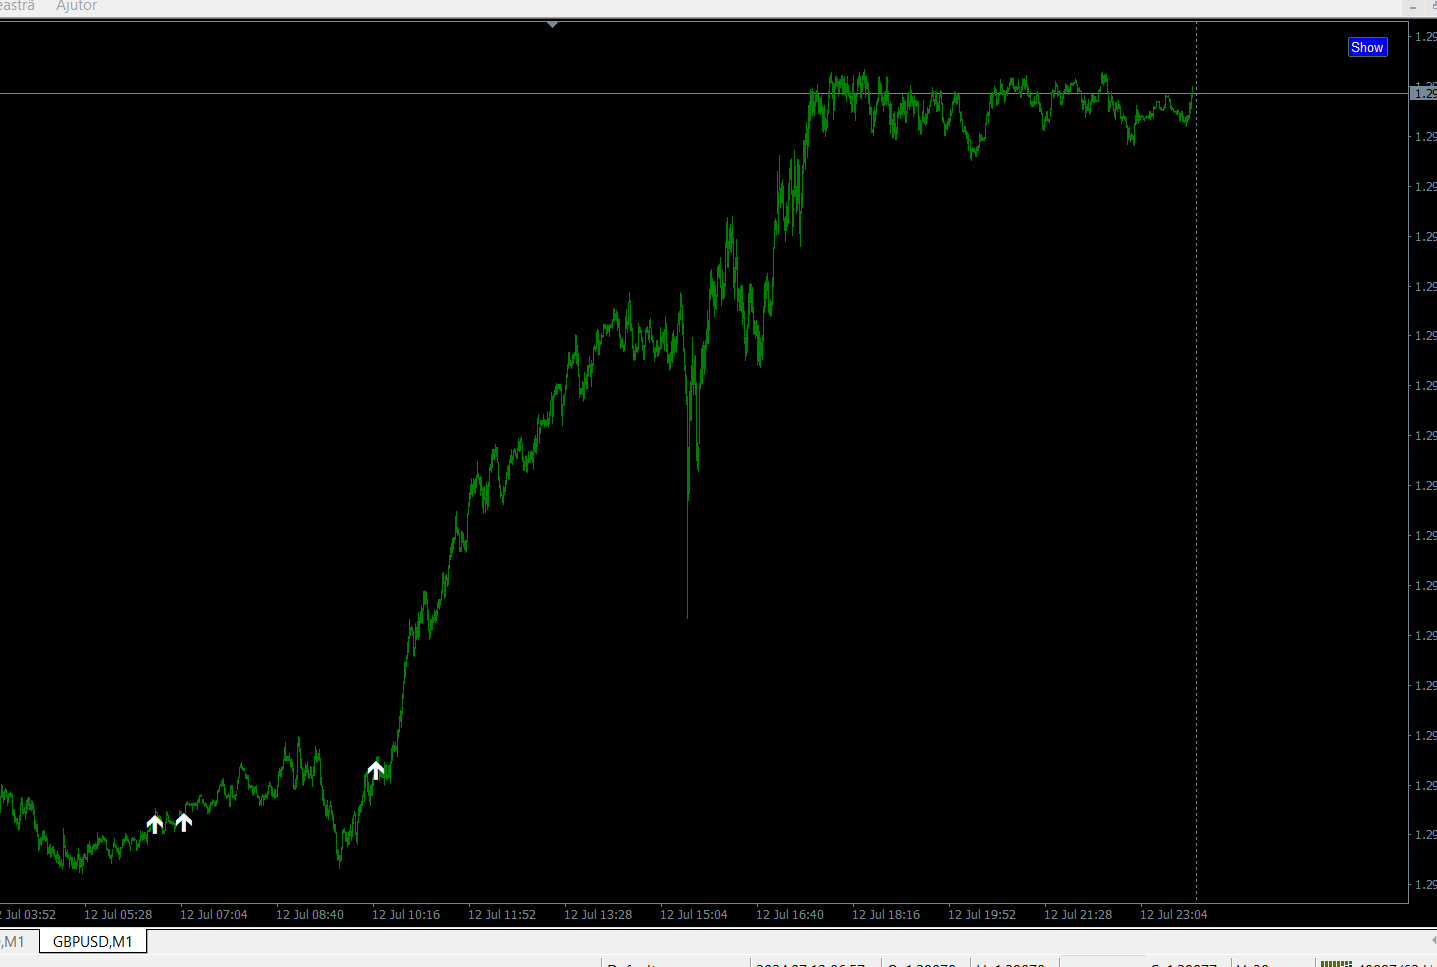
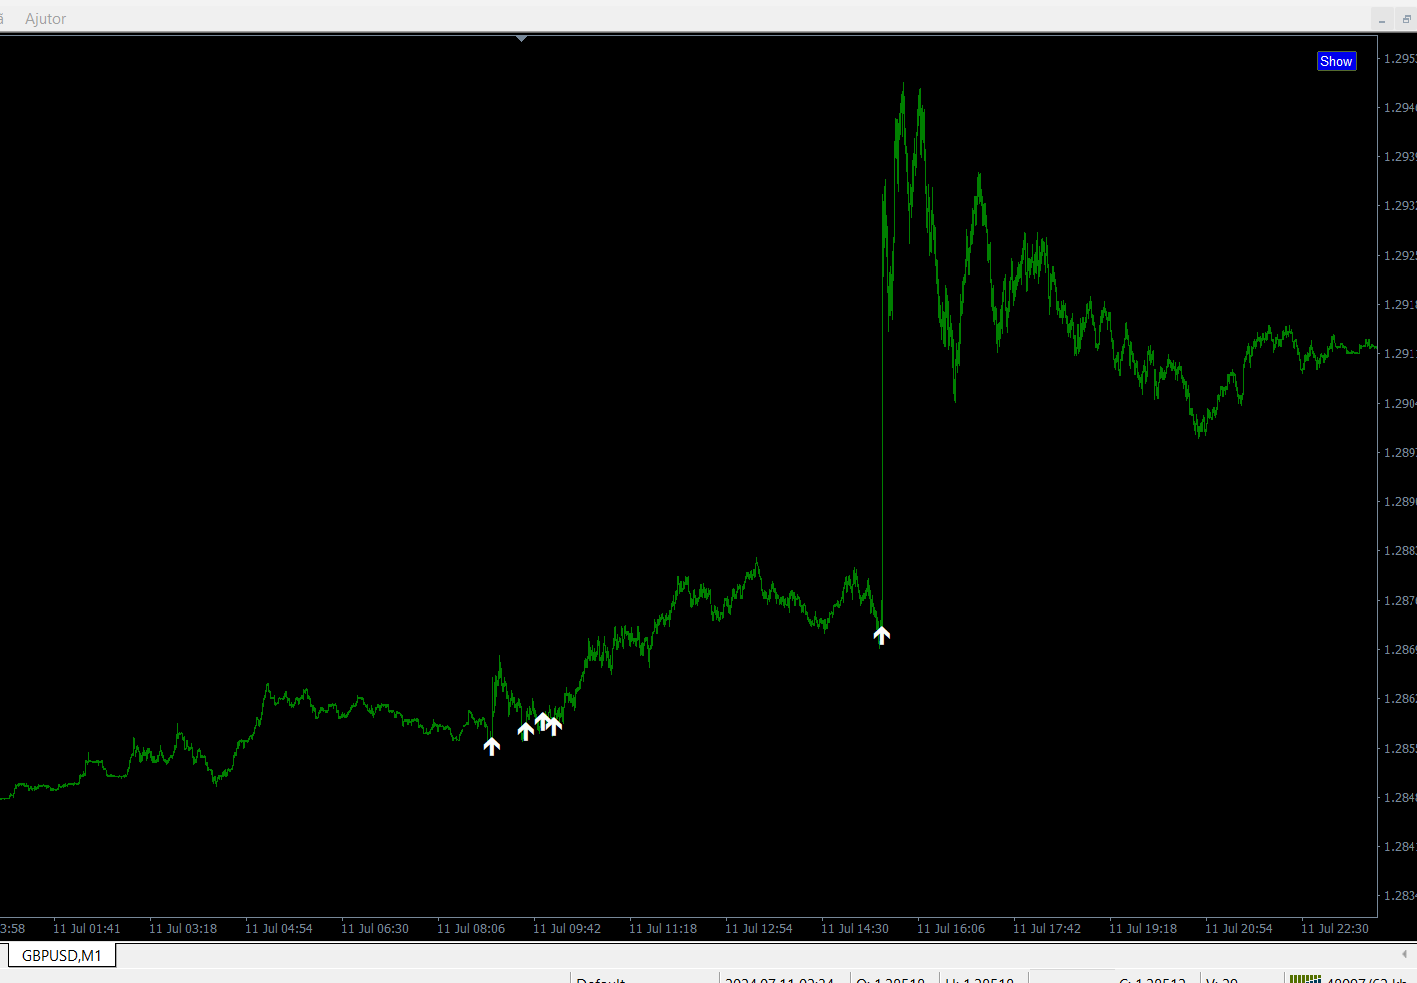
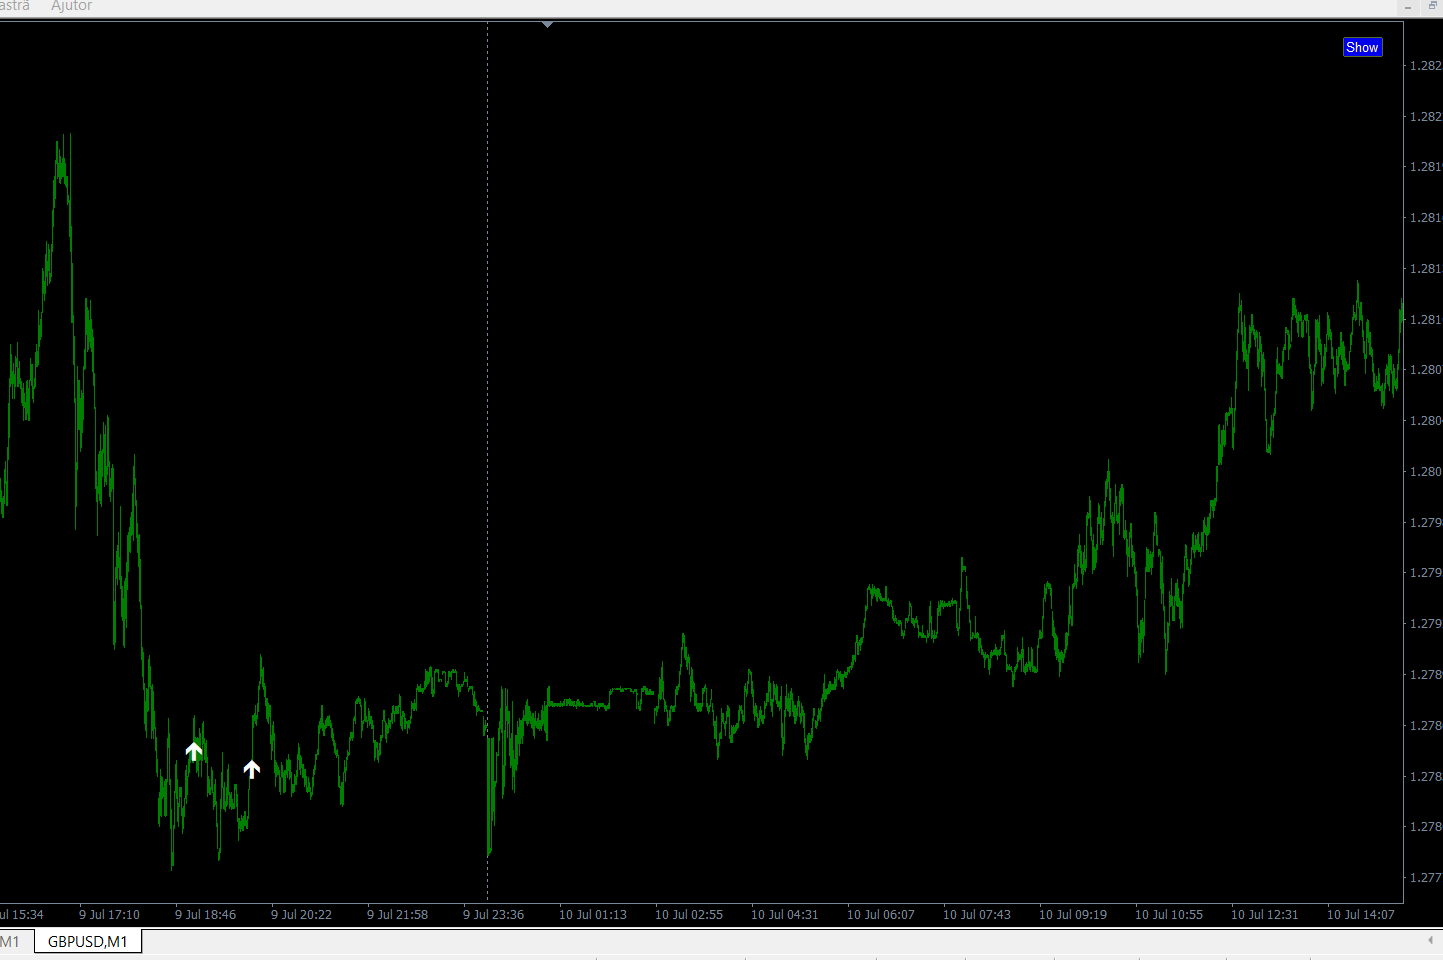
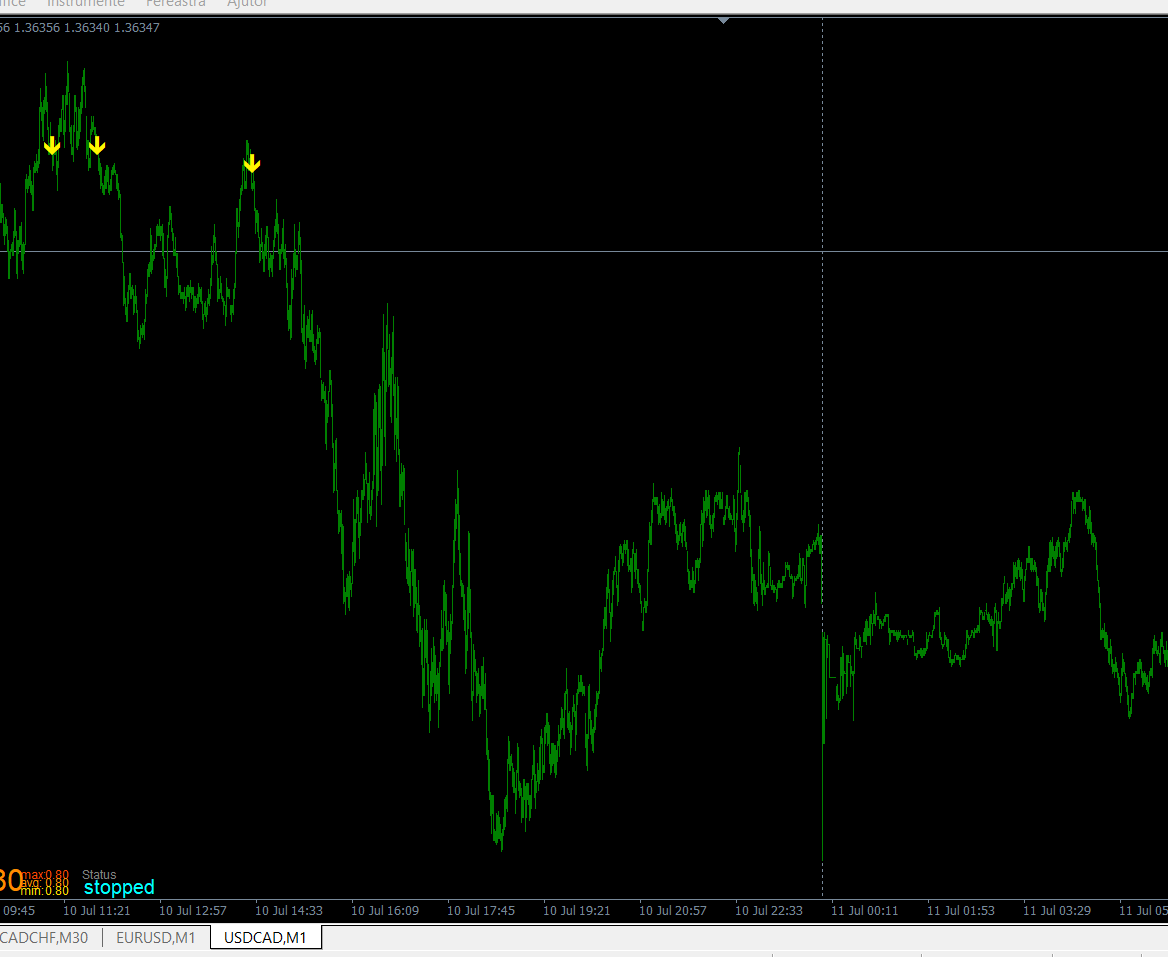
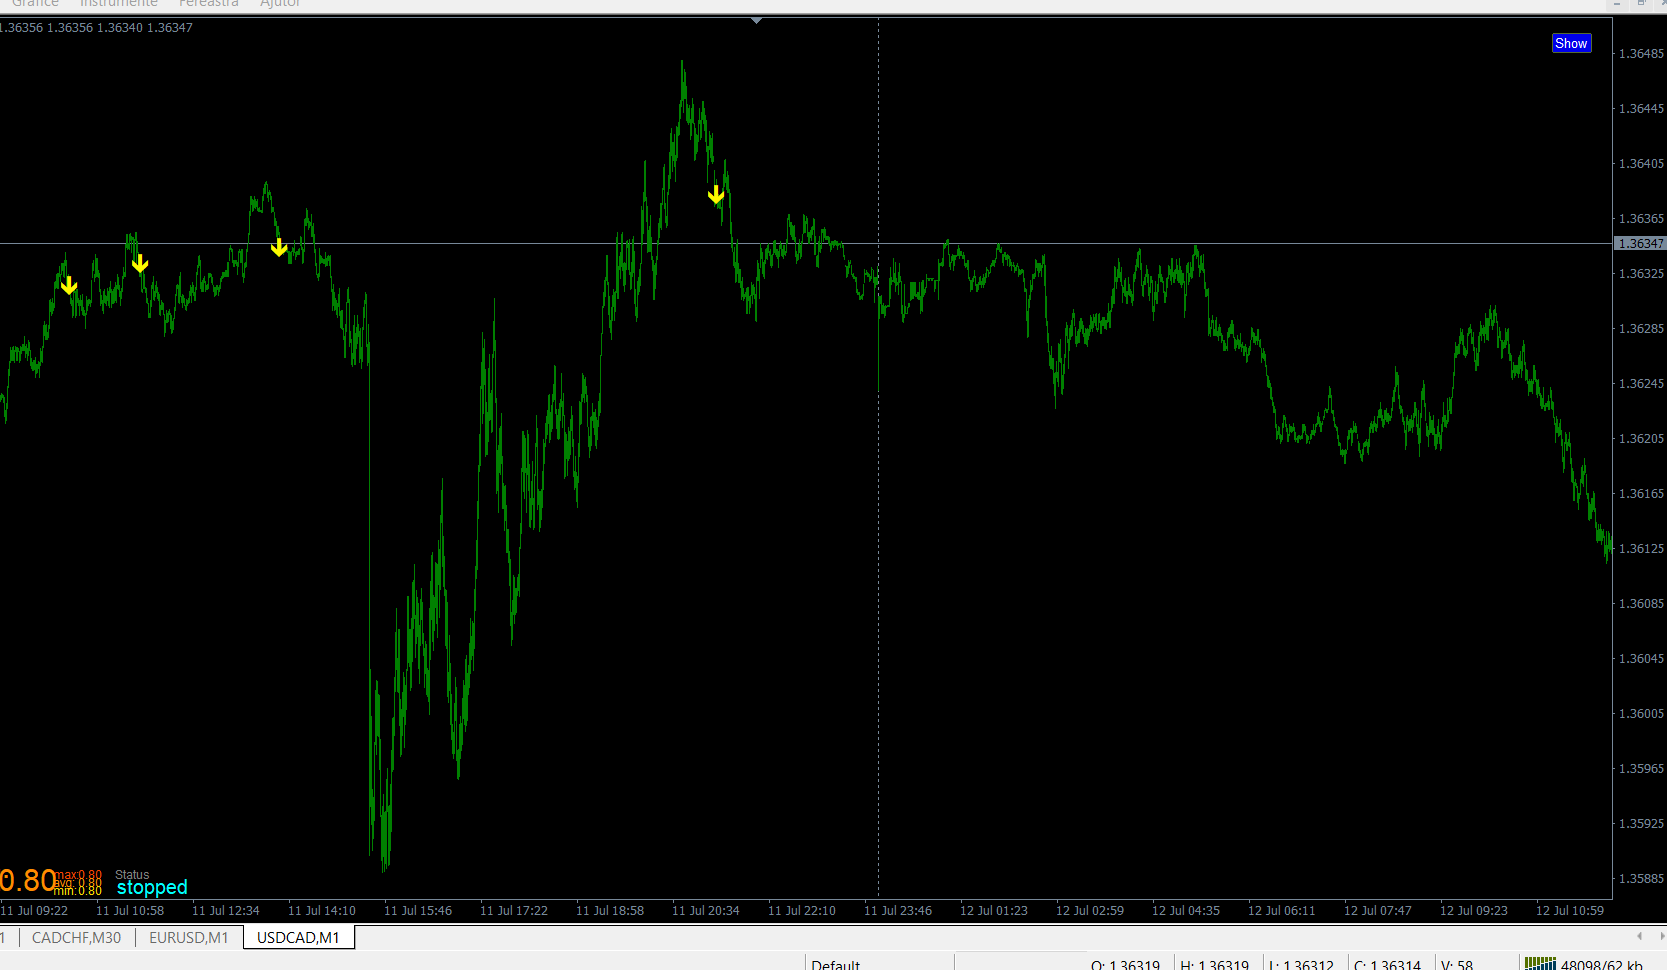
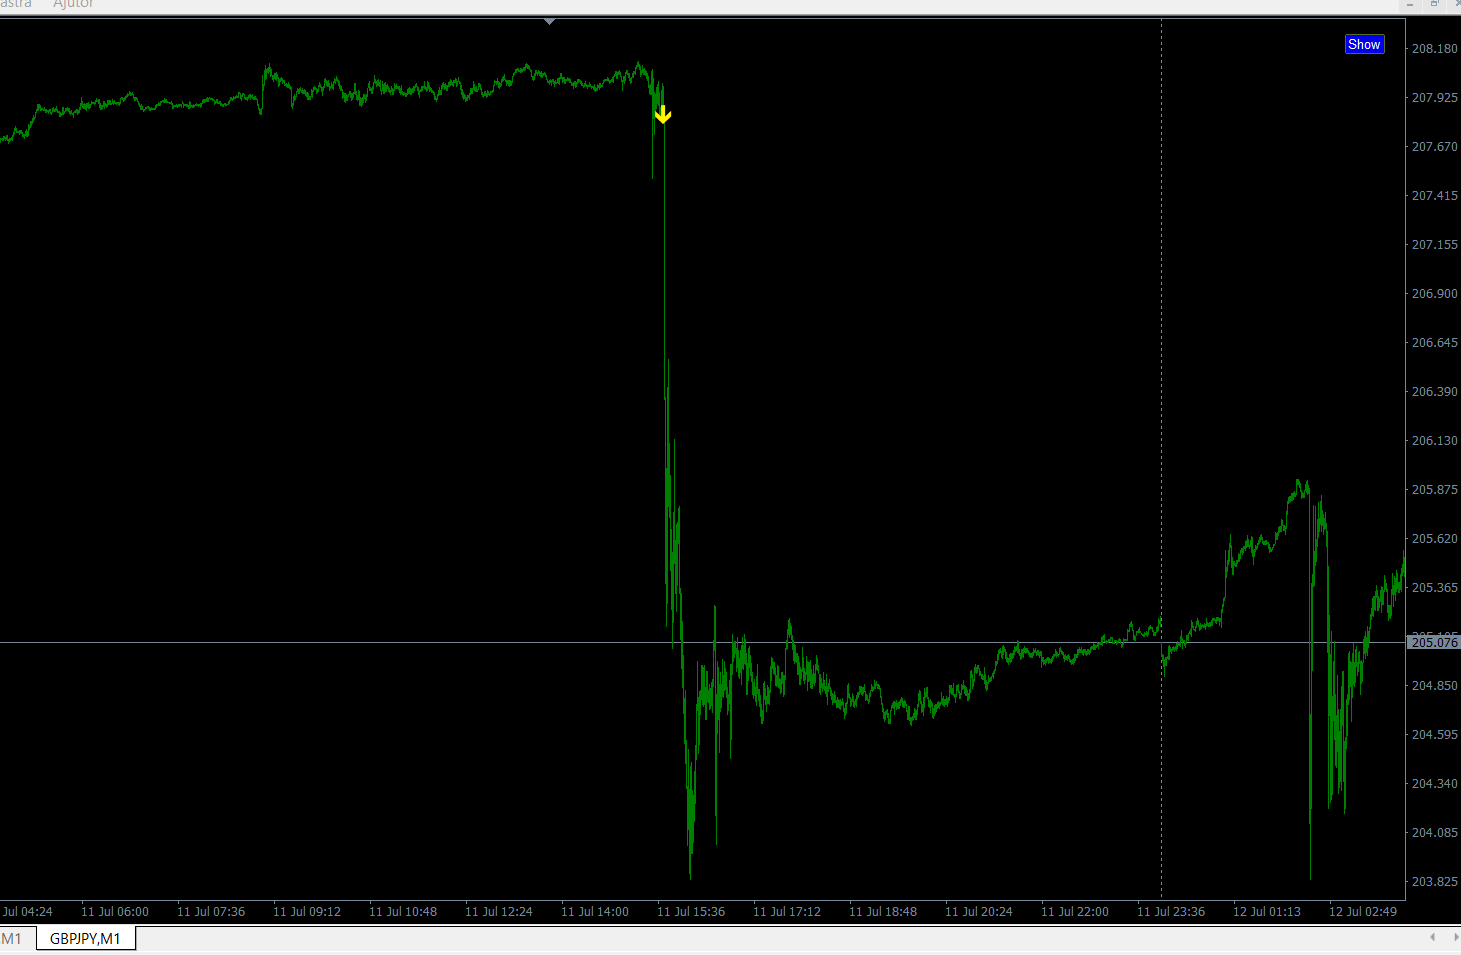
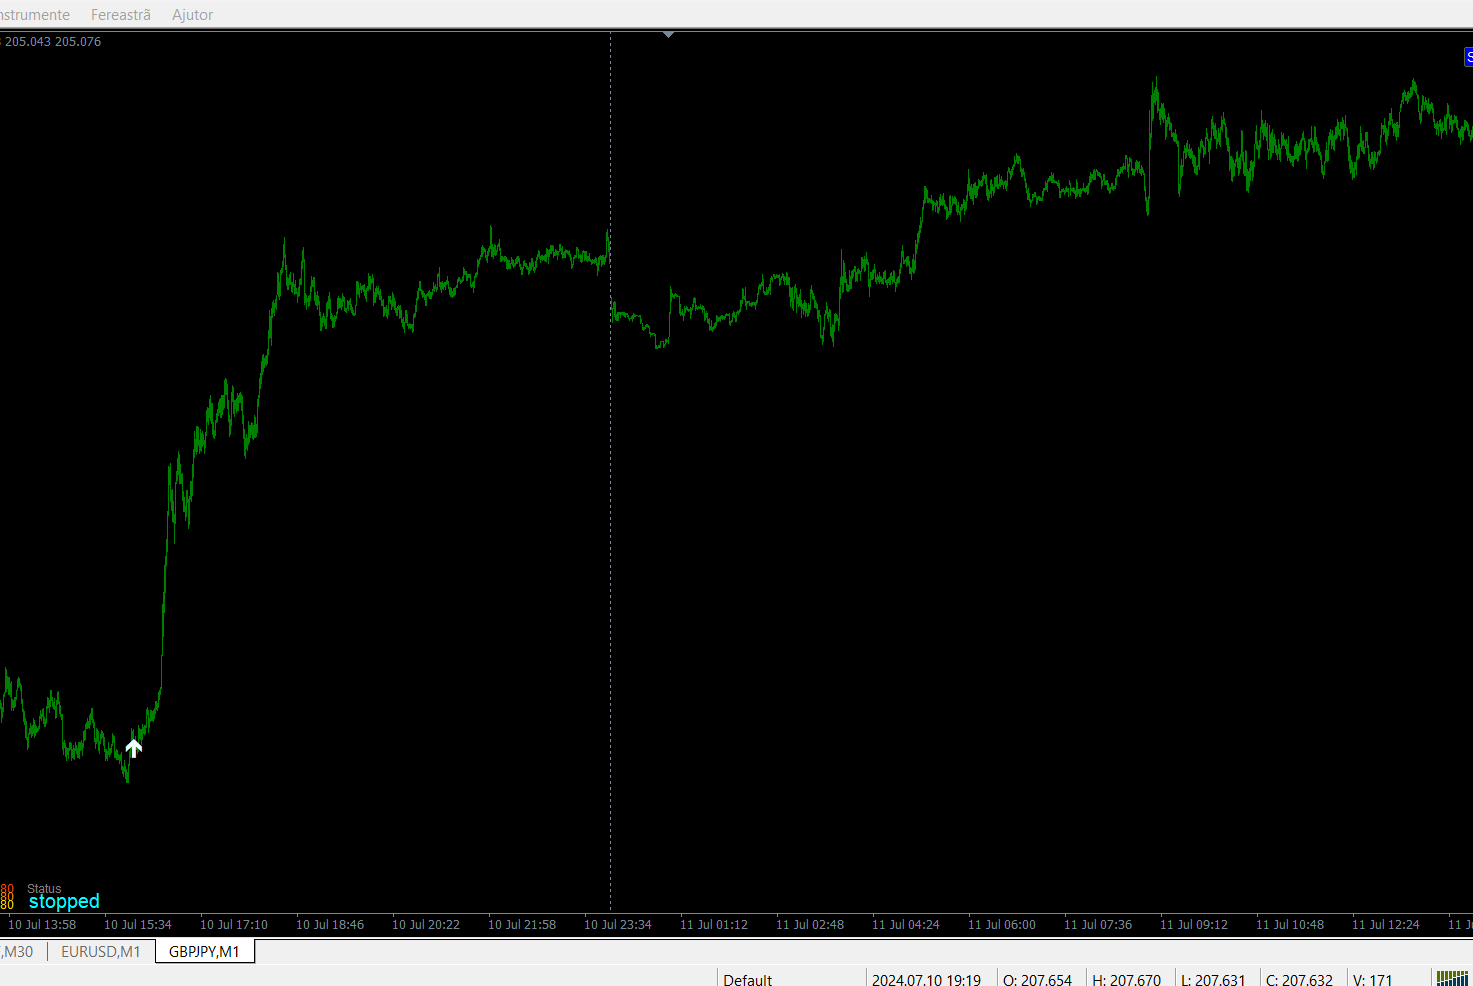
The indicator is created for M1.
The signals are very rare, but I consider them safer.
Look at the pictures.
The white arrow indicates the trigger of the operation to buy.
And the yellow arrow indicates the trigger of the operation to sell.
Of course a demo download is indicated beforehand.
If the indicator doesn't show, read my comment in the comments section.
Success!