Insight Pro MT4
- 지표
- Nikola Pocuca
- 버전: 1.0
- 활성화: 10
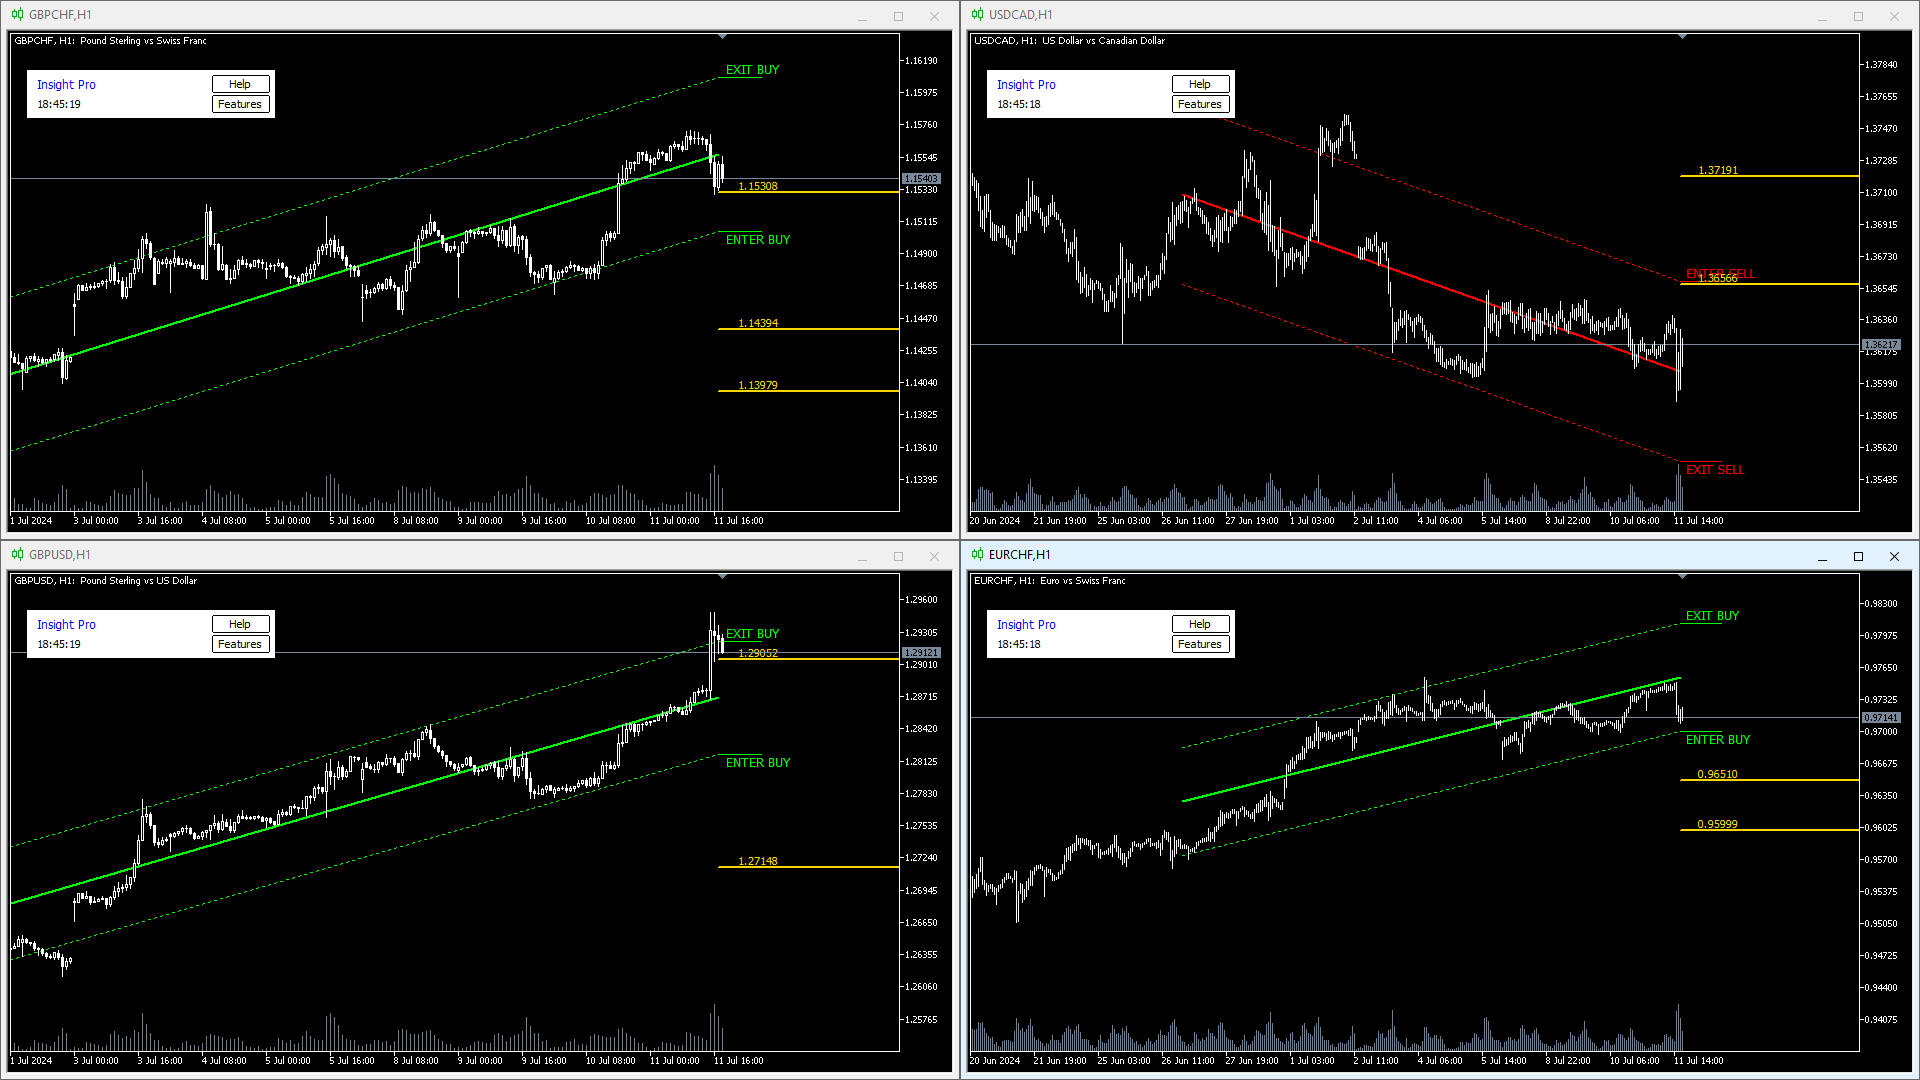
Insight Pro is a comprehensive tool for market analysis. It offers various features such as trend analysis, resistance and support levels, and distribution analysis, suitable for both novice and experienced traders.
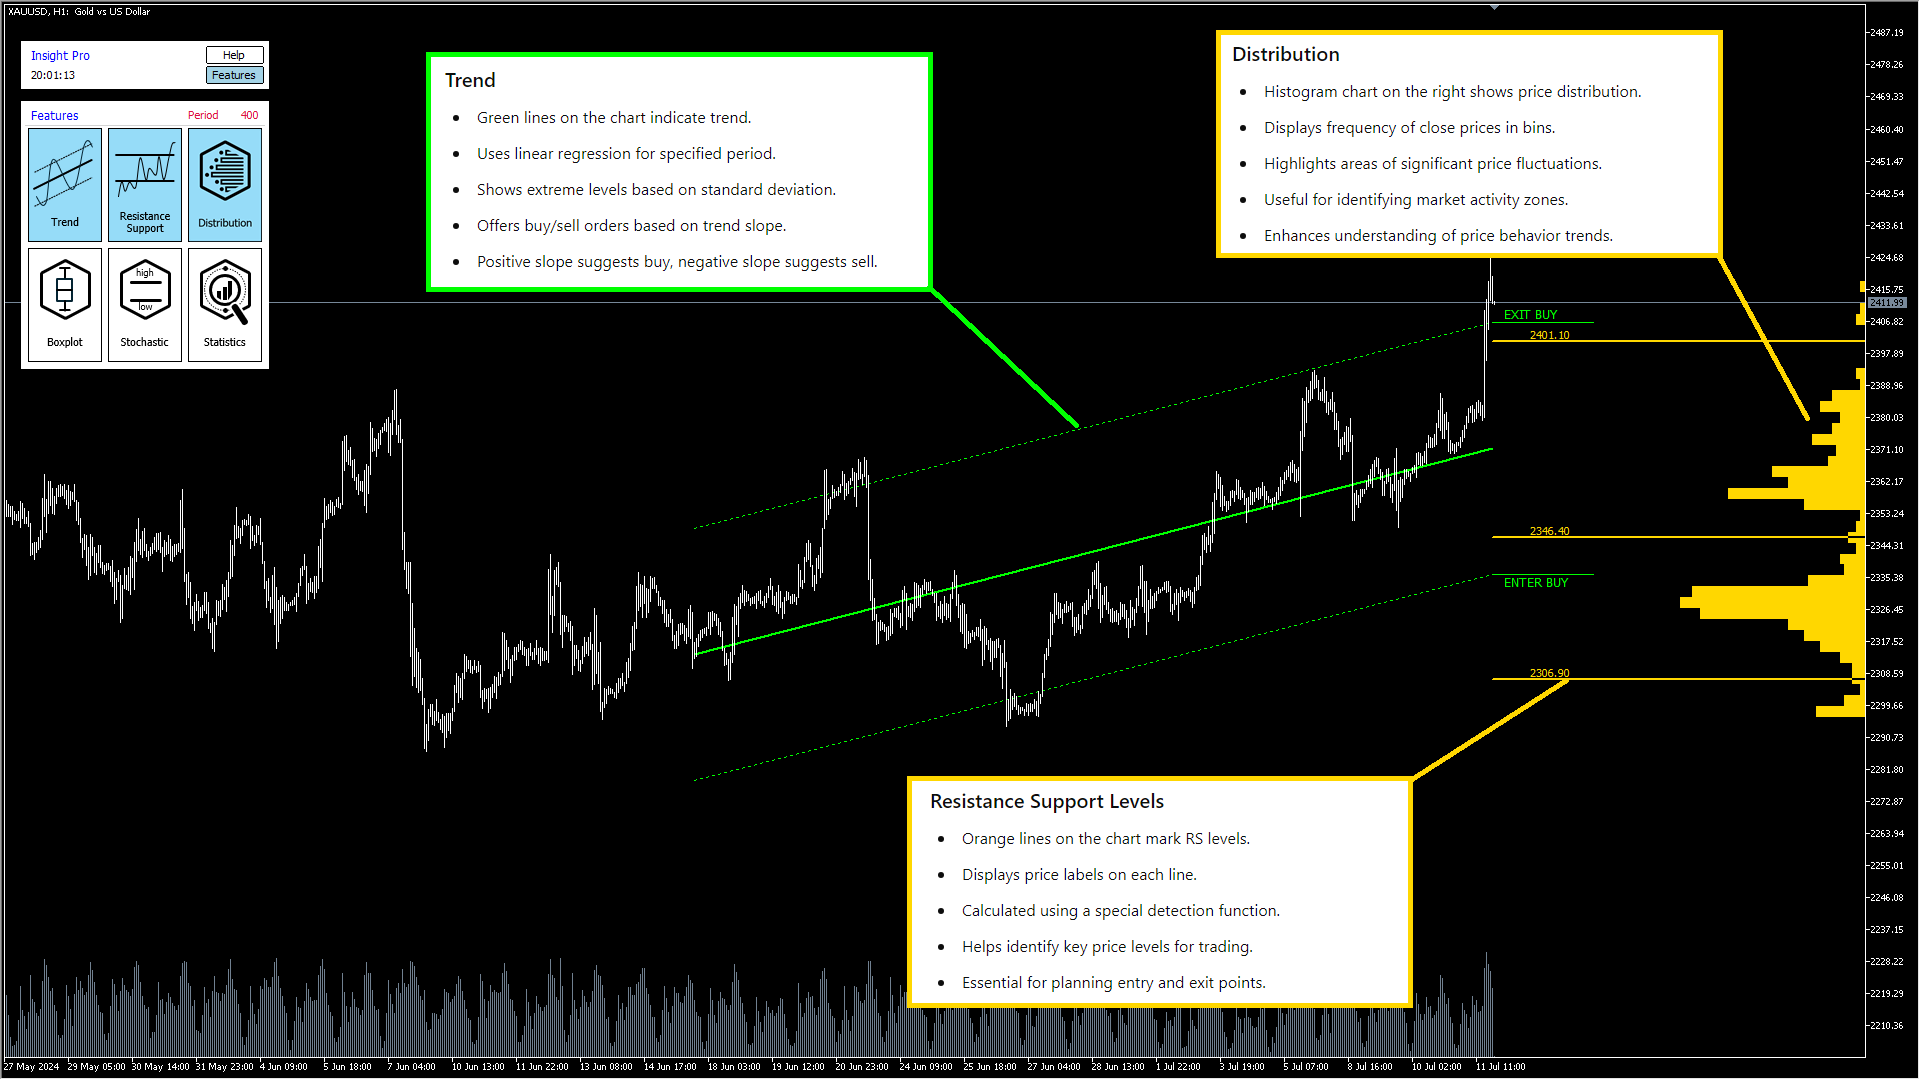
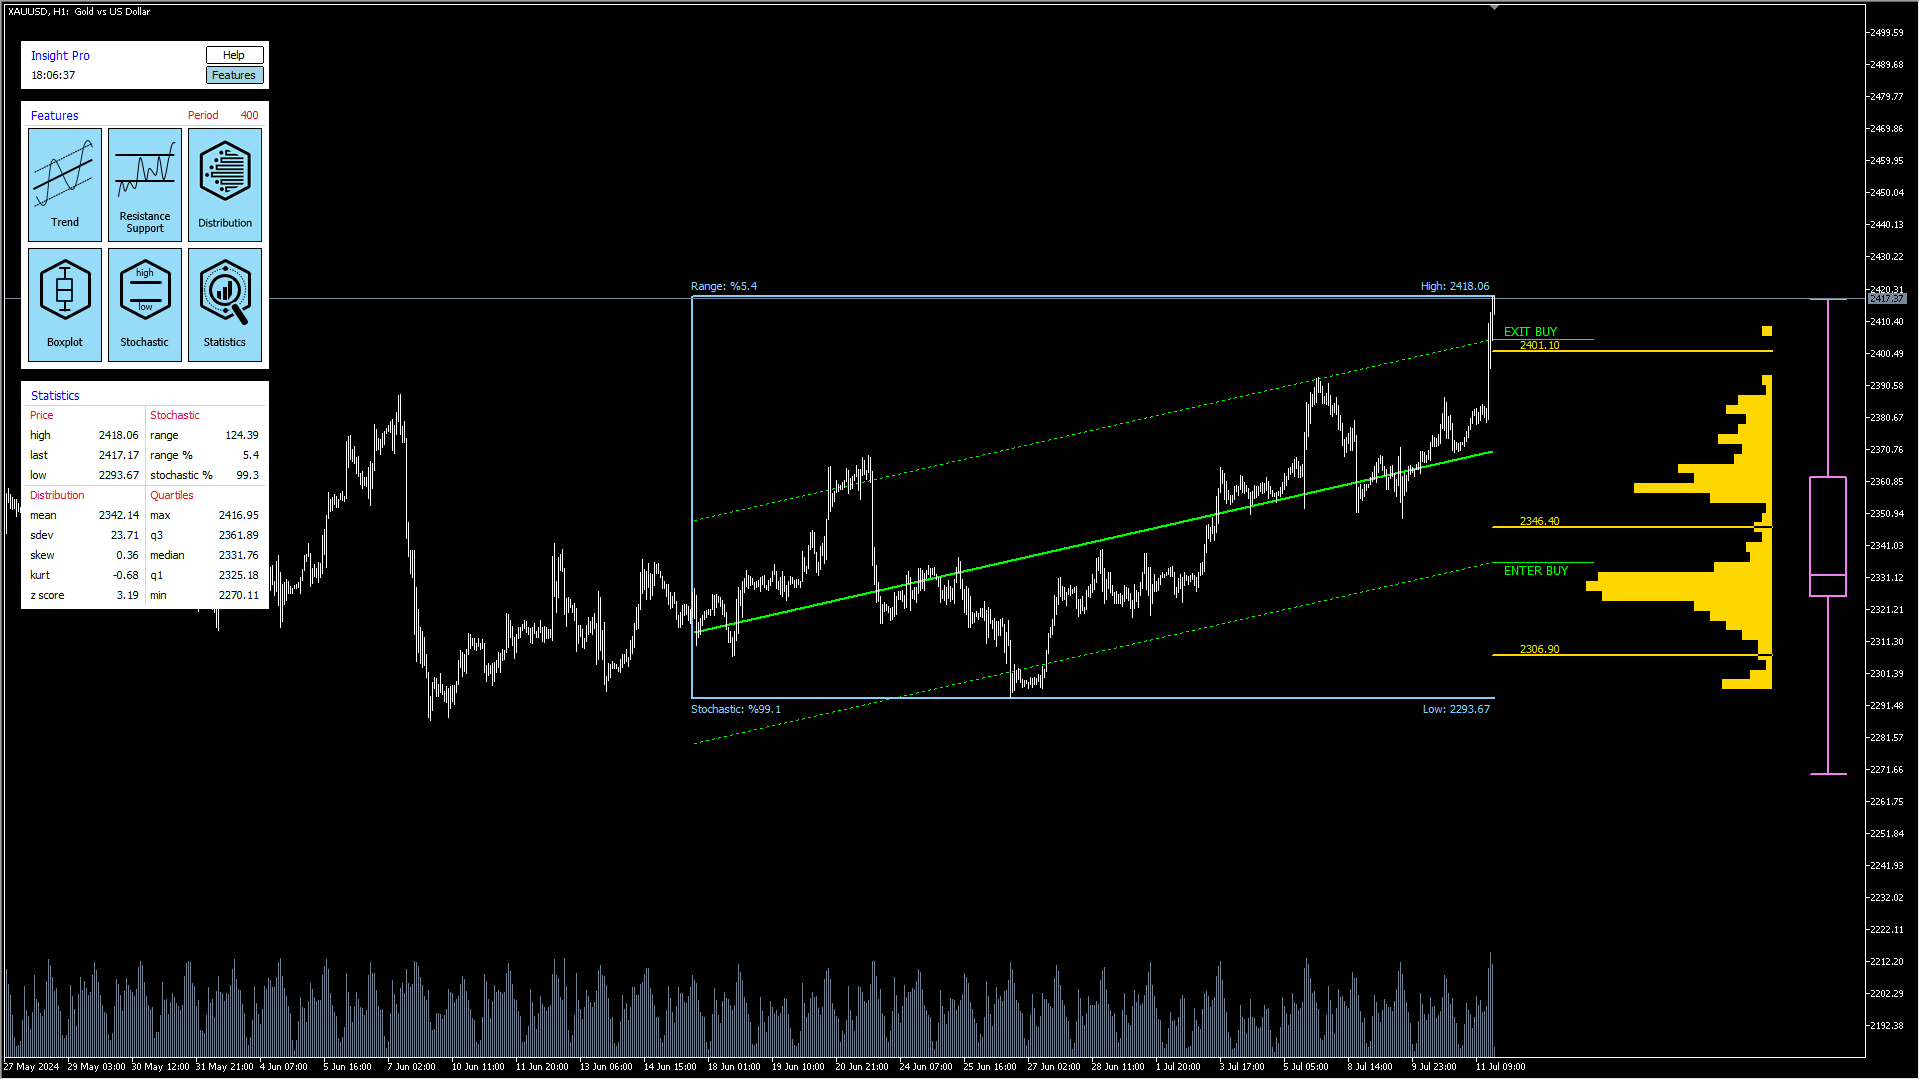
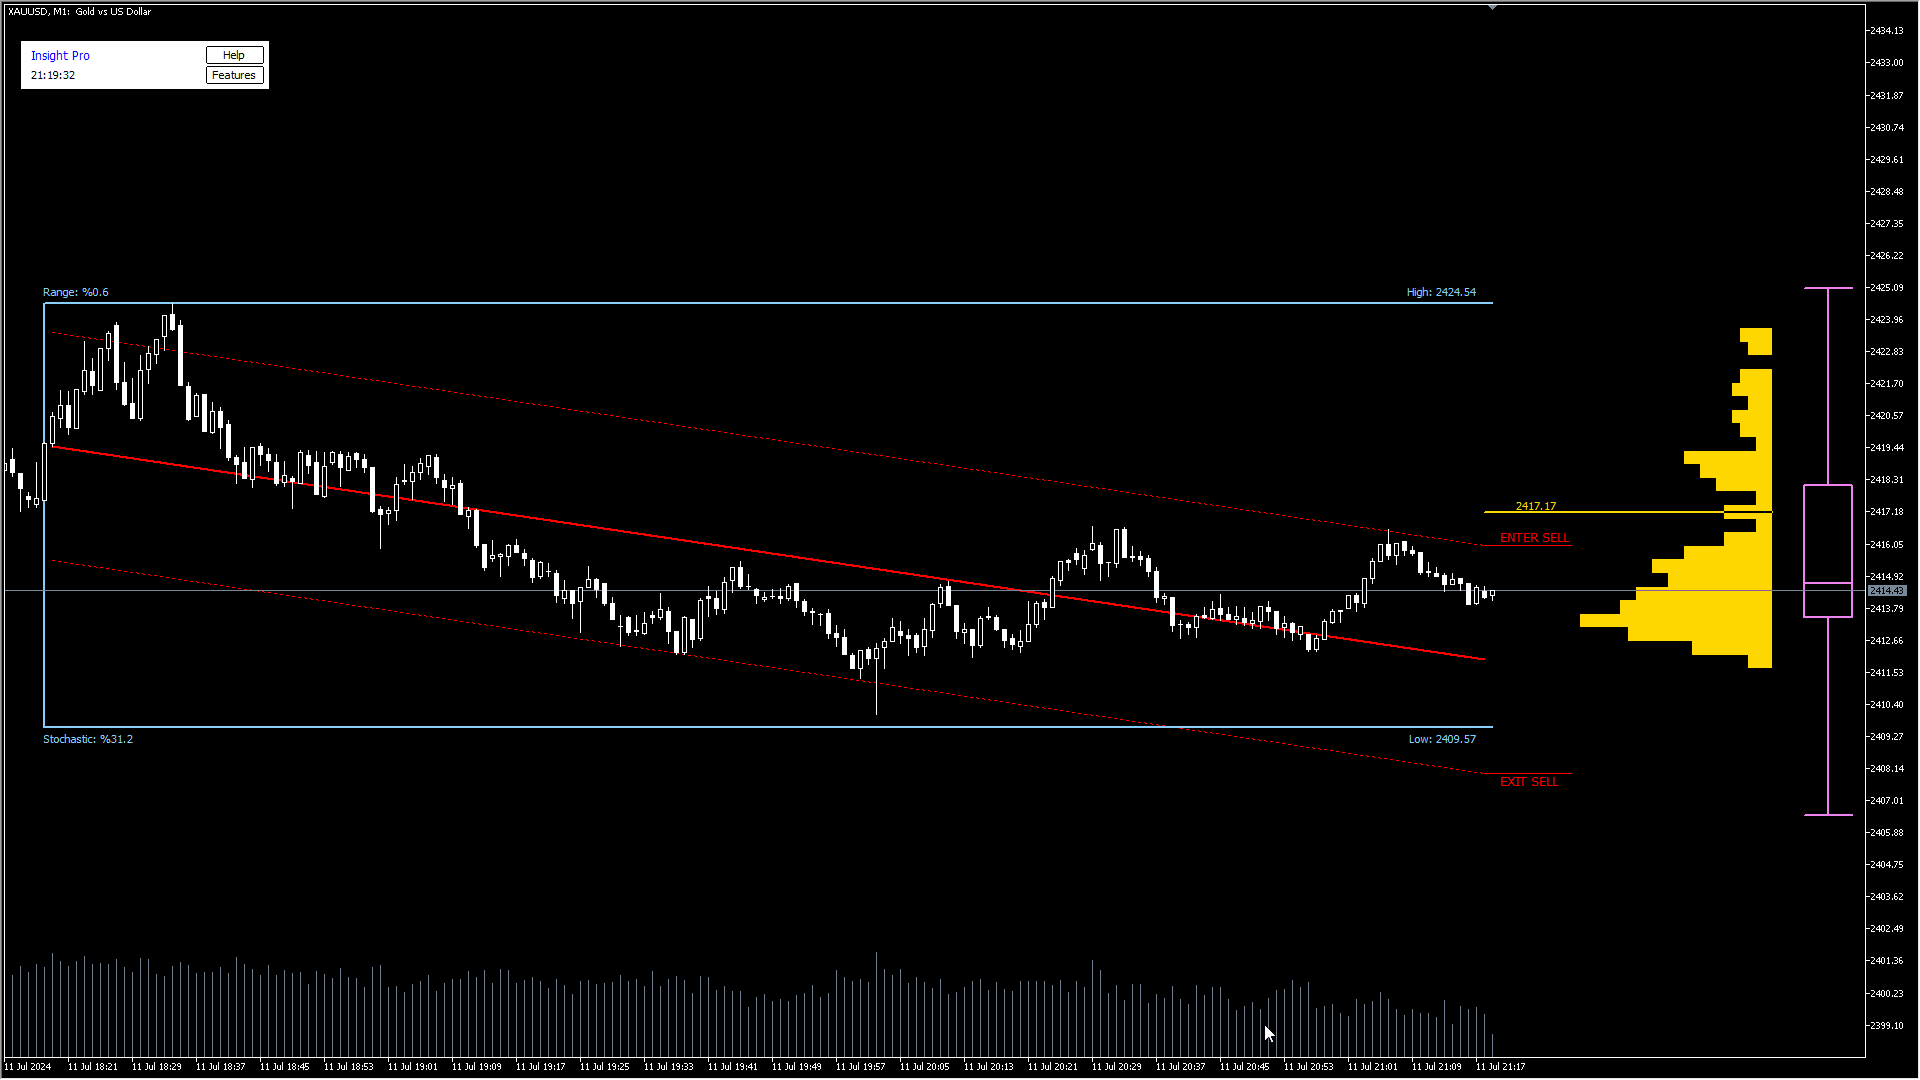
FeaturesTrend Analysis
- Detects and visualizes market trends.
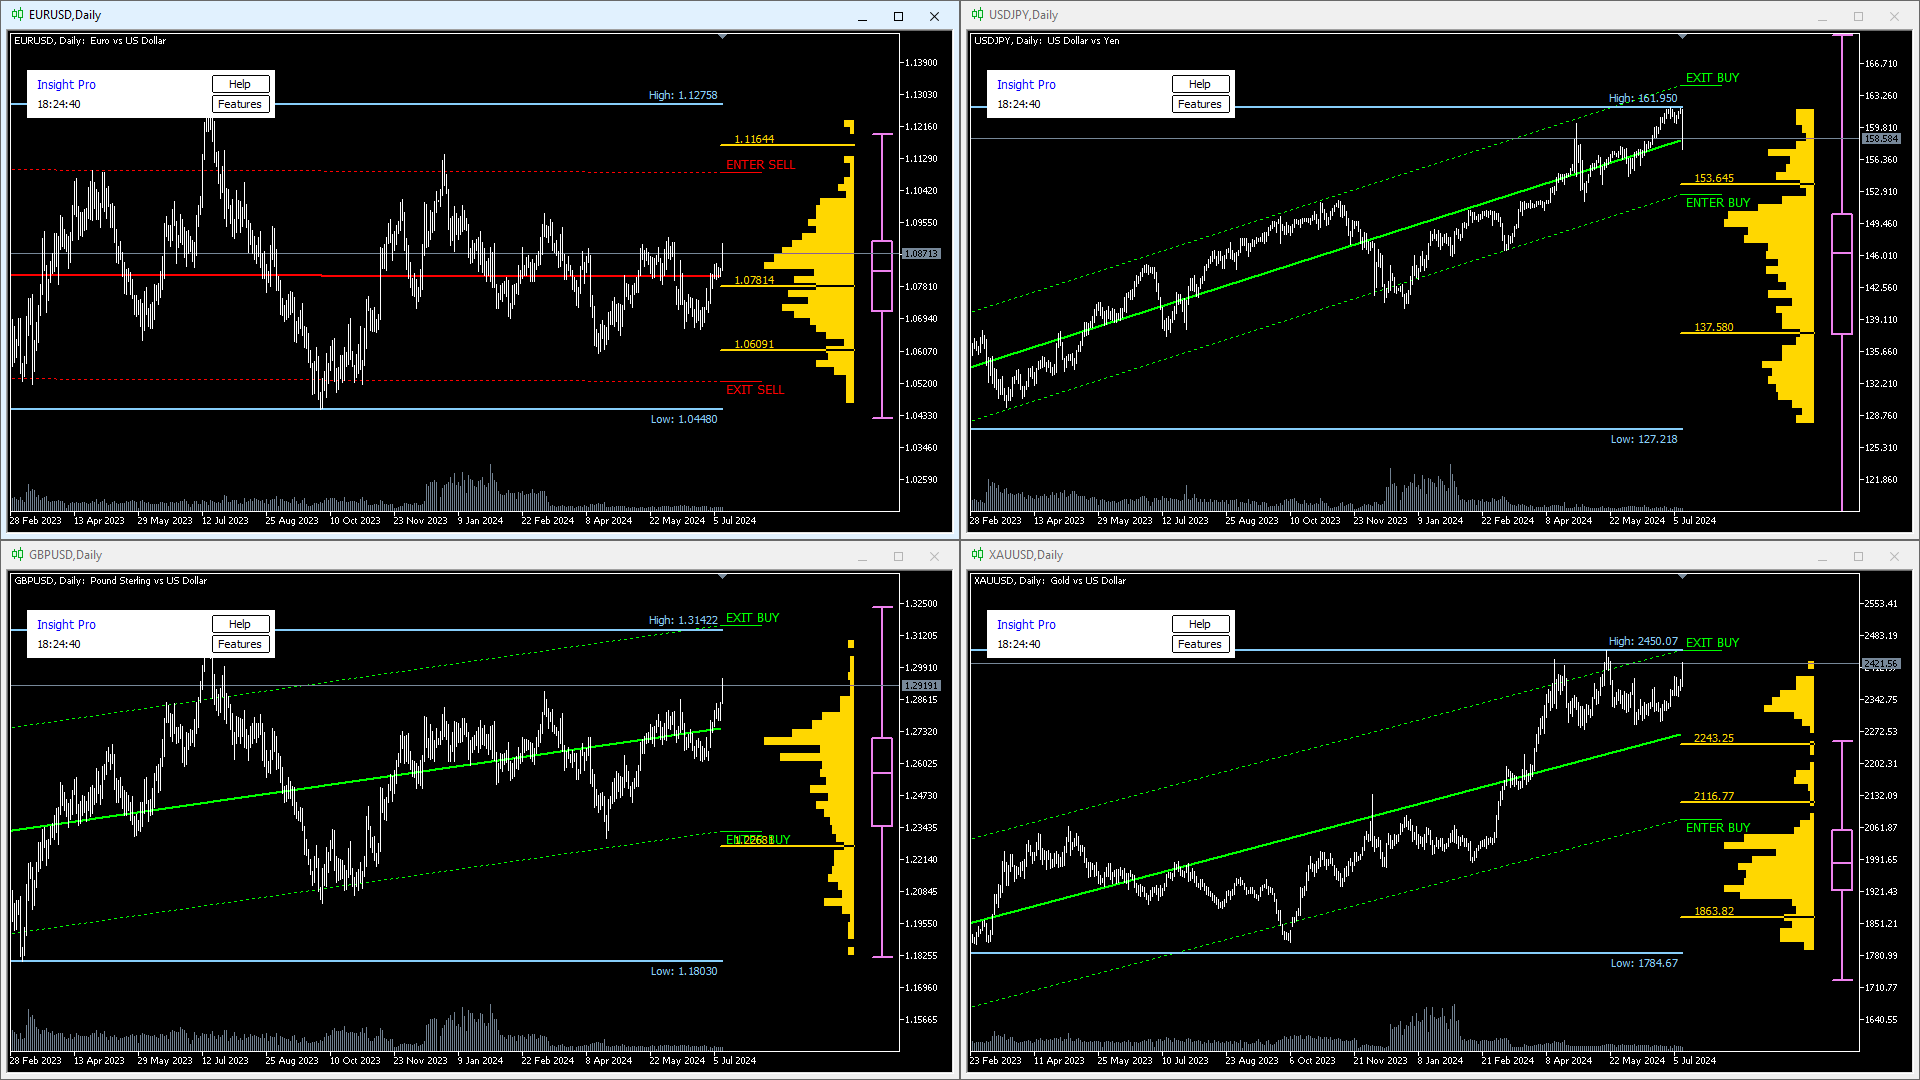
- Suggests potential entry and exit points based on trends.
- Customizable trend lines for clear market direction.
- Displays extreme levels based on standard deviation.
- Positive slope indicates buy orders; negative slope indicates sell orders.
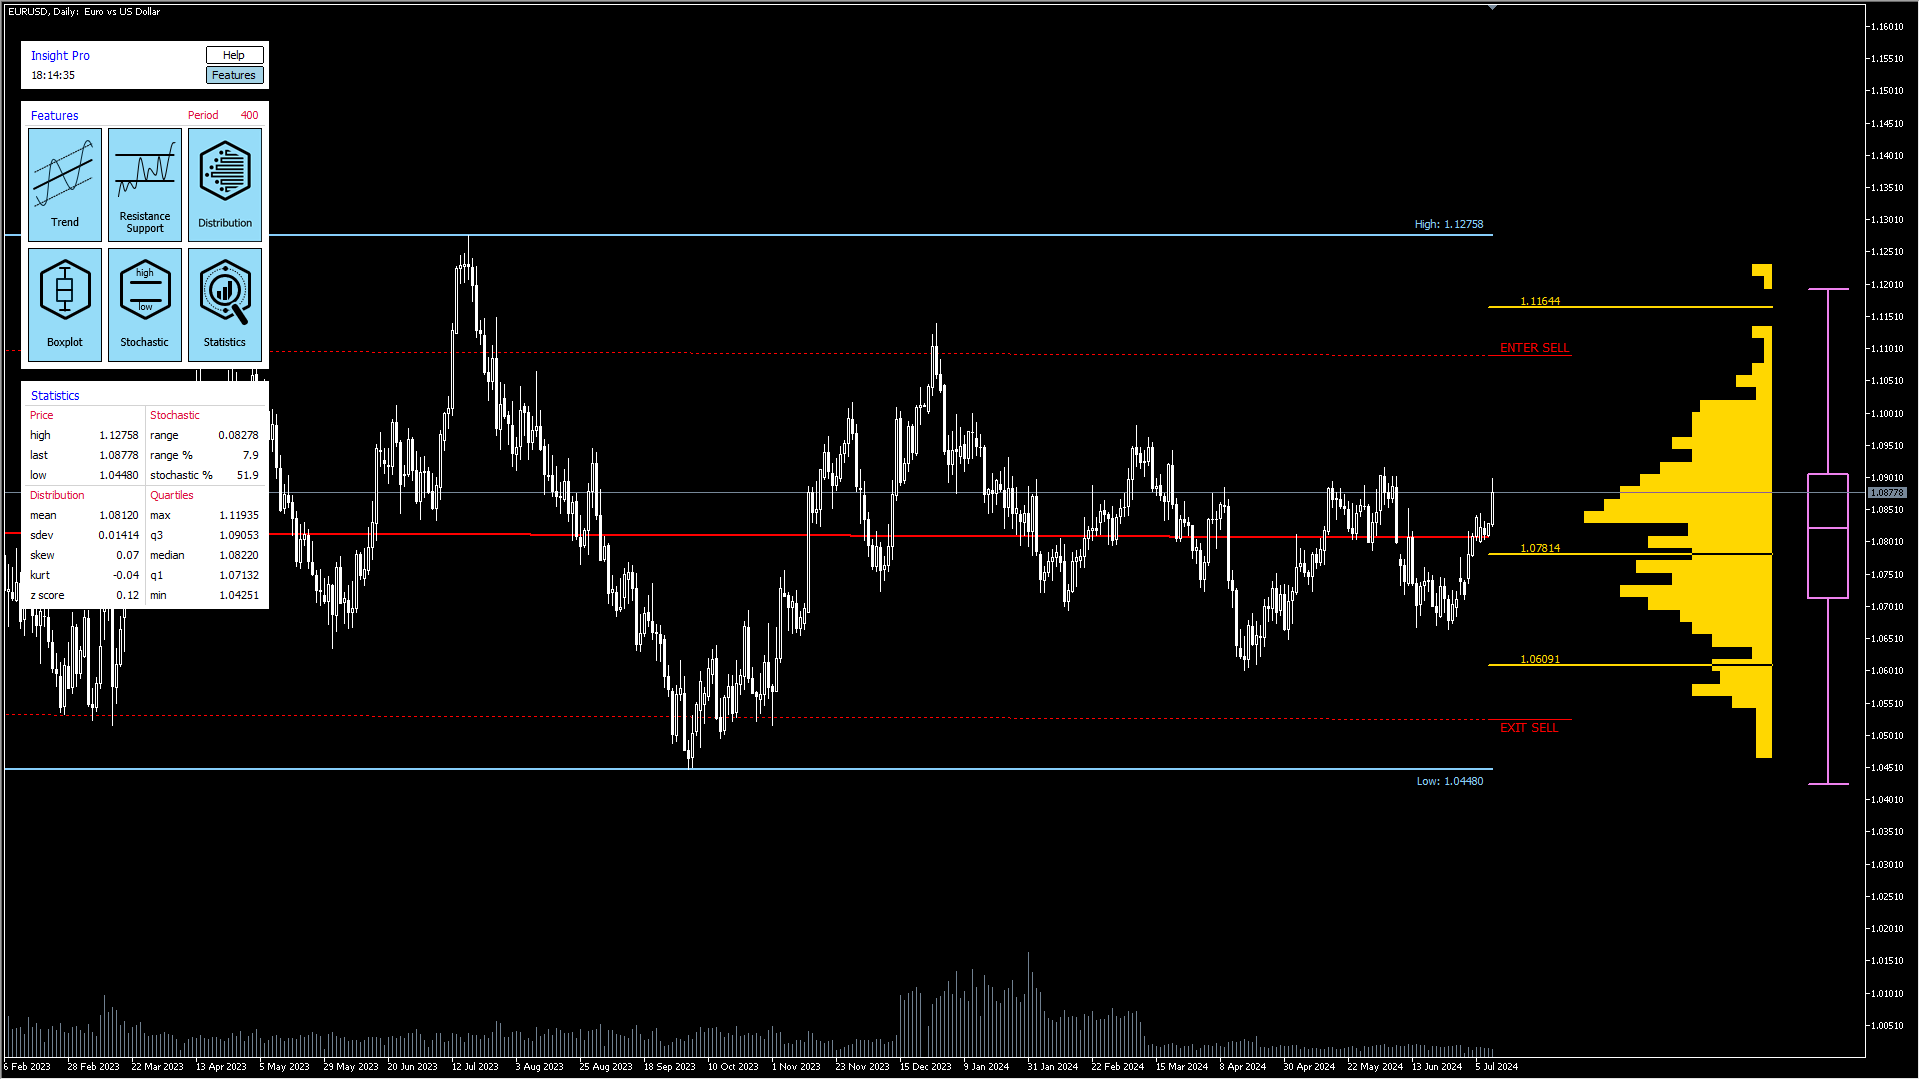
Resistance and Support Levels
- Identifies key price levels where the market tends to reverse.
- Density parameter controls the number of levels displayed.
- Displays price labels for easy identification.
- Historical levels provide a comprehensive view of market behavior.
Distribution Analysis
- Analyzes price distribution over a specified period.
- Creates a histogram of price movements.
- Highlights areas of price consolidation and potential breakout points.
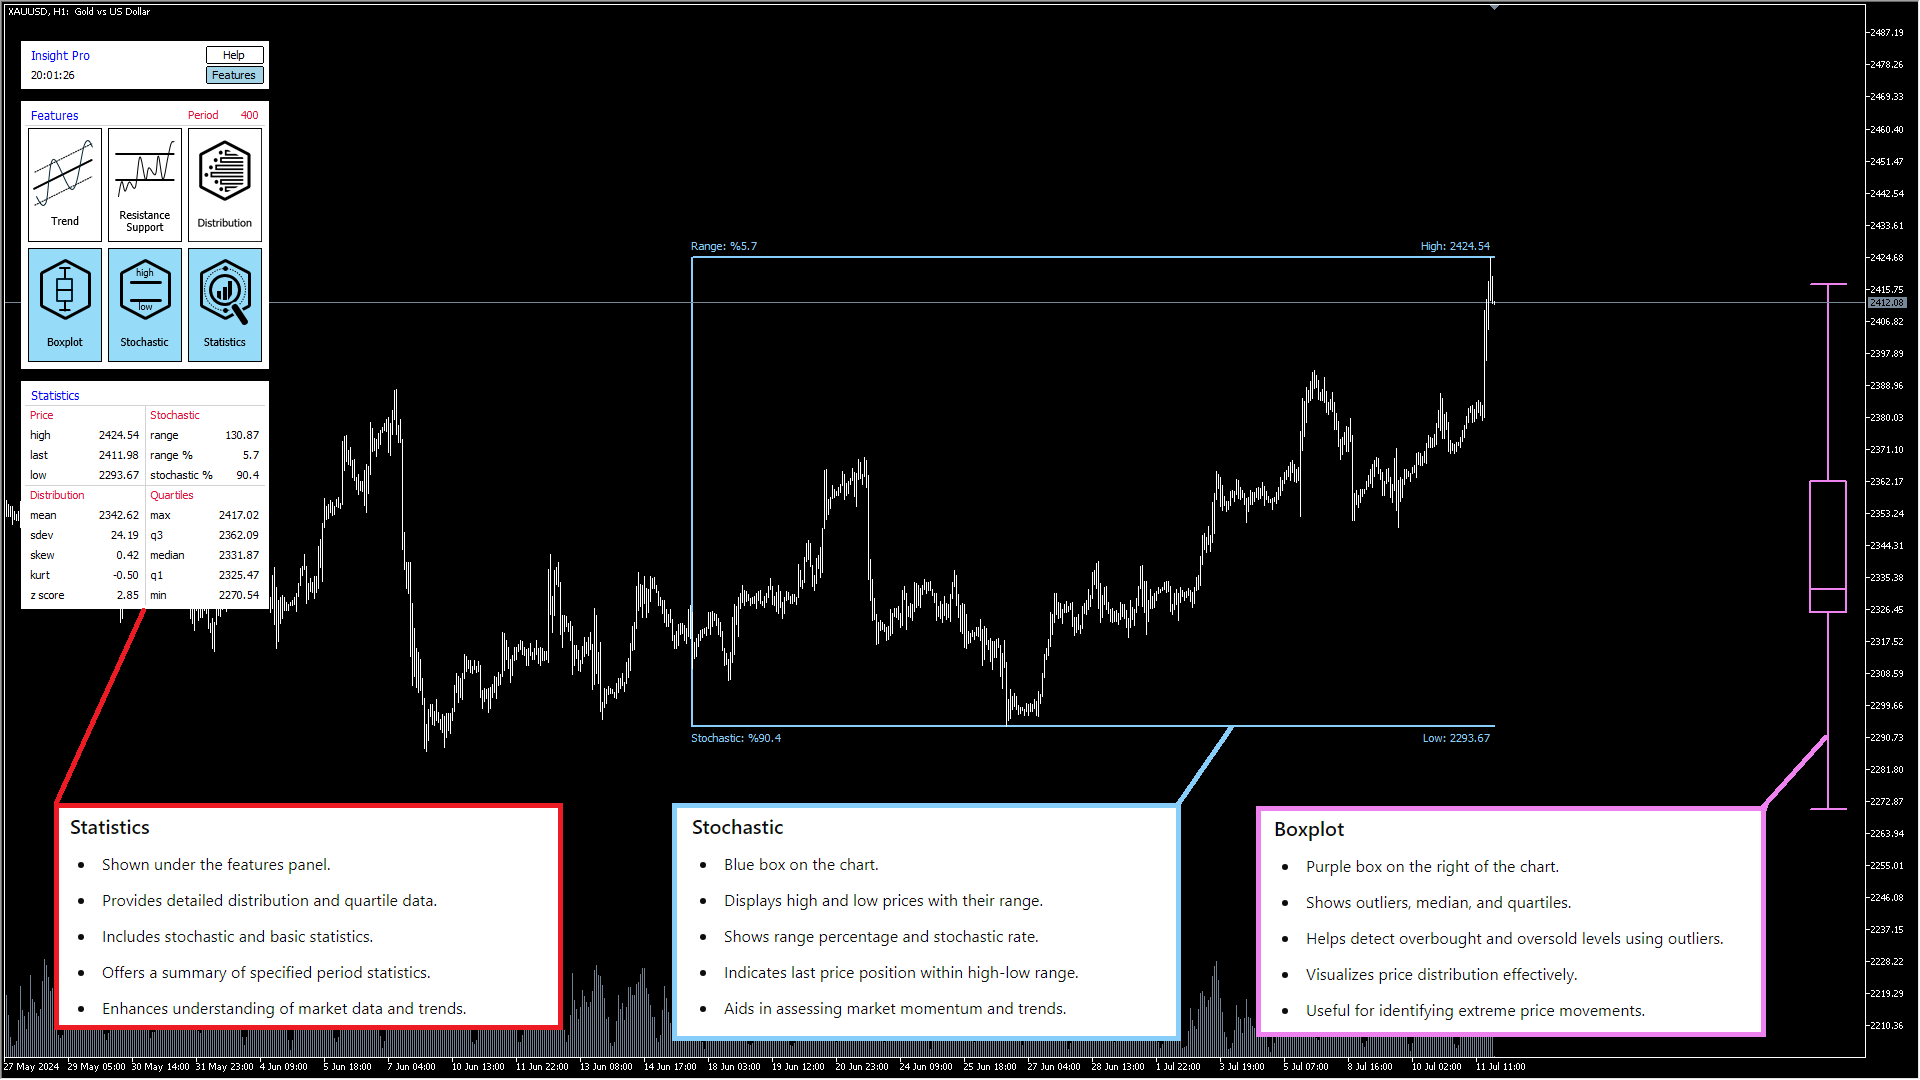
Boxplot Analysis
- Visualizes statistical distribution of price data.
- Includes whiskers for range, box for interquartile range, and line for the median.
- Detects outliers and identifies overbought/oversold levels.
Stochastic Analysis
- Provides information about high and low levels over a specified period.
- Displays range percentage and stochastic rate.
- Indicates last price position within the high-low range.
- Assesses market momentum and potential reversal points.
Statistical Analysis
- Performs statistical analysis on price data.
- Includes mean, standard deviation, skewness, kurtosis, and z-score.
- Provides a summary of specified period statistics.
Calculation
- Period: Number of bars used for calculation (default: 400).
- Trend Extreme Level: Threshold for detecting extreme trend levels (default: 2.0).
- Resistance Support Density: Controls density of levels displayed (options: Less/Normal/More).
Features
- Enable or disable each analysis feature (options: On/Off).
Properties
- Customize display options for trend suggestions, forecast lines, and historical levels.
Colors
- Select color themes and customize colors for different analysis features.
Timeframes: Suitable for all timeframes; longer timeframes (H1 and above) are recommended for trend analysis.
Markets: Versatile for forex, commodities, indices, and cryptocurrencies.
Accounts: Suitable for all account types.
Customization: Adjust colors and themes for better visibility and clarity.
Combining Features: Use a combination of analyses for a comprehensive market view.
Insight Pro combines advanced features with a user-friendly interface, aiding in informed trading decisions.