IQ FX Gann Levels
- 지표
- INTRAQUOTES
- 버전: 1.5
- 업데이트됨: 29 11월 2024
- 활성화: 5
FLASH SALE FOR THE NEXT 5 purchases! Grab this game-changing indicator for a lifetime at just $99.
DOWNLOAD MANUAL: Contact us to receive a comprehensive user guide after purchasing.
Technical Support: If you face any technical issue with the indicator, contact us or comment here in this product page.
William Delbert Gann, commonly known as W.D. Gann, was an exceptional market analyst renowned for his unique trading style in the early 20th century. His trading techniques were based on a blend of mathematics, geometry, astrology, and ancient mathematics. Gann believed that stock market movements followed specific patterns and cycles, rather than being random. His methodologies, celebrated for their accuracy and relevance, continue to be utilized by many traders in today's markets.
- Download the Metatrader 5 Version
- On purchasing our product, you will receive a comprehensive user guide in PDF format. Contact us after purchasing, and we will promptly send you the user guide.
A Note from the Developer to all the Traders:
"For over fifteen years, I immersed myself in the intricate world of financial markets, with a particular focus on Gann Theory. My journey, filled with meticulous research and countless hours poring over hundreds of resources, led me to a pivotal discovery: a formula within W.D. Gann's works that became the foundation of this IQ FX GANN LEVELS indicator.
This indicator, crafted from the critical and complex theories of Gann, provides traders with accurate trade level signals, serving as reliable market support and resistance throughout the day. This indicator is the result of synthesizing Gann's profound insights into an intuitive and actionable tool.
The creation of this indicator of mine is a blend of art and science, culminating in recognition with the MQL5 silver award. Today, I am pleased to offer the IQ FX GANN LEVELS indicator at an affordable price, making this sophisticated tool accessible to all traders. It is my hope that this indicator will serve as a valuable companion, providing clarity and confidence in the ever-evolving landscape of financial markets."
Supported Symbols: The indicator works on Forex Major and Minor pairs only at its optimum performance.
Applicable Timeframe:
The indicator works best on 5M to Hourly charts only.
Who is this indicator for?
Any trader who is well versed in the basics of trading. Has a clear concept of price action, trend indicators, and trading operations.
Indicator Details:
- Indicator by default plots on 5 minutes chart to show the interim market movement clearly for a day.
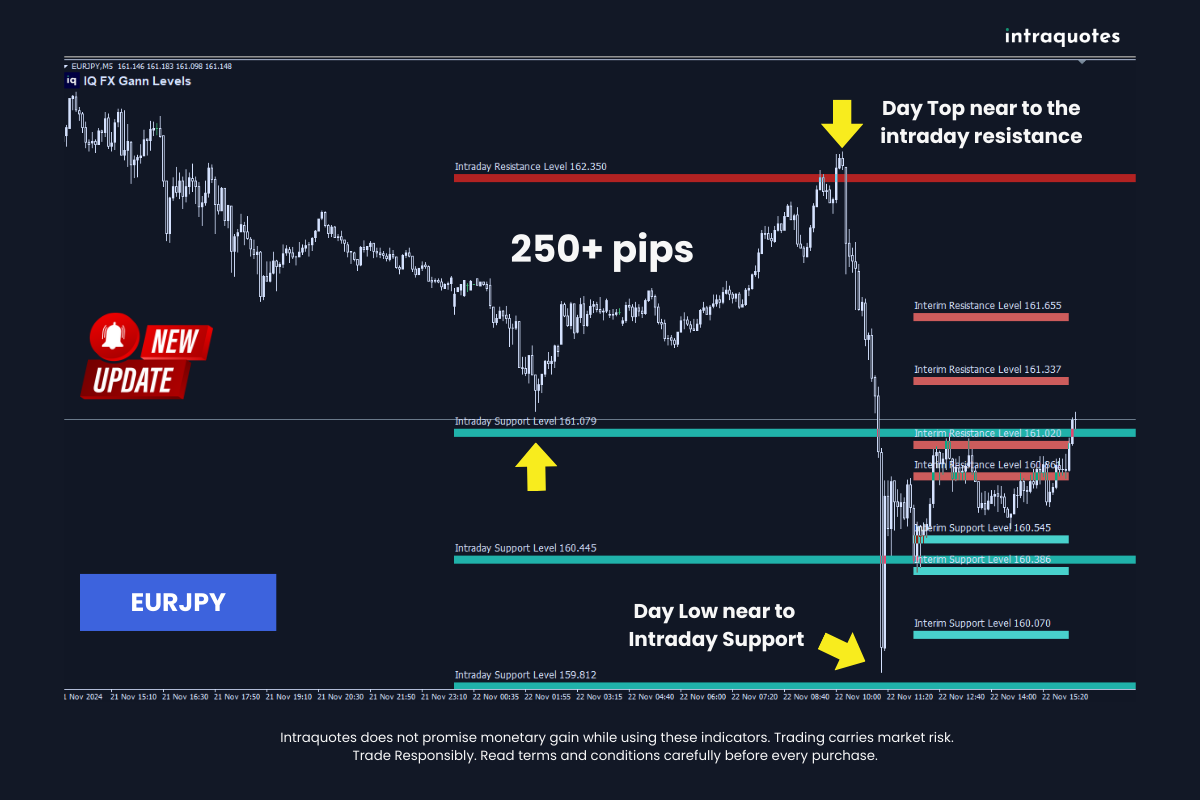
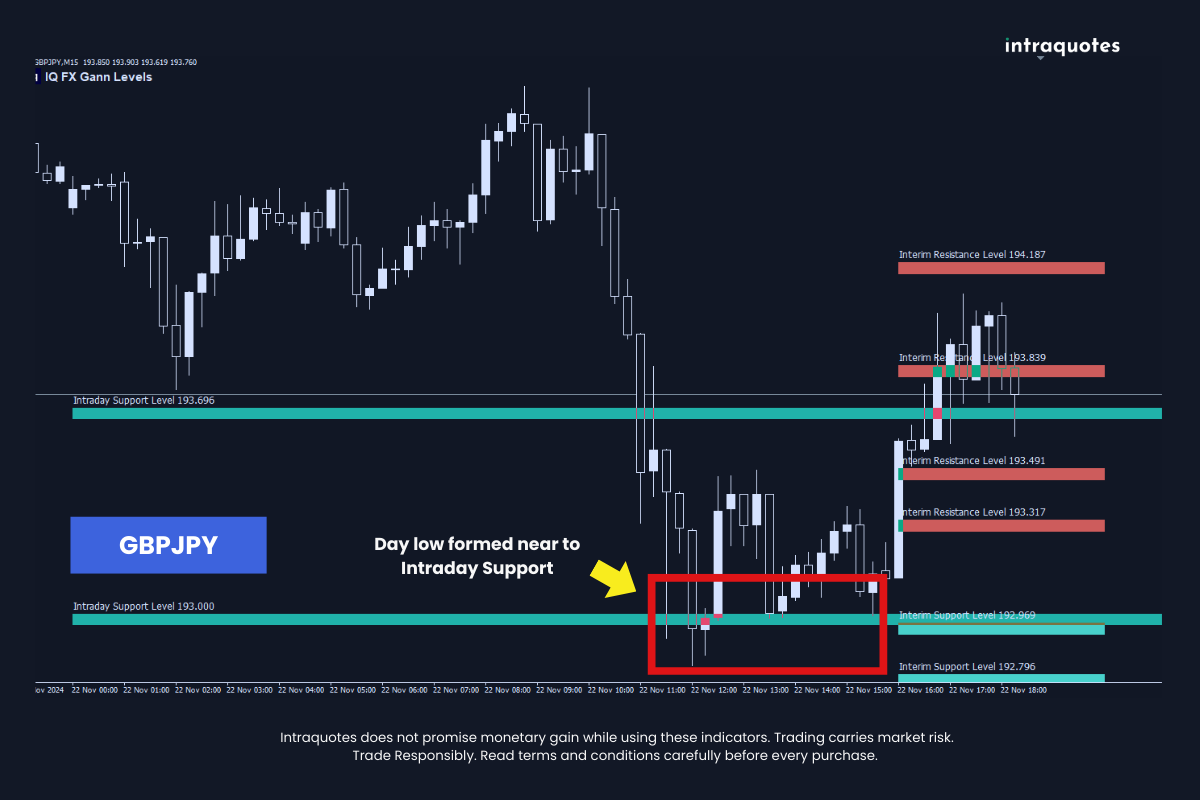
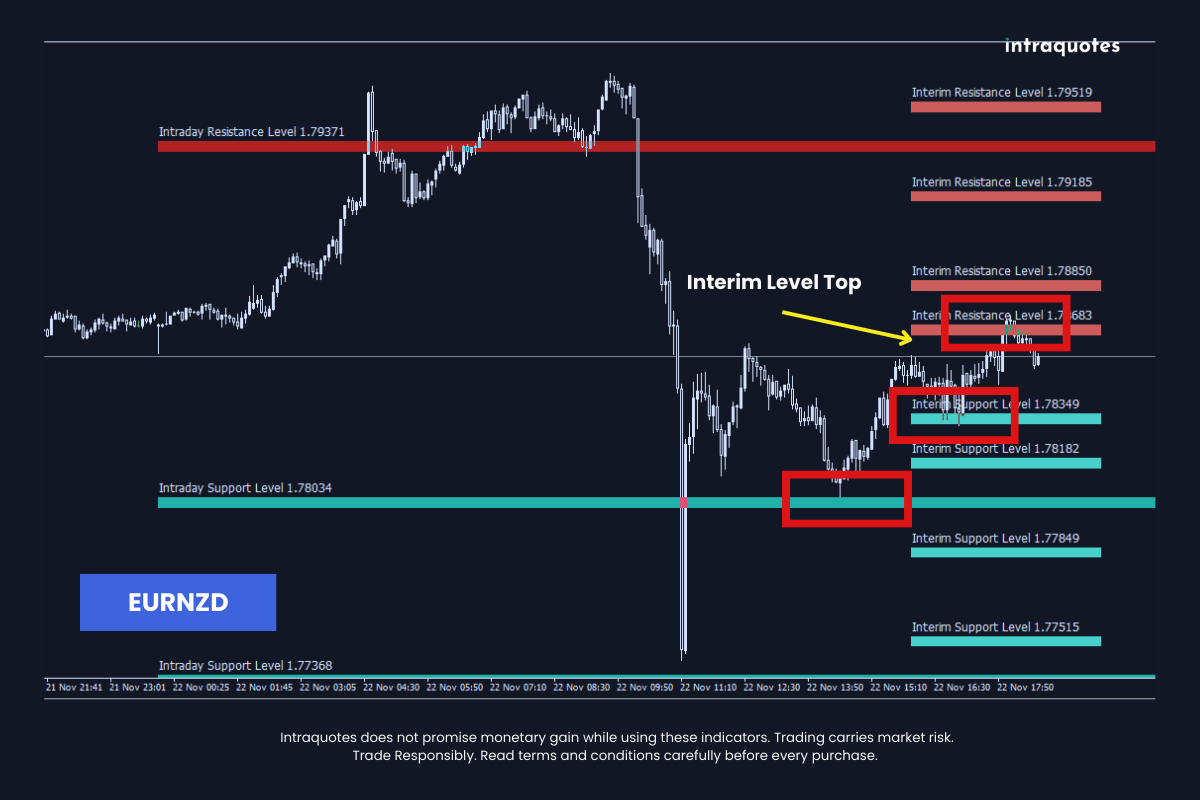
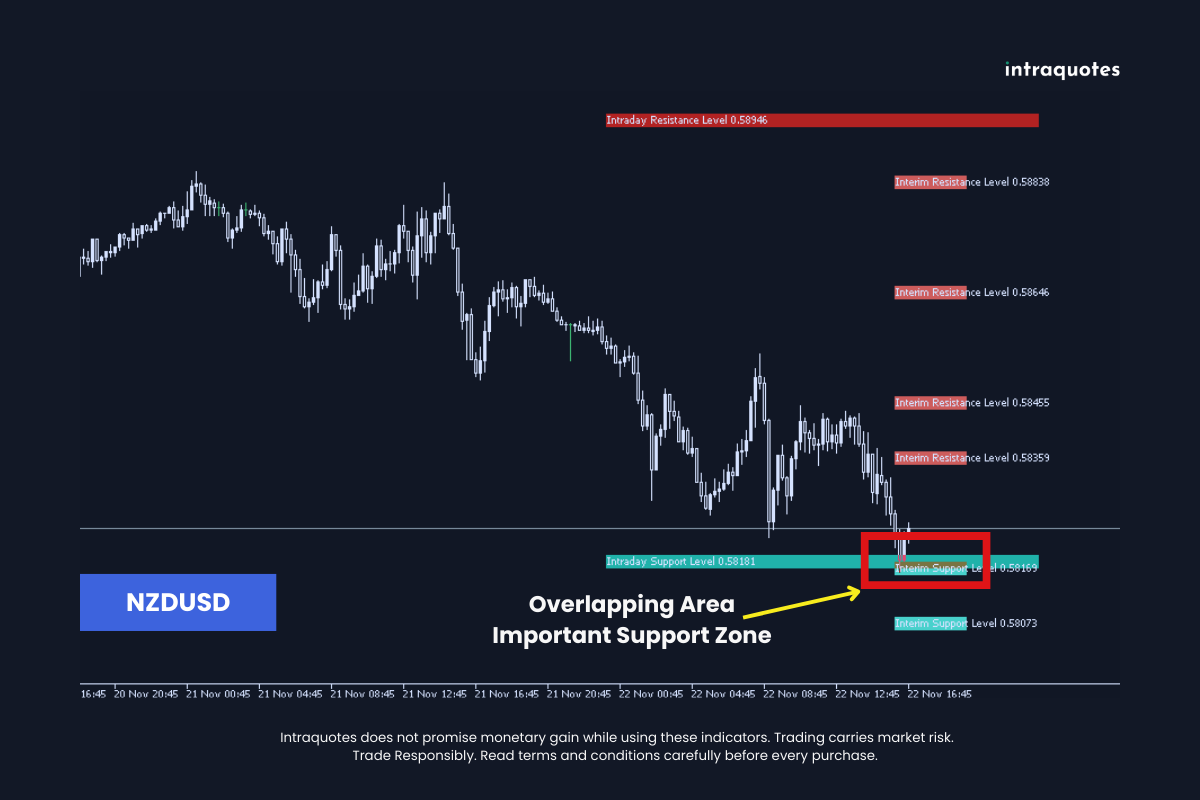
- Indicator WD Gann Levels: This indicator shows two types of trade levels.
- Intraday trade levels, and
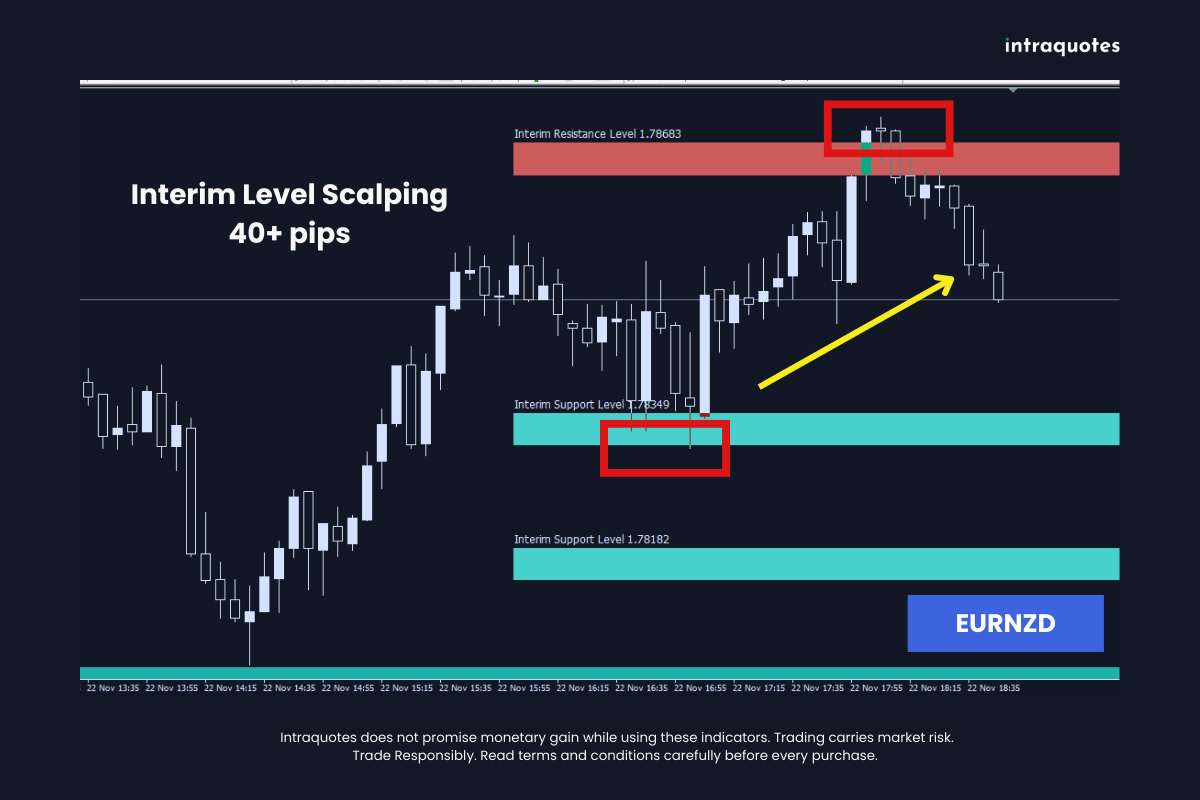
- Interim trade levels.
- Indicator trade levels are valid for the current day only, which helps understand the daily possible market movements.
- Indicator interim trade levels adjust automatically from time to time.
How can it help you?
- This indicator is specially designed for Forex Day Trading.
- The indicator helps to predict day highs and lows, and interim highs & lows using our Gann Levels.
- The indicator helps to predict scalping or sweet spot entry points for day trading.
- The Indicator works best for both major and minor pairs.
Compatible Trading Styles:
- Trend following
- Breakout
- Continuation
- Trend reversal
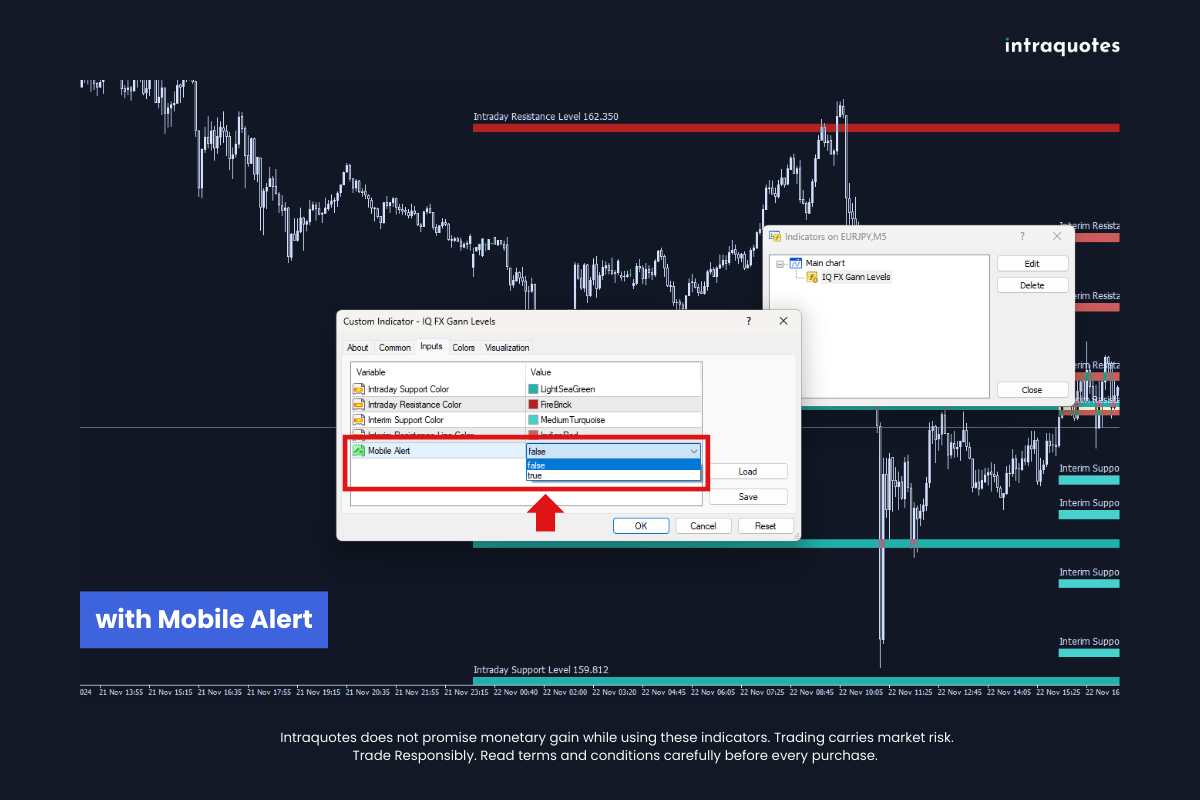
Indicator Settings:
- Intraday Support Color
- Intraday Resistance Color
- Interim Support Color
- Interim Resistance Color
- Mobile Alert (True/False)
Note for Mobile Alert: To receive mobile alerts for this indicator, enable push notifications in MetaTrader 4 by pressing Ctrl + O (or accessing Options) and navigating to the Notifications tab. Enter your MetaQuotes ID from the MetaTrader app on your mobile device to link it with your platform. Once connected, test the setup to ensure alerts are working. If you face any issues, feel free to contact our support team for assistance.
Indicator Troubleshooting:
The indicator user guide covers all the topics comprehensively. User Guide will be sent to you once you contact us after a purchase.
Important Notes:
- Only one dashboard per chart is allowed.
- Service is unavailable in countries like India, Pakistan, and Bangladesh due to regulatory restrictions.
Risk Disclosure:
Trading involves risk. The developer is not responsible for any losses incurred. Past performance is not indicative of future results. Use this indicator responsibly.
Support & Updates:
- For assistance, send us a direct message on MQL5.
- Follow our channel for updates and market insights.
Related topic: WD Gann, trend, trade levels, support, resistance, market movement, intraday levels, intraday trading, scalping, hedging, etc.