Price Action Candlestick Patterns
- 지표
- Davit Beridze
- 버전: 1.10
- 업데이트됨: 11 7월 2024
- 활성화: 5
MetaTrader 4 (MT4)용 캔들스틱 패턴 지표
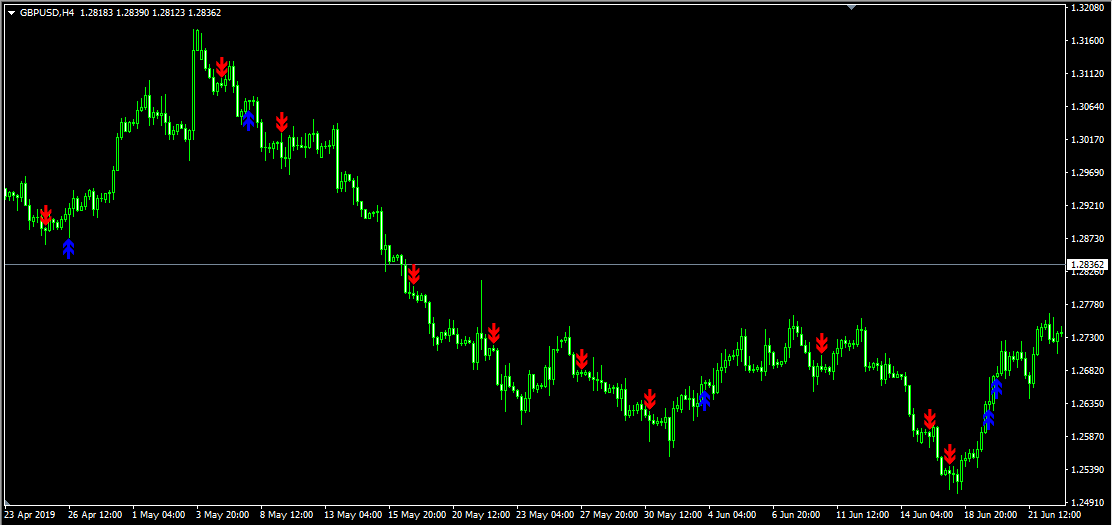
이 맞춤형 지표는 주요 상승 및 하락 캔들스틱 패턴을 식별하여 트레이더가 기술 분석과 의사 결정을 내릴 수 있도록 돕습니다.
주요 기능:
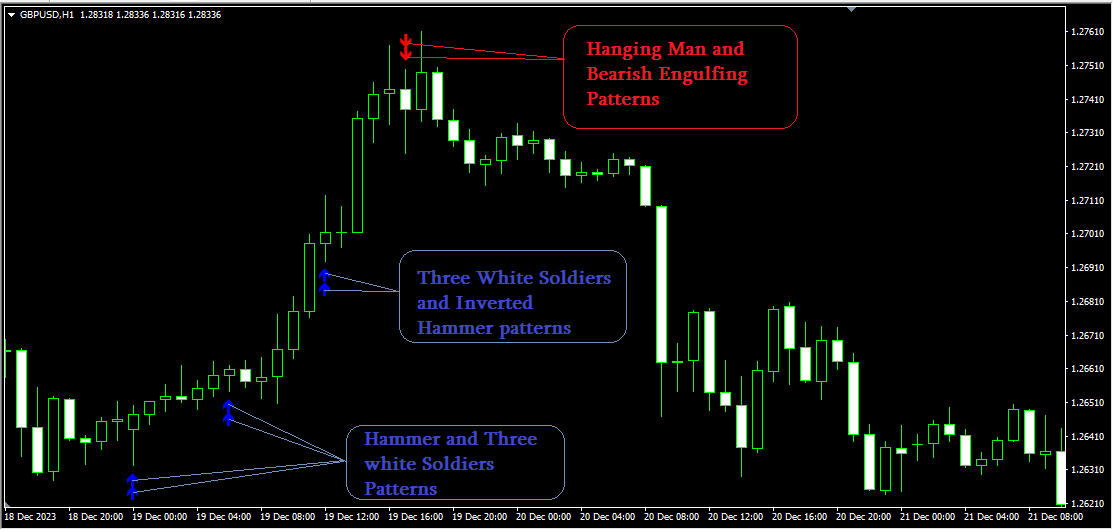
- 패턴 감지:
- 상승: 망치형, 상승 장악형, 샛별형, 세 개의 흰 병사, 상승 하라미, 역망치형.
- 하락: 유성형, 하락 장악형, 석별형, 세 개의 검은 까마귀, 하락 하라미, 교수형.
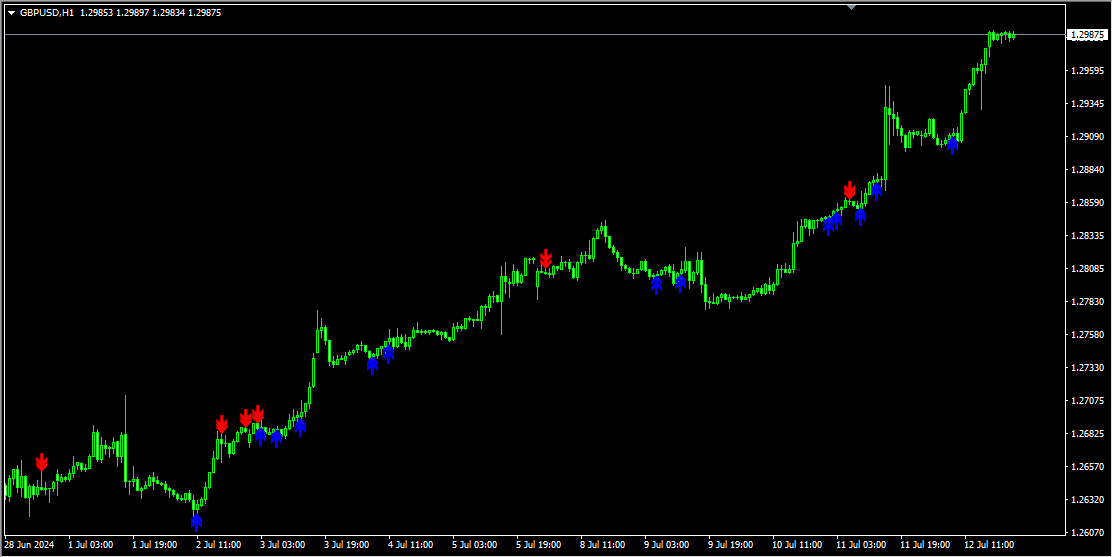
- 맞춤 설정: 전략에 따라 특정 패턴을 활성화 또는 비활성화할 수 있습니다. 화살표로 패턴을 표시하며(상승은 파란색, 하락은 빨간색), 크기와 간격을 조정할 수 있습니다.
- 이동 평균선(MA) 통합: 선택적으로 이동 평균선을 차트에 표시할 수 있으며, 기간, 방법, 시간 프레임을 맞춤 설정할 수 있습니다.
- 알림 시스템: 감지된 패턴에 대해 화면 메시지, 소리, 푸시 알림, 이메일 알림을 제공합니다.
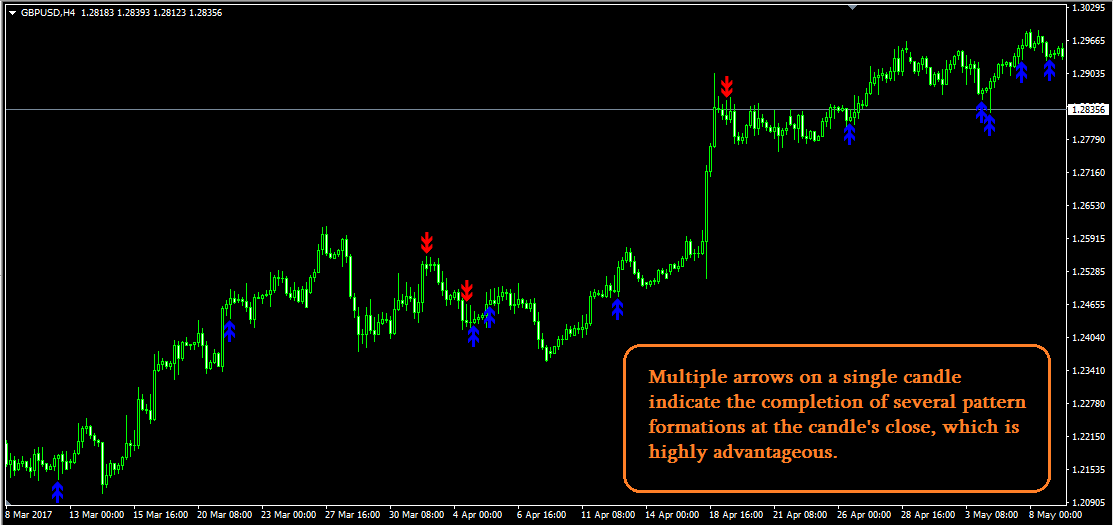
다중 패턴 감지:
- 수렴: 하나의 캔들에 여러 패턴을 표시하여 더 강한 신호를 제공합니다.
- 상승 수렴: 여러 파란 화살표는 더 강한 상승 신호를 나타냅니다.
- 하락 수렴: 여러 빨간 화살표는 더 강한 하락 신호를 나타냅니다.
- 혼합 패턴: 상승과 하락 패턴이 동시에 나타나면 시장의 불확실성을 의미합니다.
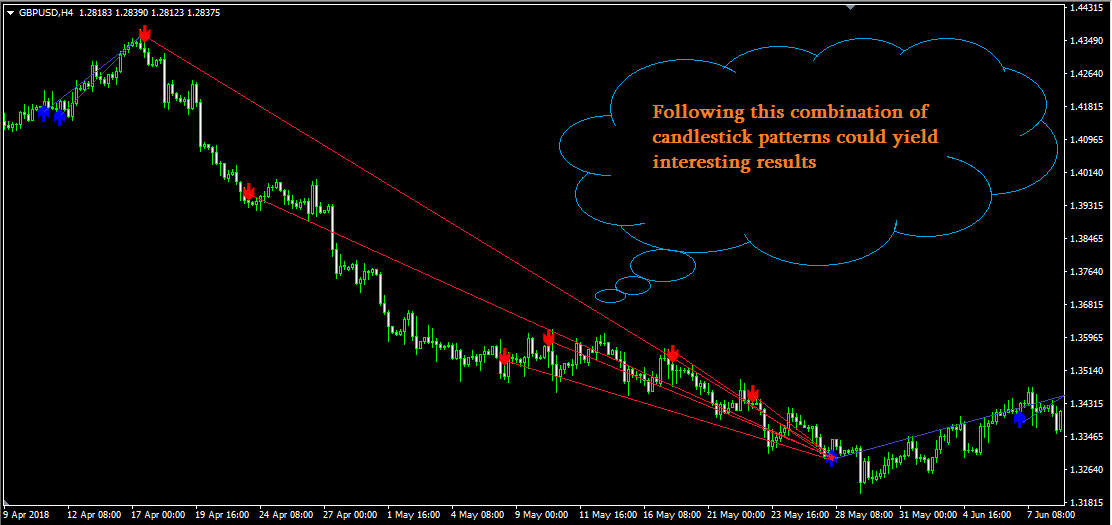
이 지표는 시장 반전 및 추세 지속을 명확하게 시각적으로 표현하여 트레이딩 성과를 향상시키는 데 도움을 줍니다.


HI i already have some tools for candle patterns but i read the reviews and was interested. after a response of the seller i decide to give a chance and i am the one who is lucky because it is excellent and accurate especially on quick time frame where i trade. The seller answer quickly. very good even excellent tool which give the parameters to see arrow where we want. Well done. i have 2 tools of Davit and they are good and at a nice price. Thank you.