MultiSymbol and TF Chart Integrated
- 지표
- Martin Alejandro Bamonte
- 버전: 1.0
- 활성화: 10
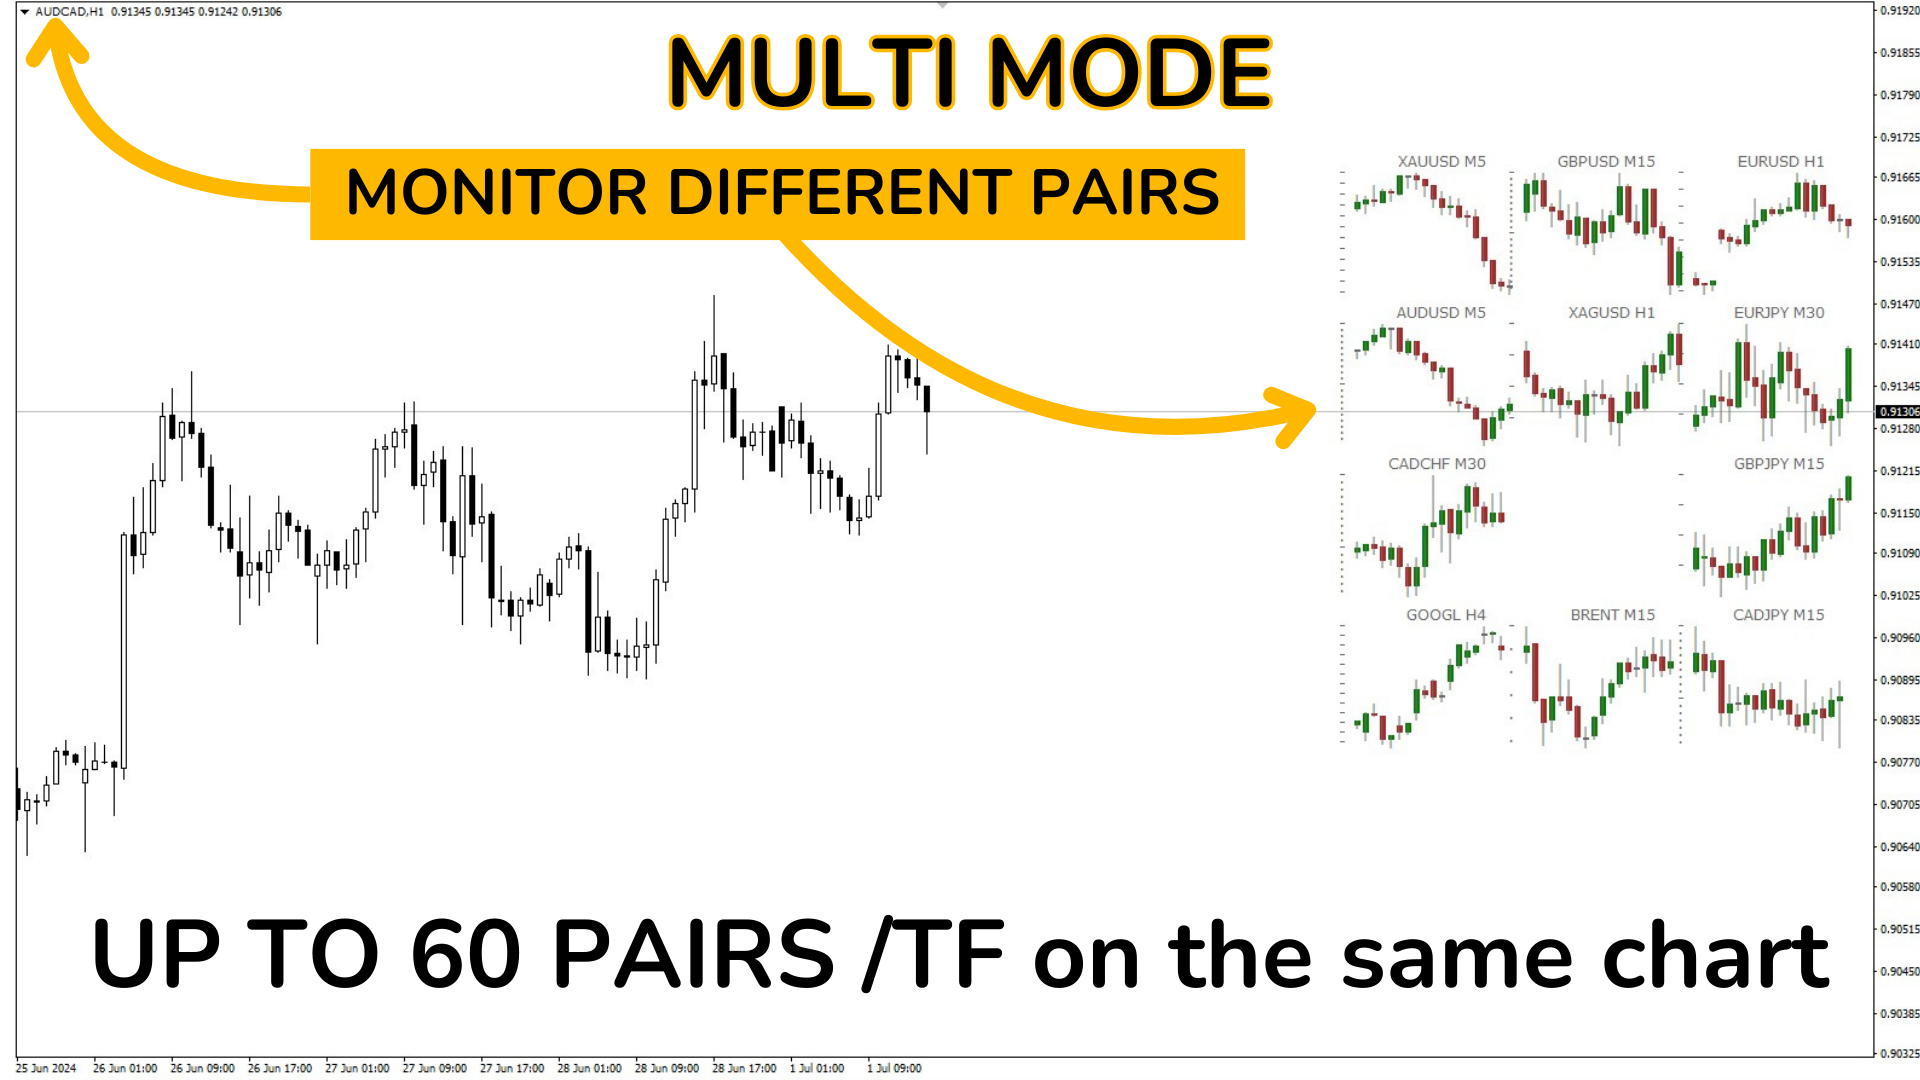
"MultiSymbol & TF Chart Integrated" 지표는 단일 차트(다중 모드)에서 최대 60개의 통화 쌍을 선호하는 시간대에 따라 모니터링하거나 모든 TF에서 거래 중인 통화 쌍을 볼 수 있도록 빠르게 포괄적인 시장 전망을 제공하도록 설계되었습니다(단순 모드).
주요 장점:
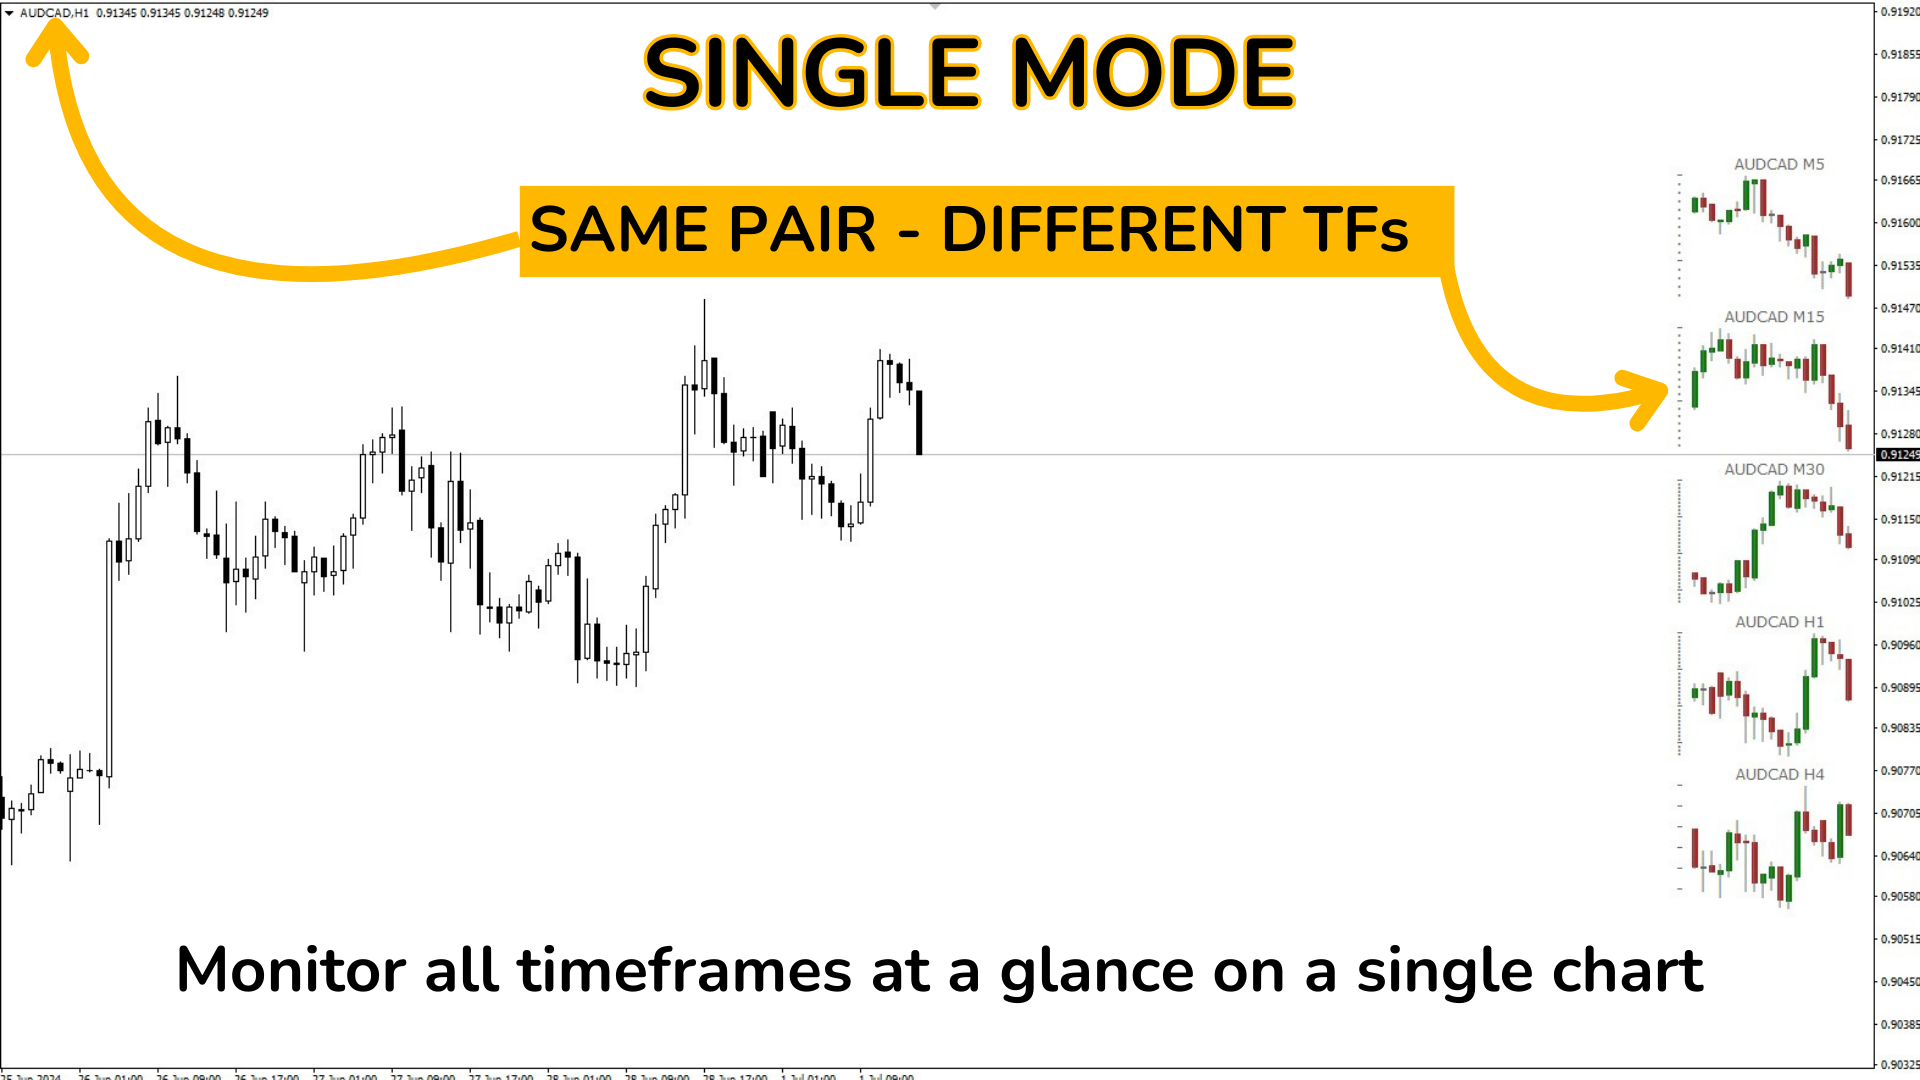
완전 모니터링: 단일 차트에서 모든 원하는 쌍을 한 눈에 실시간으로 모니터링할 수 있습니다.
시간 절약: 차트 간 전환 필요 없이 각 쌍의 행동을 실시간으로 확인할 수 있습니다.
추세 분석: 추세를 따르는 트레이더에게 적합하며, 결정하기 전에 추세를 확인하기 위해 상위 시간대를 볼 수 있습니다.
극한 사용자 정의: 지표의 모든 측면을 특정 요구에 맞게 조정합니다.
극한 사용자 정의:
높은 구성 가능성 지표 매개변수:
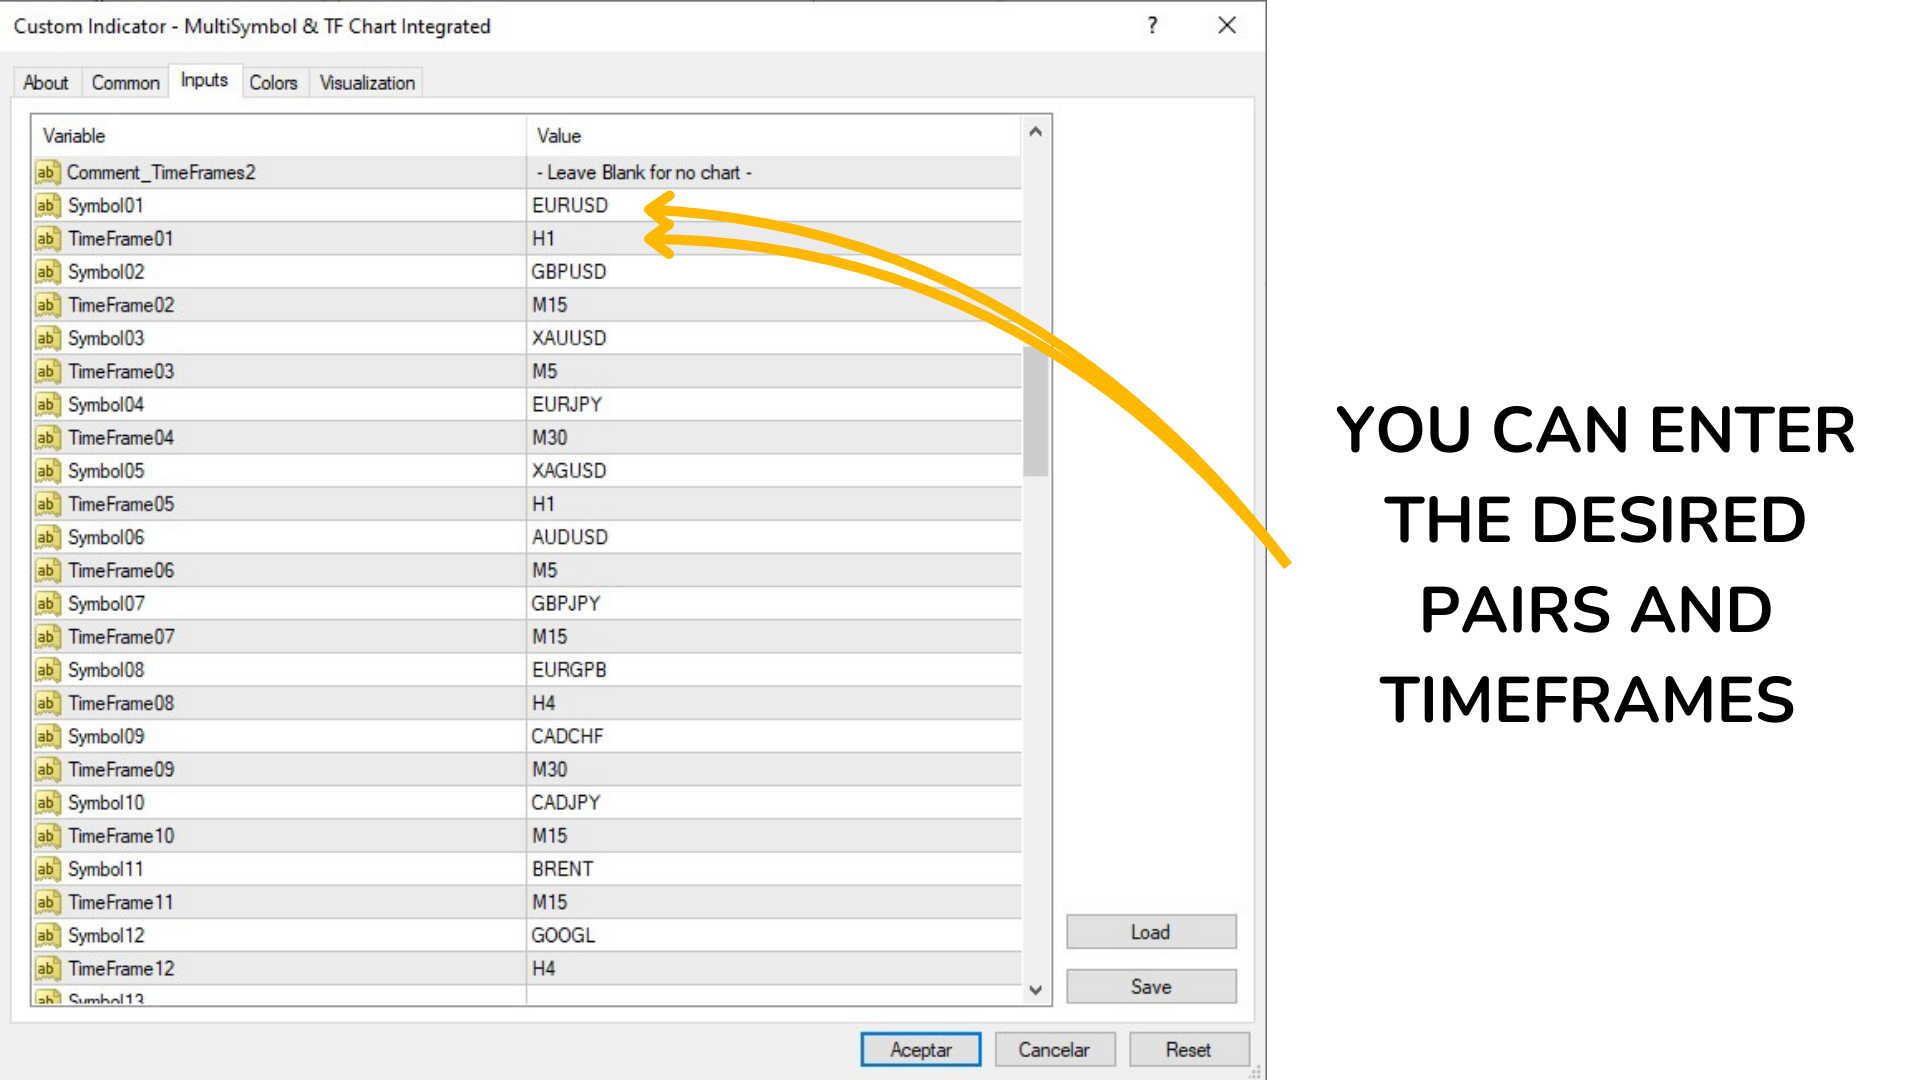
심볼 및 시간대:
- 최대 60개의 다른 심볼을 구성할 수 있습니다.
- 각 심볼은 고유한 시간대를 가질 수 있습니다(예: M1, M5, M15, M30, H1, H4, D1, W1, MN1).
표시 모드:
- 단순 모드: 특정 시간대로 단일 차트를 구성합니다.
- 다중 모드: 다양한 심볼과 시간대로 여러 차트를 구성합니다.
색상 구성:
- 상승 및 하락 캔들의 사용자 정의 가능한 색상.
- 캔들 심지의 색상.
- 가격 눈금의 색상.
스케일링 및 위치 지정:
- 가격 범위 및 ATR을 기반으로 차트 자동 스케일링.
- 픽셀 매개변수를 사용하여 차트 위치 지정.
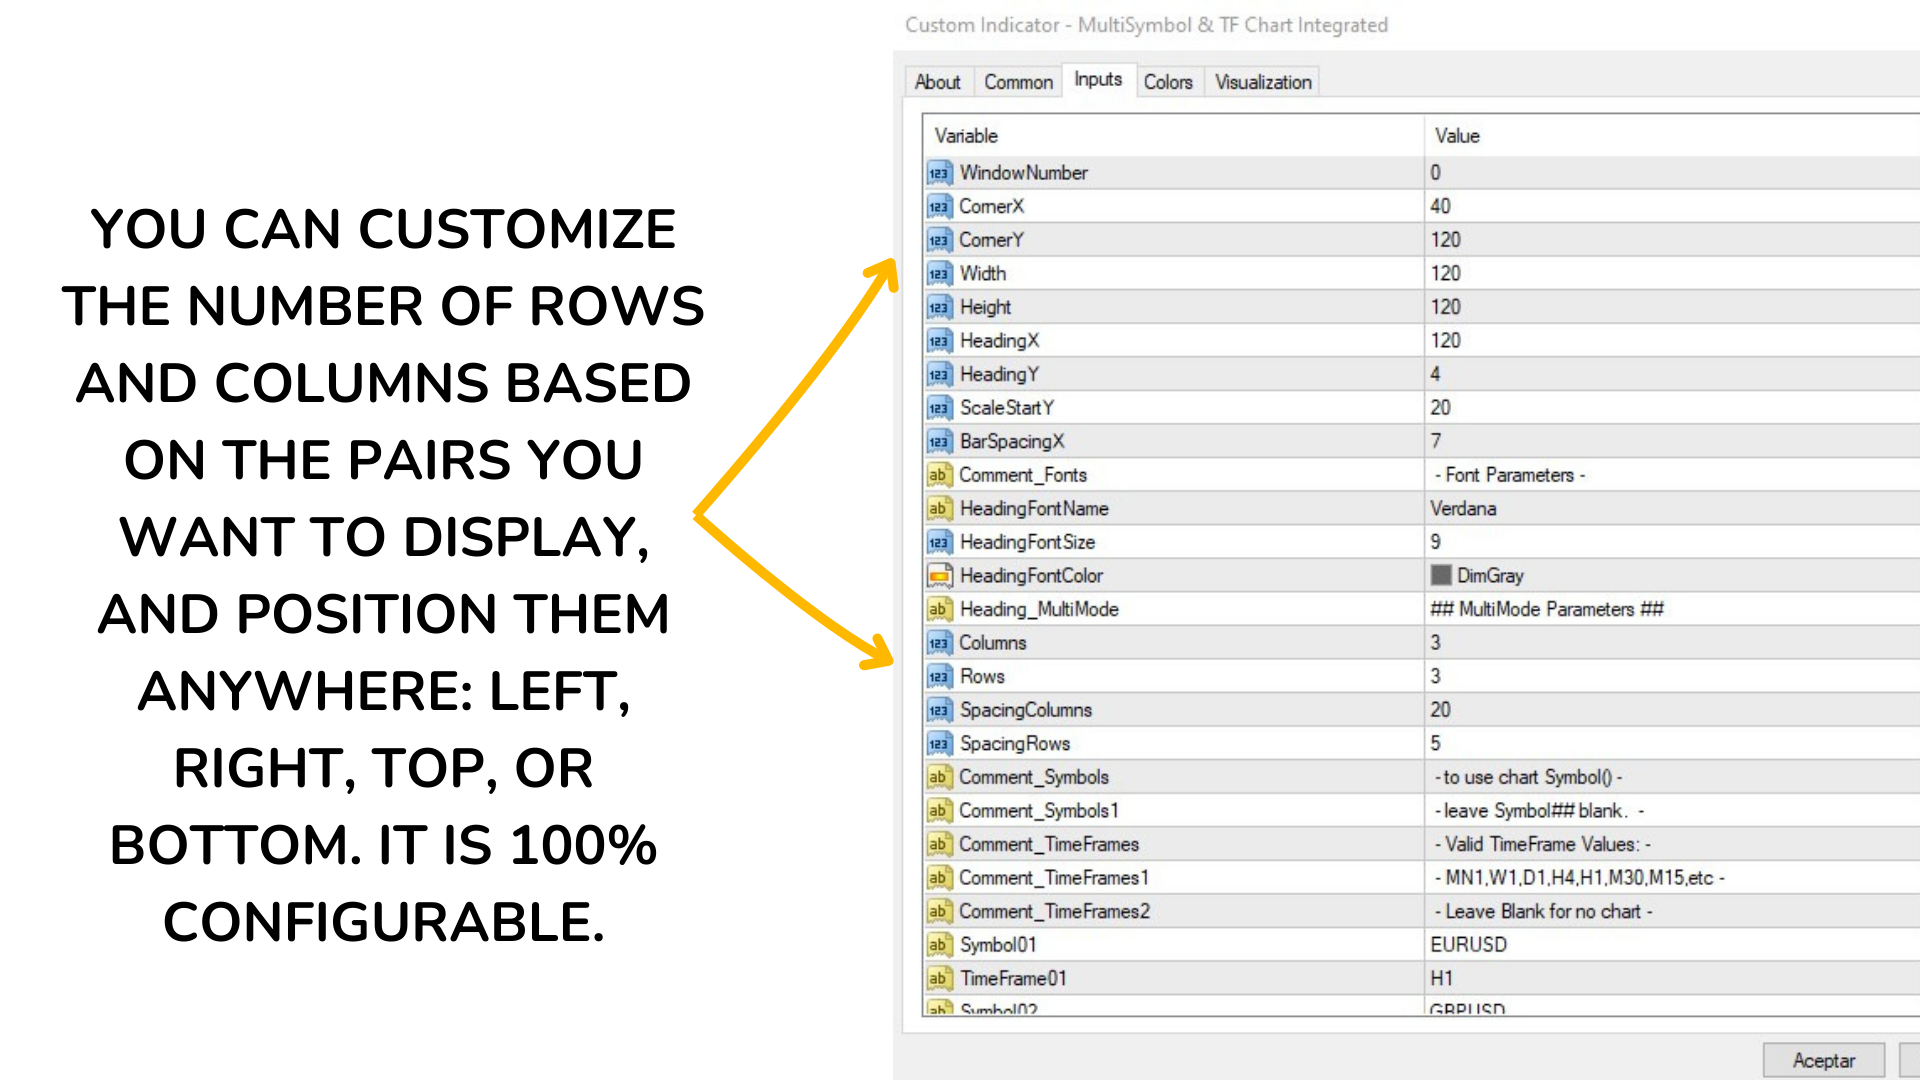
- 차트 레이아웃의 행 수 및 열 수.
- 열과 행 사이의 간격.
- 차트 창의 초기 위치(X, Y).
- 픽셀 단위의 차트 크기(너비 및 높이).
글꼴 구성:
- 제목 및 라벨의 글꼴 이름 및 크기.
- 제목의 글꼴 색상.
바 구성:
- 각 차트에 표시할 바의 수.
- 바 사이의 픽셀 거리.
"MultiSymbol & TF Chart Integrated" 지표는 원하는 모든 쌍을 빠르게 확인하고 전략에 가장 적합한 쌍을 거래하기 위해 시간을 최대화하려는 모든 트레이더에게 필수 도구입니다. 높은 사용자 정의 및 사용 편의성으로 인해 모든 수준의 트레이더에게 이상적인 선택입니다.
가이드를 사용하여 특정 요구에 맞게 매개변수를 조정하십시오:
지표 외부 매개변수의 자세한 설명:
단순 모드
Heading_SingleMode: ## 단순 모드 매개변수 ##
설명: 단순 모드 매개변수의 제목(단일 차트).
Comment_TimeFrame: - MN1,W1,D1,H4,H1,M30,M15,등 -
설명: 유효한 시간대를 나타내는 주석.
TimeFrame: H4
설명: 단순 모드에서 차트의 시간대를 정의합니다. MN1(월간), W1(주간), D1(일간), H4(4시간) 등의 값을 사용할 수 있습니다.
Comment_Corner: - TopLeft=0,TR=1,BL=2,BR=3 -
설명: 창 내 차트 위치 값을 설명하는 주석.
Corner: 1
설명: 차트가 배치될 창의 모퉁이를 정의합니다. 가능한 값: 0(왼쪽 상단 모퉁이), 1(오른쪽 상단 모퉁이), 2(왼쪽 하단 모퉁이), 3(오른쪽 하단 모퉁이).
다중 모드
Heading_ChartParam: ## 차트 매개변수 ##
설명: 다중 모드 매개변수의 제목(여러 차트).
MultiMode: true
설명: 다중 모드를 활성화(true) 또는 비활성화(false)합니다.
CandleMode: false
설명: 캔들(true) 또는 바(false)를 표시할지를 정의합니다.
BarsToDisplay: 18
설명: 각 차트에 표시할 바 또는 캔들의 수.
AutoScale: true
설명: 가격 범위 및 ATR(평균 실제 범위)을 기반으로 차트의 자동 스케일링을 활성화(true) 또는 비활성화(false)합니다.
ATRBars: 20
설명: ATR 계산에 고려할 바의 수.
ATRPixelsY: 30
설명: 스케일링을 위해 ATR에 할당된 수직 픽셀 수.
색상 구성
WickColor: DimGray
설명: 캔들 심지의 색상.
BullBarColor: Green
설명: 상승 캔들 또는 바의 색상.
BearBarColor: FireBrick
설명: 하락 캔들 또는 바의 색상.
ScaleColor: DimGray
설명: 가격 눈금의 색상.
위치 지정
Comment_Positioning: - 위치 지정(픽셀 단위) -
설명: 다음 매개변수가 픽셀 단위 위치 지정용임을 나타내는 주석.
WindowNumber: 0
설명: 차트가 표시될 창 번호. 일반적으로 0은 메인 창입니다.
CornerX: 40
설명: 픽셀 단위의 차트 초기 X 위치.
CornerY: 120
설명: 픽셀 단위의 차트 초기 Y 위치.
Width: 120
설명: 픽셀 단위의 차트 너비.
Height: 120
설명: 픽셀 단위의 차트 높이.
글꼴 구성
HeadingFontName: Verdana
설명: 제목 및 라벨에 사용되는 글꼴 이름.
HeadingFontSize: 9
설명: 제목 및 라벨의 글꼴 크기.
HeadingFontColor: DimGray
설명: 제목의 글꼴 색상.
다중 모드 구성
Heading_MultiMode: ## 다중 모드 매개변수 ##
설명: 다중 모드의 특정 매개변수에 대한 제목.
Columns: 3
설명: 차트의 열 수.
Rows: 3
설명: 차트의 행 수.
SpacingColumns: 20
설명: 차트 열 사이의 픽셀 간격.
SpacingRows: 5
설명: 차트 행 사이의 픽셀 간격.
심볼 및 시간대(총 60개)
Symbol01: EURUSD
설명: 첫 번째 차트의 심볼. 최대 60개의 다른 심볼을 구성할 수 있습니다.
TimeFrame01: H1
설명: 첫 번째 차트의 시간대. 각 심볼은 고유한 시간대를 가질 수 있습니다.
이 매개변수는 Symbol60과 TimeFrame60까지 반복되며, 기본적으로 비어 있으며, 각 트레이더는 자신의 요구에 따라 이를 구성할 수 있습니다.
"MultiSymbol & TF Chart Integrated" 지표는 매우 구성 가능하며, 단일 차트에서 여러 심볼과 시간대의 표시를 완전히 사용자 정의할 수 있어 기술 분석을 용이하게 하고 의사 결정 효율성을 높여줍니다.