Swing breakout sequence SBS with Stoic trader MT5
- 지표
- Minh Truong Pham
- 버전: 2.1
- 업데이트됨: 10 10월 2024
- 활성화: 5
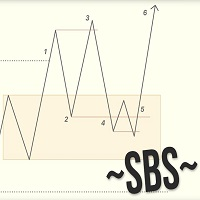
Swing Breakout Sequence | SBS presents a comprehensive trading strategy designed to help traders identify and capitalize on market swings and breakouts. The Swing Breakout Sequence (SBS) strategy is built around a series of well-defined steps to optimize trading decisions and improve profitability.
Version 2.01:
Add "golden entry" - entry by fib.
Stoic added to it (fibo) he calls this setup gold SBS here is the video
the description of the setup starts at 18min24sec
Version 2:
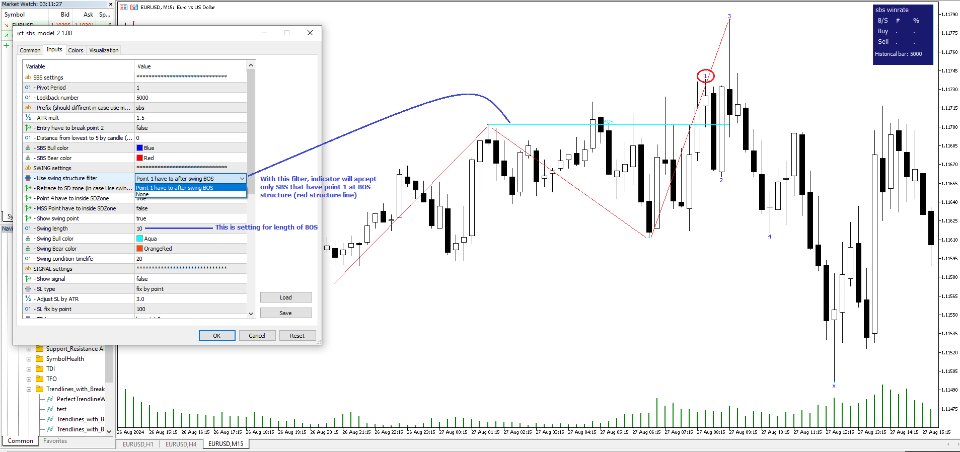
+ Add BOS filter . Detail in figure 3
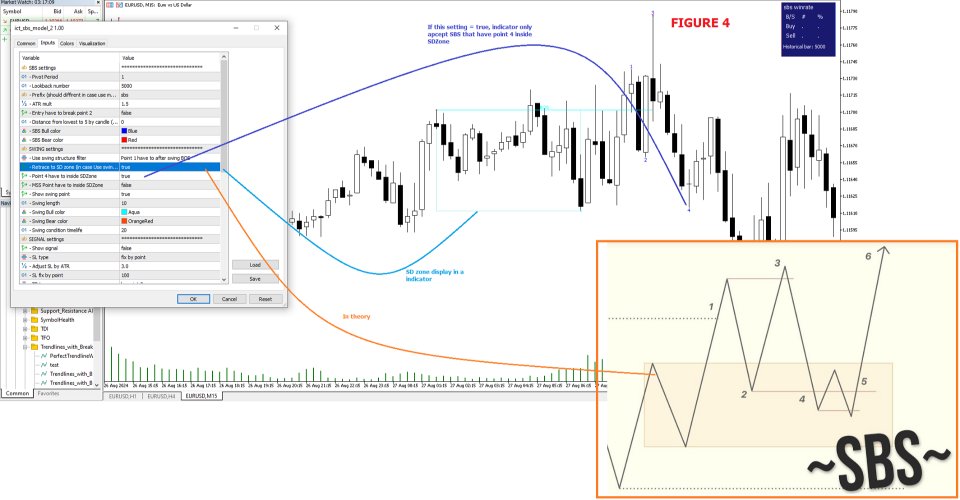
+ Add SD zone filter. Detail in figure 4
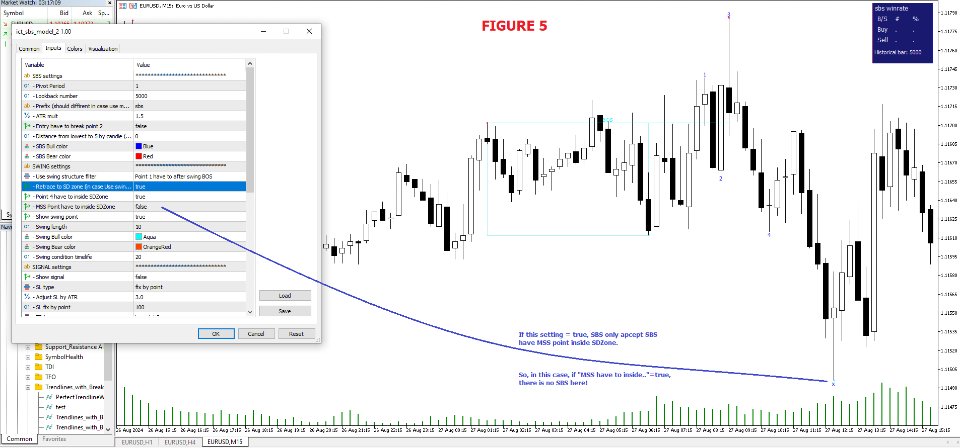
+ Filter MSS point have to inside SDZone . Detail in figure 5
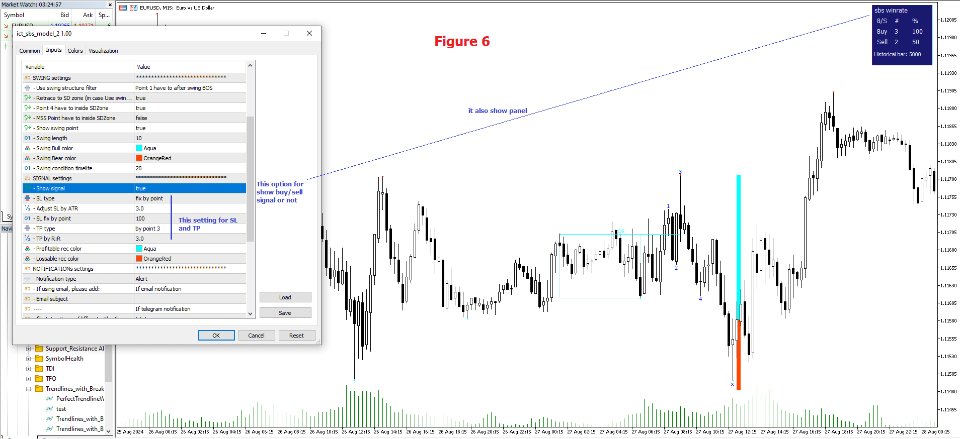
+ Setting for show buy/sell signal and statistic panel. Detail in figure 6
With SL, we have 3 mode:
1. Fix by point
2. At MSS point of SBS
3. By ATR. If choose this one, you have to set value for "Adjust SL by ATR" = xxx also. Then SL = SL = ATR*xxx
Note that if we choose (2) At MSS point of SBS, we also can set "Adjust SL by ATR" = 2 . If this, indicator will check if |entry - sl| < ATR * 2 , indicator will set SL = ATR*2
With TP we have 2 mode:
1. By point 3 of SBS
2. By R:R
/==============================================================================================================================/
In version 1.3 I added important functions to increase winrate (although it may reduce the number of recognized models). These are:
1. Add pre-condition filter with following option:
+ Have to BOS
+ Have to MSS
+ None
2. Separate length of pre-condition with length of SBS pivot point
/==============================================================================================================================/
Key Components of the SBS Strategy:
- Breakout Identification:
- The initial step involves identifying potential breakouts in the market. This is a crucial phase where traders look for key levels where the price is likely to break out from a range or pattern.
- First Tap:
- After the breakout, the price often returns to test the breakout level. This "first tap" is an opportunity for traders to enter the market with a confirmation that the breakout level holds as new support or resistance.
- Quick Scalp:
- This step focuses on taking advantage of the immediate price movement following the breakout or first tap. Quick scalping allows traders to secure small, fast profits, which can accumulate over time.
- Return to Liquidate FT:
- Here, the price returns to the breakout level again, offering another chance to either enter or exit trades, depending on the trader's strategy and market conditions.
- Double Bottom Reversal:
- This involves recognizing a double bottom pattern, a strong reversal signal, indicating that the price is likely to move upwards after testing a support level twice.
- Target New Swing Highs or Lows:
- The final step targets new swing highs or lows, capitalizing on the momentum generated from the breakout and subsequent market movements .
Key Principles:
- Understanding Order Flow:
- The concept of order flow is central to the SBS strategy. It involves analyzing price action and market structure to predict future price movements, rather than relying on external factors like news or time of day.
- Market Dynamics and Psychology:
- Recognizing the influence of trader psychology, including fear and greed, is crucial. Large institutional players and central banks can / always manipulate market prices, and traders must be aware of these dynamics to navigate the market effectively.
- Chart Patterns and Trading Sequences:
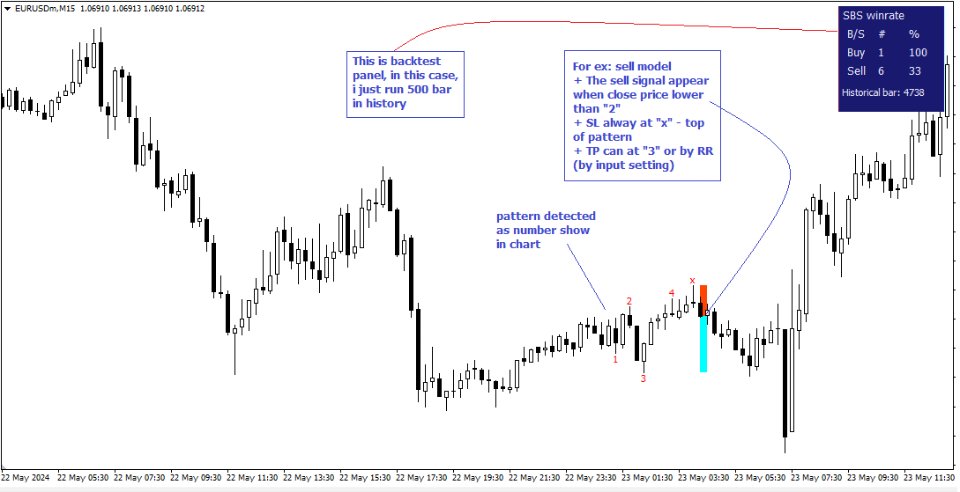
- Identifying and practicing various chart patterns and trading sequences are essential for building confidence and achieving consistent profitability. Our SBS indicator helps to automatically recognize SBS patterns and more advance, we provice backtesting based on historical bars.
Empowerment for Traders:
The SBS strategy aims to empower traders to become independent and confident in their trading decisions. It stresses the importance of developing a personalized trading plan, mastering a specific trading model, and executing trades decisively. By focusing on these principles, traders can achieve consistent profitability without relying on external guidance from trading gurus.
Indicator settings:
+ Pivot length: It is the length in bars on both sides (left, right) to determine a peak (top/bottom) point on the chart.
+ Lookback number: The historical bar calculated at first time run. If =0, indicator will run whole historical bar (good for backtest result, but will be affected in performance)
+ Prefix: Used to distinguish different settings of sbs indicator on the same chart.
For example, you want to install 2 sbs indicators on the same EU chart in M5 frame, the first one set pivot period=1, the other one set pivot period=5. You set the prefix as follows:
- sbs_p1 for the first setting
- sbs_p5 for the other setting
+ TP type: type of take profit
+ Display settings
+ Panel settings
+ Notification settings
Notes:
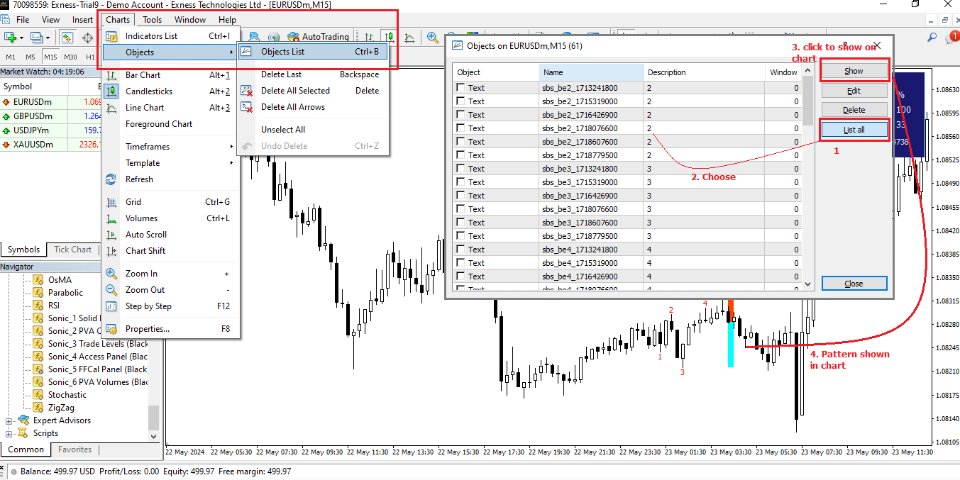
Remember that the above pattern does not occur often, so it is normal that the first time you run it, you do not see any change on the chart in the current view. That means that there is no SBS pattern in the current view, not that the indicator is not working.
+ You can check the previous patterns by opening the "Object List" tool of MT terminator (use the shortcut Ctl+B), click on "List all" to display all objects. Click on an object with the prefix you set or the default is "sbs". Finally, click the "Show" button, you will see the SBS pattern displayed on the chart.
+ Another way is that you can run a backtest to see how effectively the indicator works.
HOW TO BUILD A SIGNAL SCANNING SYSTEM:
To use this indicator effectively, build a signal scanning system as follows:
+ With 1 symbol, open each timeframe you are interested in on each different chart.
+ With each opened chart, attach multiple SBSs, each SBS for a different setting (usually different pivot period settings will give both short-term and long-term models)
+ Set a prefix that is easy to remember. For example, "m1_p3" means that the indicator is responsible for scanning on the M1 chart with pivot period = 3.
Thus, you have built a scanning system. Whenever there is a signal, the indicator will alert you via the notifications system. You have many different notification options such as via MT Alert, via email, telegram (need addition my free service), or MT5 mobile app
Frequently Asked Questions
Why nothing show on chart when i load inidicator?
https://www.youtube.com/watch?v=hW-KHHvUCWI
How i build signal scan system with this indicator?
Template and video avaiable here
