Jabidabi Bias
- 지표
- Attila Csenge
- 버전: 1.4
- 활성화: 15
Indicator Description
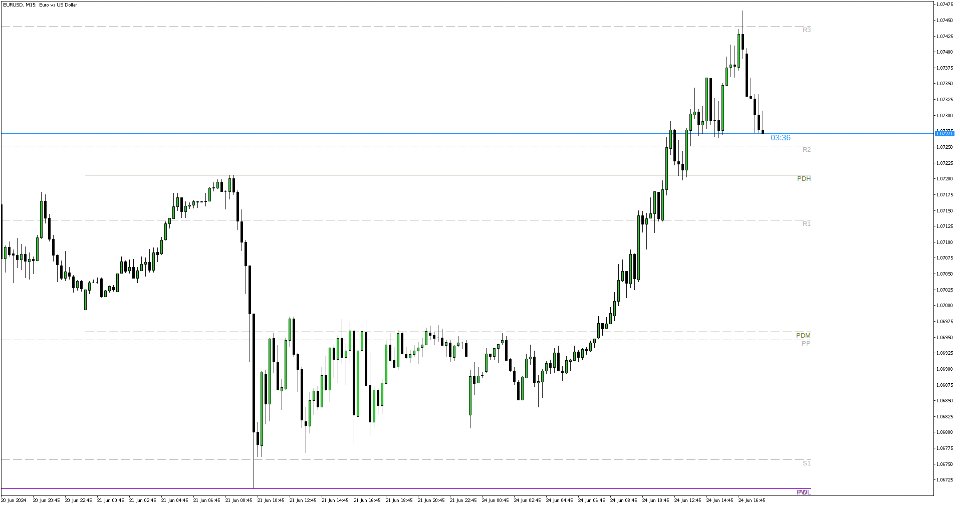
This indicator displays the highest and lowest prices for the previous day, week, and month. Additionally, it shows pivot levels calculated using different methods: Standard, Fibonacci, Woodie, Camarilla, and Floor pivots.
Features:
- Previous Day High/Low: Indicates the highest and lowest prices of the previous trading day.
- Previous Week High/Low: Indicates the highest and lowest prices of the previous trading week.
- Previous Month High/Low: Indicates the highest and lowest prices of the previous trading month.
- Pivot Levels:
- Standard Pivots.
- Fibonacci Pivots.
- Woodie Pivots.
- Camarilla Pivots.
- Floor Pivots.
To use this indicator, simply add your preferred entry method, backtest the strategy, and start trading.
If you have any observations or suggestions, feel free to let me know and i will address them.


