Power of 3 ICT Series
- 지표
- Juan Pablo Castro Forero
- 버전: 1.2
- 업데이트됨: 6 8월 2024
- 활성화: 20
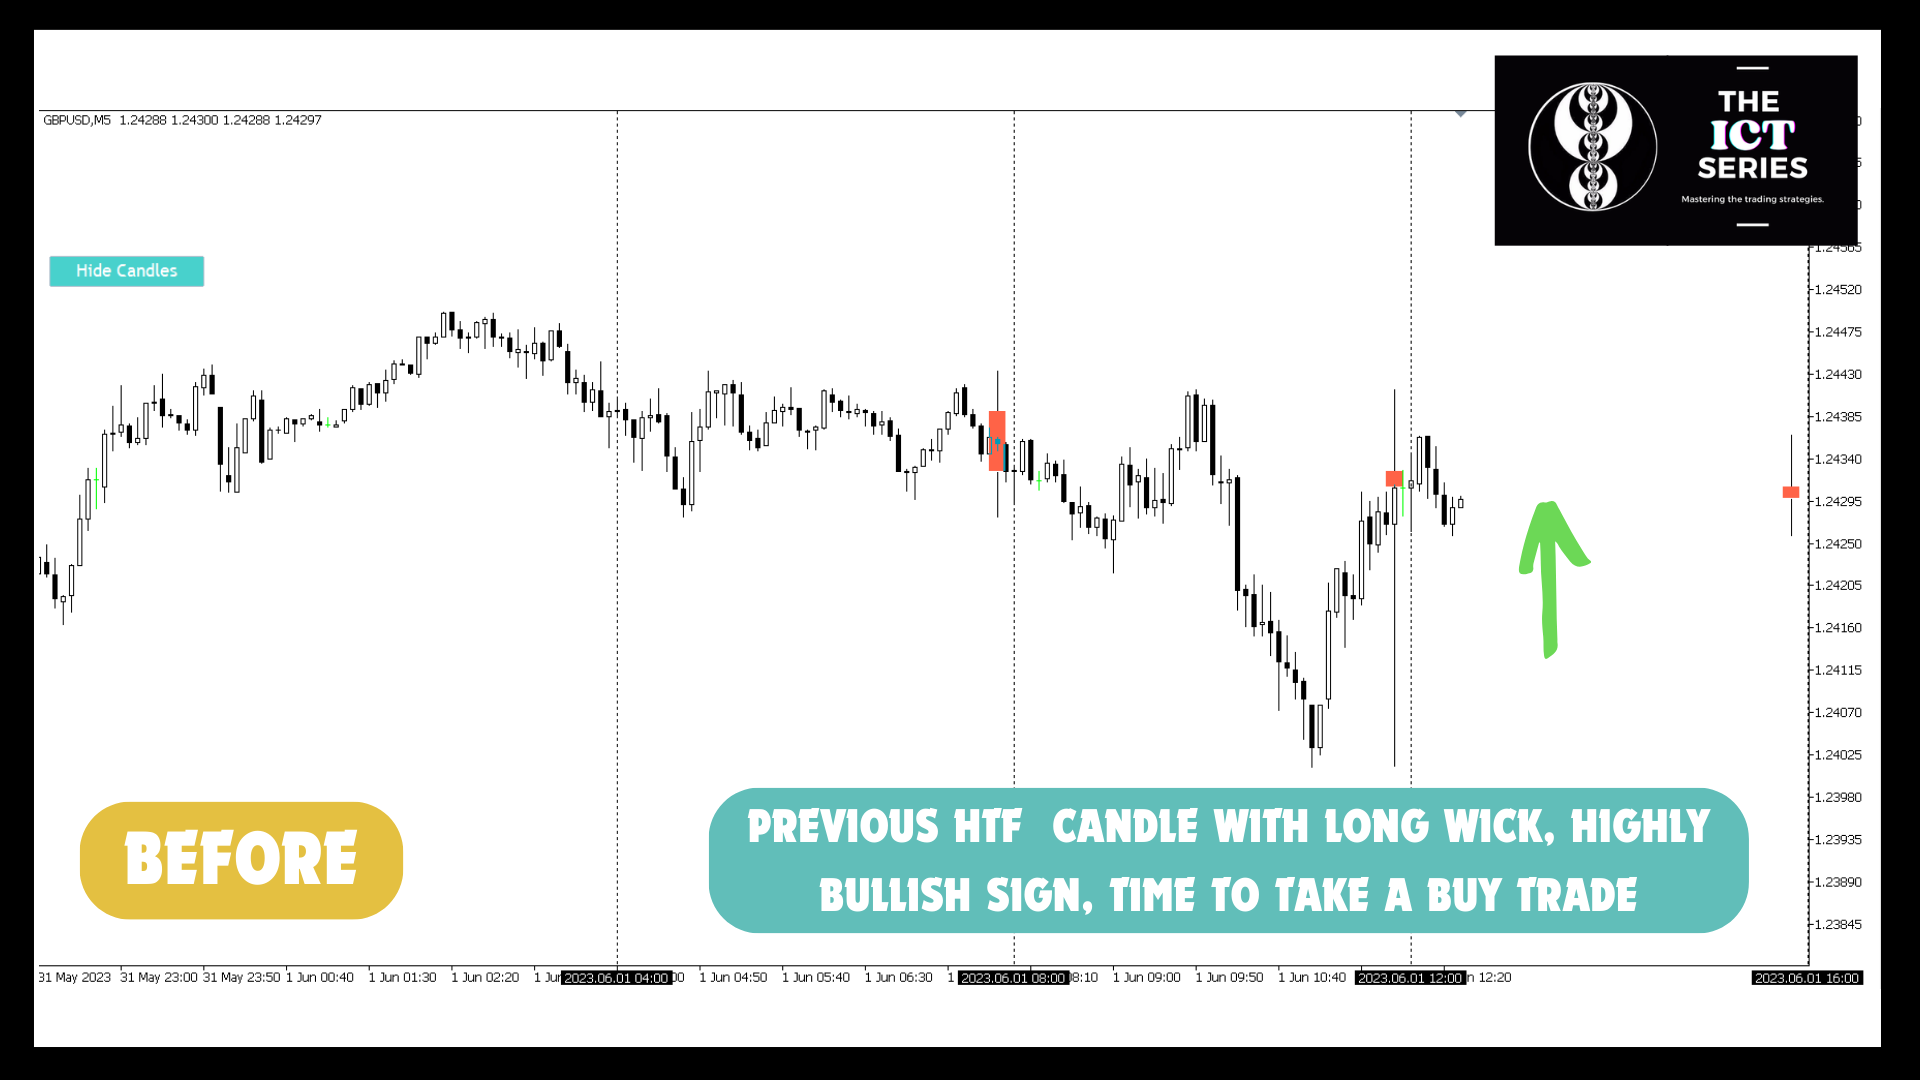
<p><b>The Power of 3 ICT</b> 는 낮은 타임프레임에서 거래할 때 HTF를 모니터링하는 데 도움이 되는 최고의 도구입니다. 이 지표는 LTF 차트에서 최대 2개의 다른 HTF 캔들을 볼 수 있게 해주므로 현재 가격 움직임이 더 높은 타임프레임에서 어떻게 보이는지 항상 알 수 있으며, 더 높은 타임프레임 트렌드를 따라 거래를 하는지 확인할 수 있습니다.</p>
<div class="atten">
<p><a href="https://www.mql5.com/en/blogs/post/758051" title="https://www.mql5.com/en/blogs/post/758051" target="_blank">이 지표를 사용하여 ICT/유동성 개념을 거래하는 방법은? </a></p>
</div>
<p> </p>
<h3>3의 힘으로 무엇을 할 수 있습니까?<br> </h3>
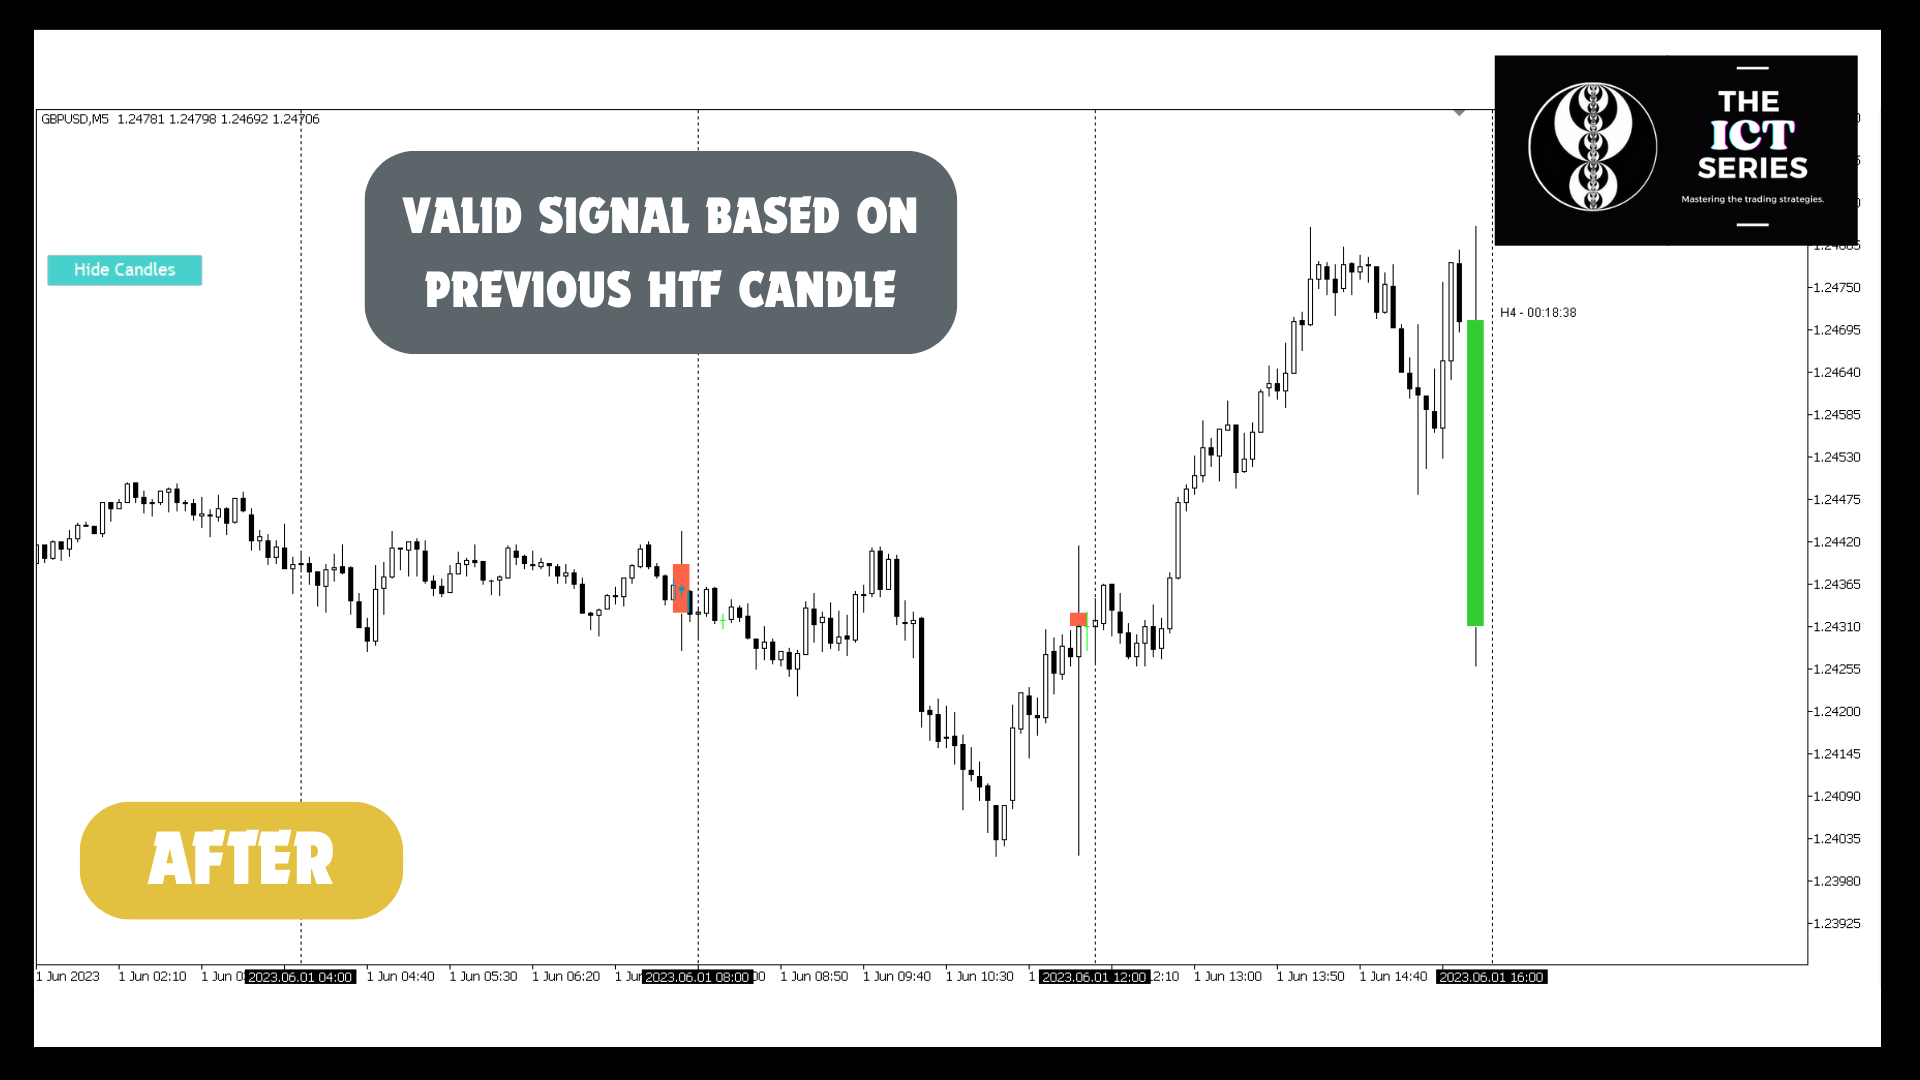
<p>더 높은 타임프레임의 현재 캔들을 보고 주요 트렌드를 쉽게 확인할 수 있습니다. 또한 원하는 만큼의 이전 캔들을 표시하여 HTF 트렌드를 쉽게 식별하고 그 트렌드에 따라 거래 아이디어를 정렬하는 데 도움이 됩니다. 추가로, 각 캔들의 시작과 끝을 결정하기 위해 수직선을 그릴 옵션이 있으며, 각 캔들이 어떻게 형성되었는지, 현재 캔들이 어떻게 형성될 가능성이 높은지, 그리고 어떤 방향으로 갈지 볼 수 있습니다.</p>
<p> </p>
<h3>왜 3의 힘을 사용해야 하나요?<br> </h3>
<p>이 지표를 유동성 지표와 같은 다른 지표와 함께 사용하면 간단하고 효과적인 전략을 가질 수 있으며 거래를 다음 수준으로 끌어올릴 수 있습니다. 유동성 지표의 도움으로 반응과 거래가 예상되는 유동성 영역을 찾을 수 있습니다. 이는 HTF 바이어스와 현재 캔들의 3의 힘과 일치하여 고확률 거래를 할 수 있는 모든 정보를 제공합니다.</p>
<p>뿐만 아니라, 지표에는 예측 모델이 있어 현재 캔들의 가능한 가격 형성 및 캔들의 고점과 저점이 발생할 가능성이 있는 시간을 표시하는 폴리라인을 볼 수 있습니다.</p>
<p> </p>
<h3>기타 기능 </h3>
<p></p>
<ul>
<li><span>캔들의 시작 및 종료 시간에 수직선.</span></li>
<li><span>캔들 시작 알림.</span></li>
<li><span>모든 과거 HTF 캔들을 깨끗한 방식으로 함께 플롯할 수 있는 가능성.</span></li>
</ul>
<p></p>
<p>추가로, 지표 사용을 쉽게 하기 위해 완전한 사용자 정의가 가능하며, 이를 통해 좋아하는 색상, 선 스타일, 레이블 이름 및 시간을 설정할 수 있습니다. 이렇게 하면 정말로 지표를 사용하고 자신만의 방식으로 거래를 즐길 수 있습니다. </p>
<p> </p>
<p> </p>
<p>이 지표는 여기에서 찾을 수 있는 ICT 시리즈의 일부입니다. 더 나은 결과를 보장하기 위해 다른 제품과 동시에 사용하세요. ICT 시리즈에서 보고 싶은 아이디어, 개념 또는 전략이 있으면 직접 메시지나 댓글로 보내주세요. 함께 개발하고 테스트하는 것을 기쁘게 생각하며, 통찰력, 전략 및 지원을 공유하는 거래자 커뮤니티에 가입하세요.</p>
<p>이 시리즈의 주요 초점은 Inner Circle Trader(ICT) 개념, 스마트 머니 개념, 기관 거래, 유동성 개념, 터틀 수프, IPDA, Wyckoff에 있습니다. 커뮤니티에 가입하세요.</p>
<p><br></p>
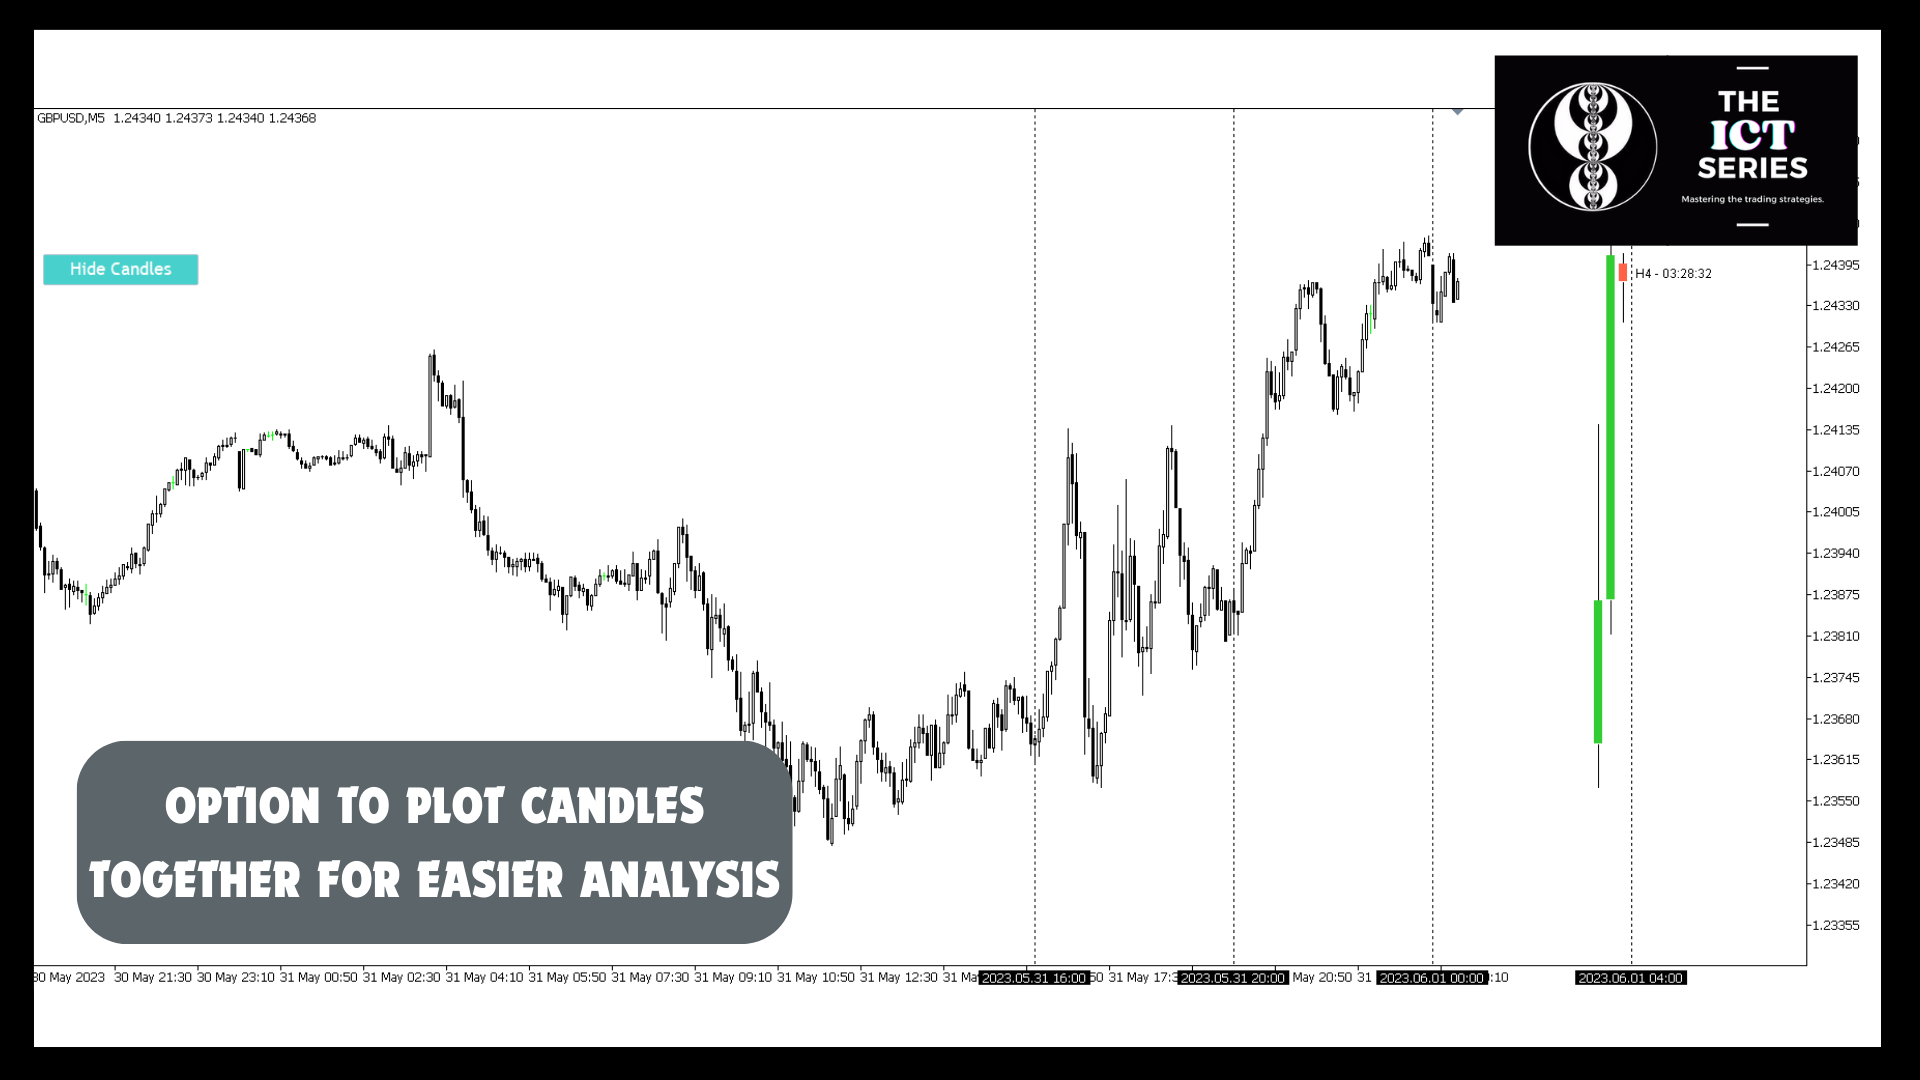
A very well designed indicator. It has many user configurable options. The Show/Hide feature is great. Juan is very prompt in responding and shows great commitment to adding new features that enhance the product. With this indicator ,it is very easy to visualize the Higher Time Frame activity .It brings more clarity to the analysis .The options to draw OHLC bars is excellent and is very rare.A very professionally designed Indicator.