• 미리보기
  • 리뷰
  • 코멘트

Price update indicator

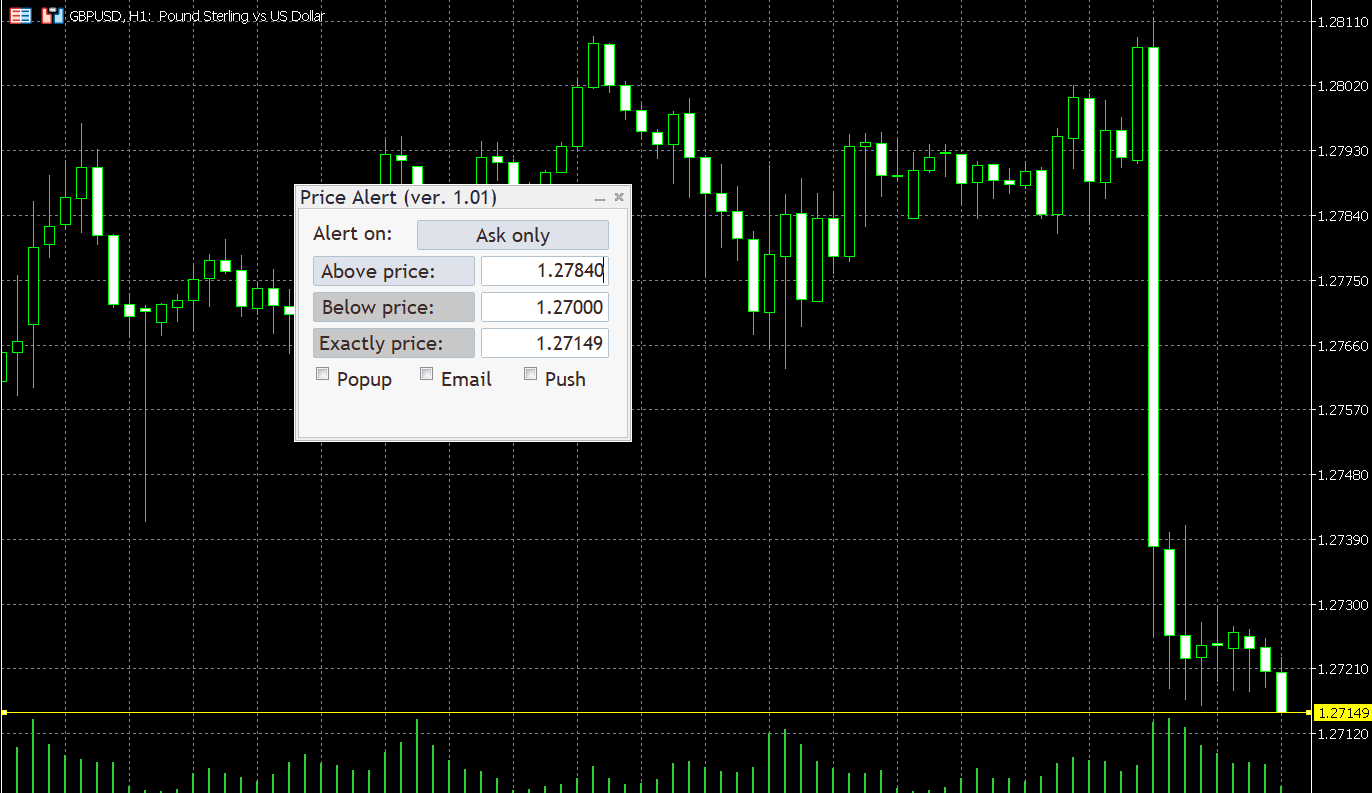
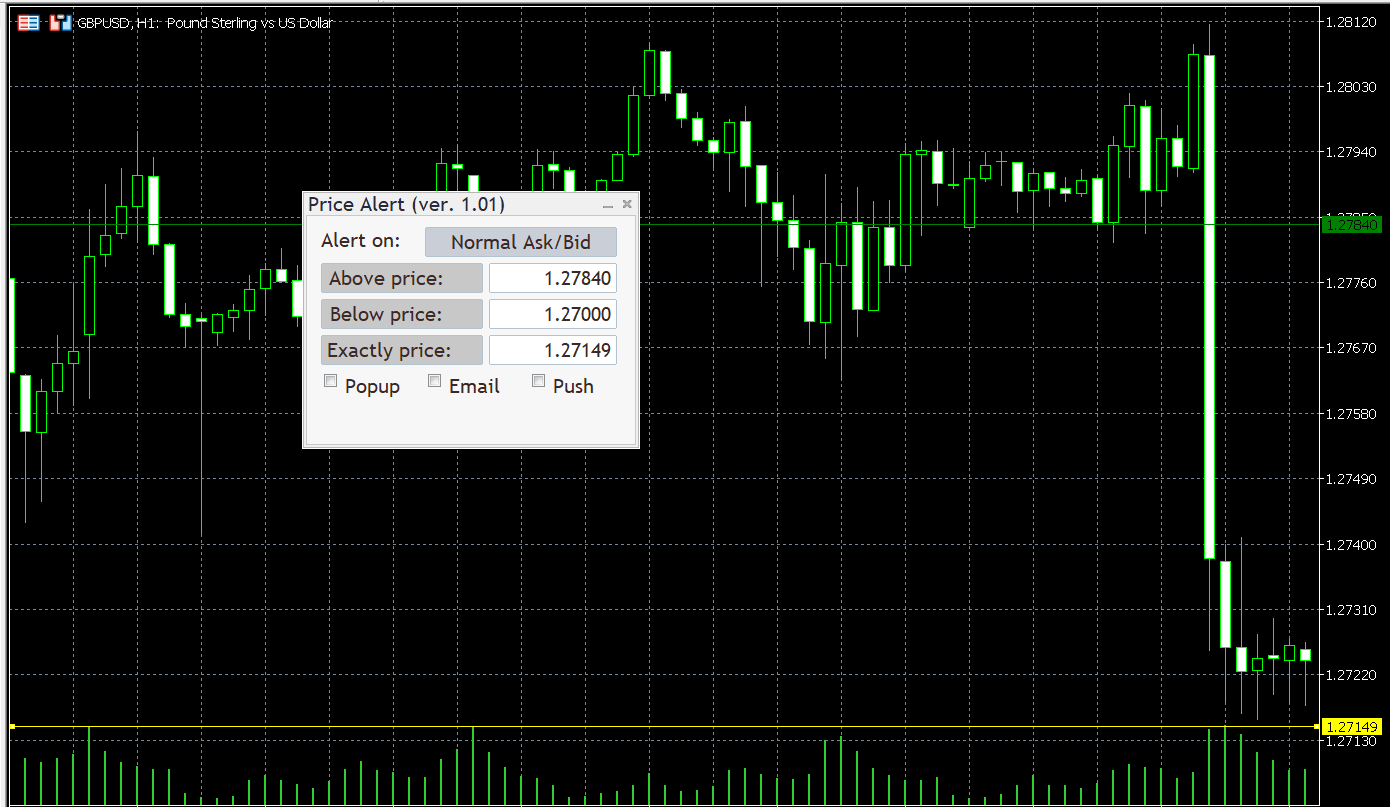
Price update  indicator — can issue any type of alert when the price reaches certain levels set by a trader. There are three types of price levels: the first one is used when the price rises above certain level (displayed with the green line on the chart), the second one is used when the price falls below certain level (displayed with the red line on the chart), and the third one is used when the price reaches the certain level exactly (displayed with the yellow line). Three alert types include: native (popup), email, and push-notification. For email and push-notification alert features to work, you need to set up the email or MetaQuotes ID settings in your MetaTrader platform options window. The indicator is available for both  MT5.

The indicator is equipped with a control panel that lets you quickly set alert price, levels, and types.

Input parameters

Main

  • PriceGoesAbove (default = 0.0) — if price goes above this value the alert will be triggered.
  • PriceGoesBelow (default = 0.0) — if price goes below this value the alert will be triggered.
  • PriceIsExactly (default = 0.0) — if price is exactly at this value the alert is triggered.
  • NativeAlert (default = false) — if true, the indicator will issue a native platform alert (popup window with a sound).
  • SendEmail (default = false) — if true and the correct email settings are set in the MetaTrader options window, the indicator will issue an email alert.
  • SendPush (default = false) — if true and the correct MetaQuotes ID settings are set in the MetaTrader options window, the indicator will issue a push notification alert to your mobile device.
  • AlertOnPrice (default = Normal Ask/Bid) — defines the price type for the alerts to use: normal Ask/Bid, only Ask, only Bid, or Close of the previous candle.
  • PanelOnTopOfChart (default = true) — if true, the panel will be drawn on foreground, and the chart will be drawn as background. Setting it to false will uncover the chart behind the panel.

Lines

  • Above Line Color (default = clrGreen) — color of the above line.
  • Below Line Color (default = clrRed) — color of the below line.
  • Exactly Line Color (default = clrYellow) — color of the exactly line.
  • Above Line Style (default = STYLE_SOLID) — above line style.
  • Below Line Style (default = STYLE_SOLID) — below line style.
  • Exactly Line Style (default = STYLE_SOLID) — exactly line style.
  • Above Line Width (default = 1) — above line width.
  • Below Line Width (default = 1) — below line width.
  • Exactly Line Width (default = 1) — exactly line width.

Position

  • PanelPositionX (default = 0) — default horizontal distance from the selected panel position corner.
  • PanelPositionY (default = 15) — default vertical distance from the selected panel position corner.
  • PanelPositionCorner (default = CORNER_LEFT_UPPER) — default panel position corner.

Example


추천 제품
인공 지능을 기반으로 하는 이 지표는 발자국을 판독하여 가능한 시장 반전 지점을 식별하고 소규모 시장 움직임이 발생하기 전에 사전에 신호를 보냅니다. "늦은" 항목을 생성하는 가격 및 거래량 지표와 달리, 즉 방향 변경 시 가격이나 거래량이 이미 확인되어 움직임이 이미 종료된 경우, 이 지표는 "이동이 일어나야 할 때"라는 발자취를 남기고, 따라서 운동이 시작되는 즉시 시장에 진입할 수 있는 가능성을 제공합니다. 이는 반전 신호를 생성할 뿐만 아니라 이미 진행 중인 추세가 지속된다는 신호도 생성합니다. 지표는 인공 지능 덕분에 실제로 시장에서 체결된 계약을 각 수준별로 읽습니다(장부에서 실행 대기 중인 계약이 아니라 실행 직전에 알고트레이딩을 통해 제거됨). 이 지표는 입찰 및 요청으로 실행된 계약(따라서 본질적으로 수동 주문에서 공격적인 주문을 인식함), 시장에서 실행되는 빈도 및 공격성(따라서 대규모 운영자의 "밀기" 의도를 감지함)을 구별할 수 있습니다. 시장을 특정 방향
BinaWin NoTouch
Juan Fernando Urrego Alvarez
BinaWin NoTouch is an indicator that sends an alert signal when the trade is in the right position to wait for the breakdown of a side market. It is specially designed to trade under the “No Touch” strategy of the Binary.Com platform with synthetic indexes N.10, N.25, N.50, N.75 and N.100 Similarly, trading can be done with the conventional CALL and PUT strategy of any Binary Options platform. Requirements to use the indicator: 1. Have an account at Binary.Com 2. Configure the Binary.
FREE
MTF MultiMeter5
GRANTLEY LAURENCE CAUSE
Benefits: A new and innovative way of looking across multiple timeframes and multiple indicators on any chart. Provides instant multi-timeframe analysis of any market. i.e. forex currency pairs, cryptocurrency pairs, commodities, etc. It offers precise indications across multiple timeframes of volatility as measured by RSI, ADX and STOCH within one chart. Helps you determine high probability trading setups. See example strategy in comments. Can see bullish/bearish volatility building across mult
XFlow
Maxim Kuznetsov
XFlow shows an expanding price channel that helps determine the trend and the moments of its reversal. It is also used when accompanying transactions to set take profit/stop loss and averages. It has practically no parameters and is very easy to use - just specify an important moment in the history for you and the indicator will calculate the price channel. DISPLAYED LINES ROTATE - a thick solid line. The center of the general price rotation. The price makes wide cyclical movements around the
Spike Oscillator
Vitalii Kondratiuk
Indicator for searching for price reversals Works well on commodity indices and currency pairs On charts such as Boom Cash, it shows the beginning of a protracted movement well. You can also catch splashes. The indicator uses algorithms, an oscillator and a trend indicator that work together. The indicator shows a candle opening signal (does not disappear, does not redraw and does not recalculate its readings) A good quality tool that can become the basis for creating your own trading system.
Channel Universal   knows how to correctly build a forex channel and forms a classic trading strategy, it is easy to execute, therefore it is accessible even to beginners. Price channels work equally well on any trading assets and timeframes, they can be used both independently and with additional confirmation from oscillators and market volumes. If you look at the price and try to identify the simplest visual patterns, you will immediately see that the price almost never moves in a straight
Percent
Raphael Moretti
The indicator will plot a line on the chart that corresponds to the closing price of the previous day, and based on this, it will plot the percentage levels of change in the price of the asset in question. It can be used on any asset. Period: Determine whether the closing price should be daily, weekly or monthly Minimum percentage: Determine the percentage for the indicator to plot the levels and sub-levels on the chart, eg 0.5 it will plot on the chart a line for every 0.5% variation and the su
Introduction This indicator detects volume spread patterns for buy and sell opportunity. The patterns include demand and supply patterns. You might use each pattern for trading. However, these patterns are best used to detect the demand zone (=accumulation area) and supply zone (=distribution area). Demand pattern indicates generally potential buying opportunity. Supply pattern indicates generally potential selling opportunity. These are the underlying patterns rather than direct price action. T
The Trap Play MT5
Carl Gustav Johan Ekstrom
5 (1)
Trap Play  refers to a market situation where price initially makes a new high or low, luring traders into believing a strong trend is forming. However, the price quickly reverses and invalidates the breakout, trapping those traders who entered positions based on the initial move. This sudden reversal often results in a rapid exit of positions, leading to significant price movement in the opposite direction.  Trap plays  can occur in various financial markets and timeframes and are characterized
Breakout based strategy, generates market entry signals when the price crosses a border of a certain price range. To create the strategy, we have used the history data with 99,9% quality for the last 15 years. The best signals had been selected and the false signals have been filtered out. The Expert Advisor performs technical analysis and considers only the breakouts that show the best result.   It uses a system of filtering false signals. The EA uses adaptive trailing stop. The EA uses a v
Orion Dynamic Keltner
Joao Paulo Botelho Silva
Theoretical Foundation   The Keltner Channels are channels ploted using volatility deviations above and bellow a moving average. The indicator is an excellent tool to help the trader build trend and mean-reversion strategies.   Parameters   The Orion Dynamic Keltner allows the user to select the Volatility Calculation Type, being ATR or Average Range (not considering price gaps). Also, the user can select the Calculation Period, Number of Deviations, Moving Average Mode and the Moving Average Ca
Fibonacci automatically draws Fibonacci retracement, Because Fibonacci automatically draws Fibonacci retracement, you can know at a glance the price to buy at a push or sell back. Therefore, you can trade in favorable conditions in a trending market. We are live-streaming the actual operation of the system. Please check for yourself if it is usable. Please check it out for yourself. https://www.youtube.com/@ganesha_forex We do not guarantee your investment results. Investments should be mad
Trend Monitor VZ MT5
Sergey Ermolov
5 (1)
MT4 버전  |   Valable ZigZag표시   |  FAQ 엘리엇 파동 이론은 가격 차트의 시각적 파동 모델을 기반으로 한 금융 시장의 프로세스에 대한 해석입니다. 이이론에 따르면 현재 시장에서 어떤 추세가 우세한지, 즉 상승 또는 하락 추세를 정확히 알 수 있습니다.   Valable ZigZag 표시 기는 시장의 파동 구조를 보여줄 뿐만 아니라 현재 시간대에서 현재 주요 추세의 방향을 나타냅니다. 편의를 위해 Trend Monitor VZ 표시기는 거래하는 전체 통화 쌍 목록에 대한 모든 시간대의 추세 방향을 차트에표시합니다. 단일 차트에서 모든 상품에 대한 전반적인 시장 상황을 파악하여 올바른 거래 결정을 내릴 수 있습니다! Valable ZigZag 표시기는 매우 안정적이며 고전적인 지그재그처럼 방향을 자주 바꾸지 않아 트레이더에게 혼란을주지 않습니다. 이는 지표의 파동을 플로팅하기 위해 프랙탈을 사용하여 달성됩니다. Valable ZigZag 표시기는 무엇보다도 
Volume Trade Levels
Mahmoud Sabry Mohamed Youssef
The idea behind this indicator is very simple , First it contains 2 mechanisms to place your trades: 1- Enter the Pips you want to duplicate to price levels. 2- Automatically let the indicator specify the largest Buy / Sell Volume Candle and place duplicated levels based on the candle itself. How it works: 1- Enter the Pips you want to duplicate to price levels:    1- once the indicator is loaded you will need first to Specify the number of pips in the indicator Configuration window ,you can
Online Accounts Manager MT5
Kyra Nickaline Watson-gordon
5 (1)
OneClick Online Account Manager is a powerful utility that helps you to manage all your accounts from a centralized panel. It is suitable for all single account traders and specially for multiple accounts traders. The utility help you to : Monitor status of all accounts on a private web page. Some information such as account connection status, account profit, DD, Balance, Equity, Margin Level, Number of positions and orders, Daily and Weekly profit/loss and also overall summation of all these
Smart Delta Volume
Thalles Nascimento De Carvalho
스마트 델타 볼륨은 시장의 변동성에 따라 자동으로 조정되는 동적 수준을 활용합니다. 이러한 특징은 시장 조건의 실시간 변화에 대한 더 정확하고 적응 가능한 분석을 보장합니다. 동적으로 조정하는 능력을 갖춘 스마트 델타 볼륨은 거래량 및 가격 행동에 대해 보다 포괄적이고 신뢰할 수 있는 시각을 제공합니다. 또한, 스마트 델타 볼륨은 가격이 두 동적 수준을 초과할 때 트리거되는 풀백 유효성 검증기를 갖추고 있습니다. 이 조건은 풀백의 유효성을 확인하고 식별된 트렌드에 대한 신뢰를 높입니다. 이러한 풀백의 객관적인 검증은 트레이더에게 중요하며, 잘못된 신호를 피하고 신중하고 안전한 거래 결정을 내릴 수 있도록 돕습니다. 거래 기회를 정확하게 식별하고 지속적으로 변화하는 시장 조건에 적응하며 트렌드와 풀백을 객관적으로 확인하는 스마트 델타 볼륨 지표는 경험 많은 트레이더의 기술적 분석 도구로서 귀중한 역할을 합니다.
This easy to setup indicator shows you the market volumes in a different way, with support and resistance as showed. You can setup: - Backdays volume to show - Heiken Ashi candle view It works for every kind of graph and every kind of period. The program shows the volumes based on the number of candles displayed in the chart: the more candles the more volumes. Enjoy this very useful indicator. Please feel free to message me to report any kind of improvements! :D
Broom Mt5
Marta Gonzalez
When the market breaks the glass ceiling someone has to use the broom and pick up the glass from the floor. Broom is the system that detects this break and collects the crystals. Being a very aggressive scalping system, it should only be used in pairs with a low spread and low commissions. This system is suitable for small accounts and can be used with only  $ 100. You can download the demo and test it yourself.   Very stable growth curve as result of smart averaging techniques. "S
This is a simple EA Can only open ONE trade EVER then MUST be reattached to the chart everytime you want to use it. Designed to help manual traders Has lot sizes and stops / targets in pips. For a buy trade the engulfing bar must close above the previous red bars high Includes Alarm and Phone notifications Basically if you find a price zone you like and will take a trade if there is an engulfing bar . use this.
FREE
Impulse fractals indicator - is counter-trend oriented complex market fractal pattern.  Market creates bull/bear impulse, trend starts, fractals on impulsed wave are an agressive pullback signals. Buy arrow is plotted when market is bearish and it's impulse showed up-side fractal, and sell arrow is plotted when market is bullish and it's impulse showed dn-side fractal. Main indicator's adjustable inputs : impulsePeriod - main period of impulse histogram  filterPeriod  - smoothes impulse accordi
GridMartin Conqueror MT5
Konstantin Kulikov
4 (6)
An automated trading system with smart entry/exit algorithms that uses grid and martingale techniques to maximize profits. The expert has monitoring with a long history for many months, since this system, like all my other experts, is focused on long-term growth: https://www.mql5.com/en/signals/author/test-standart The best sets for currency pairs: GBPUSD, GBPCAD, EURJPY (timeframe М1). Download settings (sets):   https://www.mql5.com/en/blogs/post/747929 Description of EA parameters in comment
Floating peaks oscillator - it the manual trading system. It's based on Stochastik/RSI type of oscillator with dynamic/floating  overbought and oversold levels. When main line is green - market is under bullish pressure, when main line is red - market is under bearish pressure. Buy arrow appears at the floating bottom and sell arrow appears at floating top. Indicator allows to reverse signal types. Main indicator's adjustable inputs : mainTrendPeriod; signalTrendPeriod; smoothedTrendPeriod; tre
Weis Wave Box MT5
Sant Clear Ali Costa
Features 3 types of boxes: bullish, bass and unknown. The unknown box arises when prices move in the opposite direction of the current box. Allows you to set the required points for the box change. Lets you set both the box border types and colors or background color. Label that shows the box reversal points. Lets you set the size, color, corner position, and vertical label margin. Input Parameters Tab Reversal Points. Limit in points in the opposite direction to change boxes. Bulls Box Color -
This indicator is based on the ICCI. If a long pattern is detected, the indicator displays a buy arrow. If a short pattern is detected, the indicator displays a sell arrow. Settings CCI Period - default set to (14) Features Works on all currency pairs and timeframes Draws Arrows on chart Colors Line Color Line Width Line Style Arrow Color This tool can help you analyse the market and indicates market entry.
Price Surfing MT5
Andrey Tatarinov
5 (2)
The advantage of the Price Surfing indicator is the search algorithm for the extremes of the price of the instrument. Most indicator signals are located at  local maximums  and  minimums  of the price . For the convenience of the trader, the potential profit of each signal is displayed on the chart. The indicator does not repainting, the signal appears after the bar is closed. MT4 version  https://www.mql5.com/en/market/product/46054 Parameters SendAlert - enable alert of a new signal SendEMail
Supply and Demand Indicator + FREE Currency Strength Meter ADD-ON Looking for a powerful tool that can help you identify the most reactive zones in the forex market? Our supply and demand indicator for MetaTrader 4 and 5 is exactly what you need. With its advanced algorithms and real-time analysis, this indicator helps traders of all experience levels make informed trading decisions. The supply and demand indicator is a cutting-edge tool that helps traders identify areas where buyers and sellers
Flat finder
Yuriy Lyachshenko
이 인디케이터는 플랫을 감지하고 발견된 영역을 컬러 직사각형으로 칠합니다. 이 인디케이터의 주요 아이디어는 가격이 차트의 특정 영역을 채울 때 플랫을 감지하는 것입니다. 입력 매개변수: Color rectangle - 음영 처리할 사각형의 색상입니다. Bars in rectangle - 직사각형에 허용되는 최소 막대 수입니다. Density in % - 플랫의 밀도로, 사각형 영역의 백분율로 설정합니다. __________________________________________________________________ __________________________________________________________________
Market Noise 시장 노이즈는 가격 차트에서 시장 단계를 결정하는 지표이며, 축적 또는 분산 단계가 발생할 때 분명하고 부드러운 추세 움직임과 시끄러운 평탄한 움직임을 구별합니다. 각 단계는 자체적인 거래 유형에 적합합니다. 추세를 따르는 시스템에서는 추세를 따르고, 공격적인 시스템에서는 플랫합니다. 시장 소음이 시작되면 거래 종료를 결정할 수 있습니다. 마찬가지로, 소음이 끝나자마자 공격적인 거래 시스템을 꺼야 합니다. 누군가는 두 가지 유형의 거래 전략을 서로 전환하면서 거래할 수 있습니다. 따라서 이 지표는 거래 결정 분야에서 훌륭한 조력자 역할을 합니다. 모든 가격 변동은 선택한 기간 동안의 일반적인 가격 변동과 해당 기간 내 가격 변동 형태의 노이즈라는 두 가지 구성 요소로 나눌 수 있습니다. 동시에, 서로 다른 기간의 서로 다른 시장은 잡음과 추세 구성 요소 사이의 광범위한 상호 관계를 보여줄 수 있습니다(그림 1). 가격 변동의 소음 수준이 높을수록 기본 추세의
Trend is real
Ivan Simonika
Despite the apparent simplicity of the indicator, inside it has complex analytical algorithms with which the system determines the moments of inputs. The indicator gives accurate and timely signals to enter and exit the transaction that appear on the current candle. The main purpose of this indicator is to determine the moments of entry and exit from transactions, therefore, the Trend Revers indicator will display only the trend line and entry points, that is, displays the entry points to the
DM IND Exclusive
Sergio Vidal Prado
Indicador Para Opções Binarias. Indicator for Binary Options Usa dois gales. Instalar em mt5 Esse indicador é para ser usado no tempo de vela de 5 minutos e em M5. Este também funciona em M1, porém é mais eficiente em M5. Só descompactar e copiar os arquivos na pasta de dados do seu MT5. Arquivos indicator na pasta MQL5 - Indicator. Baixe também a Media Movel totalmente gratis: https://www.mql5.com/pt/market/product/50400 Esse Indicador é para a próxima vela. Apareceu a seta, só aguardar a pr
이 제품의 구매자들이 또한 구매함
Atomic Analyst MT5
Issam Kassas
5 (14)
우선적으로 언급할 점은이 거래 지표가 다시 그리지 않고 지연되지 않으며 이를 통해 수동 및 로봇 거래 모두에 이상적이라는 점입니다. 사용자 매뉴얼: 설정, 입력 및 전략. Atomic Analyst는 가격의 강도와 모멘텀을 활용하여 시장에서 더 나은 이점을 찾는 PA Price Action Indicator입니다. 고급 필터를 장착하여 잡음과 거짓 신호를 제거하고 거래 잠재력을 높이는 데 도움이 됩니다. 복잡한 지표의 다중 레이어를 사용하여 Atomic Analyst는 차트를 스캔하고 복잡한 수학적 계산을 간단한 신호와 색상으로 변환하여 초보 트레이더가 이해하고 일관된 거래 결정을 내릴 수 있도록합니다. "Atomic Analyst"는 새로운 및 경험이 풍부한 트레이더를위한 종합적인 거래 솔루션입니다. 프리미엄 지표와 최고 수준의 기능을 하나의 거래 전략에 결합하여 모든 종류의 트레이더에 대한 다재다능한 선택지가되었습니다. 인트라데이 거래 및 스캘핑 전략 : 빠르고 정확한
우선 이 거래 시스템이 리페인팅, 리드로잉 및 레이그 인디케이터가 아니라는 점을 강조하는 것이 중요합니다. 이는 수동 및 로봇 거래 모두에 이상적인 것으로 만듭니다. 온라인 강좌, 설명서 및 프리셋 다운로드. "스마트 트렌드 트레이딩 시스템 MT5"은 새로운 및 경험이 풍부한 트레이더를 위해 맞춤형으로 제작된 종합적인 거래 솔루션입니다. 10개 이상의 프리미엄 인디케이터를 결합하고 7개 이상의 견고한 거래 전략을 특징으로 하여 다양한 시장 조건에 대한 다목적 선택이 가능합니다. 트렌드 추종 전략: 효과적인 트렌드 추이를 타기 위한 정확한 진입 및 손절 관리를 제공합니다. 반전 전략: 잠재적인 트렌드 반전을 식별하여 트레이더가 범위 시장을 활용할 수 있게 합니다. 스캘핑 전략: 빠르고 정확한 데이 트레이딩 및 단기 거래를 위해 설계되었습니다. 안정성: 모든 인디케이터가 리페인팅, 리드로잉 및 레이그가 아니므로 신뢰할 수 있는 신호를 보장합니다. 맞춤화: 개별 거래 선호도를 고려한 맞춤
Quantum Trend Sniper
Bogdan Ion Puscasu
4.91 (43)
소개       Quantum Trend Sniper Indicator는   추세 반전을 식별하고 거래하는 방식을 변화시키는 획기적인 MQL5 지표입니다! 13년 이상의 거래 경험을 가진 숙련된 트레이더 팀이 개발한       Quantum Trend Sniper 표시기       매우 높은 정확도로 추세 반전을 식별하는 혁신적인 방법으로 거래 여정을 새로운 차원으로 끌어올리도록 설계되었습니다. ***Quantum Trend Sniper Indicator를 구입하면 Quantum Breakout Indicator를 무료로 받을 수 있습니다!*** Quantum Trend Sniper Indicator는 추세 반전을 식별하고 세 가지 이익실현 수준을 제안할 때 경고, 신호 화살표를 제공합니다. 초보자 거래자와 전문 거래자 모두에게 적합합니다. Quantum EA 채널:       여기를 클릭하세요 MT4 버전:       여기를 클릭하세요
FX Volume MT5
Daniel Stein
4.94 (17)
모닝 브리핑을 통해 세부 정보와 스크린샷으로 매일 시장 업데이트를 받으세요 여기 mql5 및 텔레그램에서 FX 거래량은 브로커의 관점에서 시장 심리에 대한 실제 통찰력을 제공하는 최초이자 유일한 거래량 지표입니다. 브로커와 같은 기관 시장 참여자가 외환 시장에서 어떤 포지션을 취하고 있는지에 대한 훌륭한 통찰력을 COT 보고서보다 훨씬 빠르게 제공합니다. 차트에서 이 정보를 직접 확인하는 것은 트레이딩의 진정한 판도를 바꾸고 획기적인 솔루션입니다. 다음과 같은 고유한 시장 데이터 인사이트의 이점 비율 는 통화의 매수/매도 포지션 비율을 백분율로 표시 비율 변화 는 선택한 기간 내 매수 비율과 비율 변화를 표시 총 거래량 는 해당 통화의 총 거래량(롱 및 숏)을 로트 단위로 보여줍니다 Volumes Long 는 해당 통화의 모든 롱 포지션의 거래량을 보여줍니다 Volumes Short 는 해당 통화의 모든 숏 포지션의 거래량을 보여줍니다 Net Long 는 순 롱 포지션의 거래량
TPSpro RFI Levels MT5
Roman Podpora
5 (8)
Reversal First Impulse levels (RFI)      INSTRUCTIONS        RUS       -       ENG              R ecommended to use with an indicator   -   TREND PRO -  Version MT4                 A key element in trading is zones or levels from which decisions to buy or sell a trading instrument are made. Despite attempts by major players to conceal their presence in the market, they inevitably leave traces. Our task was to learn how to identify these traces and interpret them correctly. Main functions:: Di
Bill Williams Advanced
Siarhei Vashchylka
5 (5)
Bill Williams Advanced is designed for automatic chart analysis using Bill Williams' "Profitunity" system. The indicator analyzes four timeframes at once. Manual (Be sure to read before purchasing) Advantages 1. Automatically analyzes the chart using the "Profitunity" system of Bill Williams. The found signals are placed in a table in the corner of the screen. 2. Equipped with a trend filter based on the Alligator indicator. Most of the system signals are recommended to be used only accordi
TrendMaestro5
Stefano Frisetti
note: this indicator is for METATRADER4, if you want the version for METATRADER5 this is the link:  https://www.mql5.com/it/market/product/108106 TRENDMAESTRO ver 2.4 TRENDMAESTRO recognizes a new TREND in the bud, he never makes mistakes. The certainty of identifying a new TREND is priceless. DESCRIPTION TRENDMAESTRO identifies a new TREND in the bud, this indicator examines the volatility, volumes and momentum to identify the moment in which there is an explosion of one or more of these data a
소개       Quantum Breakout PRO   , 브레이크아웃 존 거래 방식을 변화시키는 획기적인 MQL5 지표! 13년 이상의 거래 경험을 가진 숙련된 트레이더 팀이 개발한       퀀텀 브레이크아웃 PRO       혁신적이고 역동적인 브레이크아웃 존 전략으로 거래 여정을 새로운 차원으로 끌어올리도록 설계되었습니다. Quantum Breakout Indicator는 5개의 이익 목표 영역이 있는 브레이크아웃 영역의 신호 화살표와 브레이크아웃 상자를 기반으로 한 손절 제안을 제공합니다. 초보자 거래자와 전문 거래자 모두에게 적합합니다. Quantum EA 채널:       여기를 클릭하세요 중요한! 구매 후 설치 매뉴얼을 받으려면 개인 메시지를 보내주십시오. 추천: 기간: M15 통화쌍: GBPJPY, EURJPY, USDJPY,NZDUSD, XAUUSD 계정 유형: 스프레드가 매우 낮은 ECN, Raw 또는 Razor 브로커 시간: GM
XQ Indicator MetaTrader 5
Marzena Maria Szmit
5 (1)
Step into the realm of Forex trading with confidence and precision using XQ, a cutting-edge Forex indicator designed to elevate your trading game to unprecedented heights. Whether you're a seasoned trader or just stepping into the world of currency exchange, XQ Forex Indicator empowers you with the insights and signals needed to make informed trading decisions. The signal conditions are a combination of three indicators, and XQ Forex Indicator only display  medium and long-term trends . The ind
Golden Gate Algo MT5
James David Lane
4 (6)
크리스마스 40% 할인! 1월 1일에 가격이 $250로 인상됩니다! GoldenGate Entries를 소개합니다: 혁신적인 트레이딩 솔루션! GoldenGate Entries (GGE)를 사용하여 거래하는 혁신적인 방법을 발견하세요. GGE는 귀하의 거래 경험을 향상시키기 위해 디자인된 고급 지표로, 사용자에게 정확성과 자신감을 부여하는 포괄적인 기능을 제공합니다. 페어: 아무거나 (FX - 상품 - 주식 - 주식 - 암호화폐) 타임프레임: 15분에서 H1까지 주요 기능: 매수 및 매도 화살표 표시: 팝업 알림과 함께 매수 및 매도 화살표 표시를 받아 언제나 정보를 확인할 수 있습니다. GoldenGate_Algo: 시장 상황에 대한 통찰력을 얻으려면 GoldenGate_Algo를 사용하세요. 시장이 '과매도'인지 '과매수'인지 평가하는 강력한 도구입니다. 현재 트렌드 분석: 현재 보고 있는 타임프레임에서 현재 트렌드에 액세스하여 거래를 주류 시장 방
"Piranha" - an autonomous trading system that determines overbought and oversold levels on the chart. Red and blue zones represent overbought and oversold levels respectively. Entry points are marked with arrows: a downward arrow in the red zone for "sell" and an upward arrow in the blue zone for "buy". The Take profit level is indicated by the green moving average. Key features: Adjusting the Take profit level as the green moving average changes position. Averaging ability when a new market e
FxaccurateLS
Shiv Raj Kumawat
WHY IS OUR FXACCCURATE LS MT5 THE PROFITABLE ? PROTECT YOUR CAPITAL WITH RISK MANAGEMENT Gives entry, stop and target levels from time to time. It finds Trading opportunities by analyzing what the price is doing during established trends. POWERFUL INDICATOR FOR A RELIABLE STRATEGIES We have made these indicators with a lot of years of hard work. It is made at a very advanced level. Established trends provide dozens of trading opportunities, but most trend indicators completely ignore them!
MTF Supply Demand Zones MT5
Georgios Kalomoiropoulos
자동화된 수요 및 공급 구역의 차세대. 모든 차트에서 작동하는 새롭고 혁신적인 알고리즘. 모든 구역은 시장의 가격 움직임에 따라 동적으로 생성됩니다. 두 가지 유형의 경고 --> 1)가격이 영역에 도달할 때 2)새로운 영역이 형성될 때 당신은 더 이상 쓸모없는 지표를 얻을 수 없습니다. 입증된 결과로 완벽한 거래 전략을 얻을 수 있습니다.     새로운 기능:     가격이 공급/수요 영역에 도달하면 경고     새로운 공급/수요 구역이 생성되면 알림     푸시 알림 알림     핍의 영역 너비 레이블     기동특무부대에 한 번 더 시간이 주어집니다. 따라서 현재보다 위의 2개의 시간 프레임 대신 현재보다 높은 3개의 시간 프레임을 볼 수 있습니다.     Alerts/Zones/MTF 기능을 활성화/비활성화하는 버튼 당신이 얻는 이점:     거래에서 감정을 제거하십시오.     거래 항목을 객
Volume by Price MT5
Brian Collard
5 (4)
The Volume by Price Indicator for MetaTrader 5 features Volume Profile and Market Profile TPO (Time Price Opportunity). Volume and TPO histogram bar and line charts. Volume Footprint charts. TPO letter and block marker collapsed and split structure charts. Session filtering and grouping. Static, dynamic and flexible range segmentation and compositing methods with relative and absolute visualizations. Graphical layering, positioning and styling options to suit the user's analytic and aesthetic n
SMCpro
Arief
5 (1)
Currently Price  20% OFF  ( for unlimited use ) Indicator   USER MANUAL , trade setups, solving issues, etc :  Direct Download Here     (  for users only  ) Hello World! Introducing.. SMCpro tool and Indicator for  MetaTrader 5 , a cutting-edge feature designed to revolutionize your trading experience. With innovative ICT Smart Money Concept, you gain unparalleled insight into market dynamics, empowering you to make informed trading decisions like never before. SMC Indicator built on th
PZ Trend Trading MT5
PZ TRADING SLU
3.67 (3)
Trend Trading is an indicator designed to profit as much as possible from trends taking place in the market, by timing pullbacks and breakouts. It finds trading opportunities by analyzing what the price is doing during established trends. [ Installation Guide | Update Guide | Troubleshooting | FAQ | All Products ] Trade financial markets with confidence and efficiency Profit from established trends without getting whipsawed Recognize profitable pullbacks, breakouts and early reversals The ind
PZ Divergence Trading MT5
PZ TRADING SLU
3.75 (4)
Tricky to find and scarce in frequency, divergences are one of the most reliable trading scenarios. This indicator finds and scans for regular and hidden divergences automatically using your favourite oscillator. [ Installation Guide | Update Guide | Troubleshooting | FAQ | All Products ] Easy to trade Finds regular and hidden divergences Supports many well known oscillators Implements trading signals based on breakouts Displays suitable stop-loss and take-profit levels Configurable oscilla
Golden Spikes Detector
Batsirayi L Marango
3 (2)
Golden Spikes Detector This indicator is based on an advanced strategy primarily for trading spikes on Boom and Crash Indices. Complex algorithms were implemented to detect high probability entries only. It alerts on potential Buy and Sell entries. To trade spikes on the Deriv or Binary broker, only take Buy Boom and Sell Cash alerts. It was optimised to be loaded on 5-minute timeframe although multiple timeframe analysis is done in the background. Features ·             Desktop pop up and sound
IVISTscalp5
Vadym Zhukovskyi
5 (5)
당신에게 소개하는 iVISTscalp5 지표는 독특하면서도 거래 작업에서 효과적입니다. 이 지표는 시간 데이터를 기반으로 하며 금융 시장의 많은 경험과 깊은 분석의 결과입니다. iVISTscalp5 지표는 수동 거래에 뛰어난 도구입니다. 편리성, 간단함 및 시각화 - 모든 복잡성은 숨겨져 있습니다. 우리는 iVISTscalp5 지표의 설정과 사용을 최대한 단순화했습니다. 이 지표는 MT5 터미널에서 가지고 있는 모든 금융 상품에 적합합니다. 시간 기준으로 작동하는 시간은 4am에서 8pm (UTC+3)입니다. iVISTscalp5 지표 메뉴 (스크린샷 1 참조): History - 표시할 주간 수 계산 dT_min - 시간 설정 간격 선택 (분) TFline - 수평 볼륨 생성 (타임프레임) BARSline - 수평 볼륨 생성 (바 수) TFtrend1 - 매일 채널 생성 (타임프레임) BARStrend1 - 매일 채널 생성 (바 수) TFtrend2 - 주간 채널 생성 (타임프레임
TPA True Price Action indicator reveals the true price action of the market makers through 100% non-repainting signals strictly at the close of a candle! TPA shows entries and re-entries, every time the bulls are definitely stronger than the bears and vice versa. Not to confuse with red/green candles. The shift of power gets confirmed at the earliest stage and is ONE exit strategy of several. There are available now two free parts of the TPA User Guide for our customers. The first "The Basics"
Introducing the South African Sniper indicator created by a small group of traders with a few years trading trading the financial market profitably . This is a plug and play indicator that provides you with  BUY and SELL (SNIPER ENTRY) signals with TARGET and trail stops. The indicator Works with all MT5 trading instruments. The indicator uses previous  chart data as receipt to speculate on future market moves.  "The South African Sniper indicator community are very happy with the indicator an
PZ Support Resistance MT5
PZ TRADING SLU
4 (5)
Tired of plotting support and resistance lines? This is a multi-timeframe indicator that detects and plots supports and resistance lines in the chart with the same precision as a human eye would. As price levels are tested over time and its importance increases, the lines become thicker and darker, making price leves easy to glance and evaluate. [ Installation Guide | Update Guide | Troubleshooting | FAQ | All Products ] Boost your technical analysis Customizable timeframe selection Read pri
Malaysian SNR Levels
Matthias Horst Pieroth
This indicator can be used to display Support and Resistance levels according to  the  Malaysian SNR concept , in which Support and Resistance are exact levels of a line chart. Malaysian SNR There are 3 different horizontal levels in Malaysian SNR: A-Level : This level is located at the peak of this line chart. (shape looks like the letter A) V-Level : Level at the valley of a line chart, (shape looks like the letter V) Gap-Leve l: This level is located at the Close/Open gap between two cand
Introducing the Power Trade Plus indicator designed by a small group of traders with a few years of experience trading the market profitably.  The Power Trade Plus is derived from the Power Trade indicator,  the indicator strive in powerful sniper entries and take profit levels,  with an algorithm that's can determine the markets volatility and Provides entries based on the current market volatility. This indicator is much more effective in stock ,currencies and indices.
PZ Day Trading MT5
PZ TRADING SLU
2.83 (6)
This indicator detects price reversals in a zig-zag fashion, using only price action analysis and a donchian channel. It has been specifically designed for short-term trading, without repainting or backpainting at all. It is a fantastic tool for shrewd traders aiming to increase the timing of their operations. [ Installation Guide | Update Guide | Troubleshooting | FAQ | All Products ] Amazingly easy to trade It provides value on every timeframe It displays suitable SL and TP levels It impl
TD Combo is better when you have sharp directional moves, because it requires only thirteen price bars from start to finish compared to TD Sequential which needs at least 22 bars. The criteria for a Setup within TD Combo are the same with those required for a Setup within TD Sequential. The difference is that the count starts at bar 1 of the setup and not from bar 9 and TD Combo requires four conditions to be satisfied simultaneously. Requirements for a TD Combo Buy Countdown - Close lower
Dragon Multi Indicator MT5
Mansour Babasafary
5 (4)
3 Indicators in 1 indicator Strategy based on price action Made specifically for the best forex currency pairs Can be used in the best time frame of the market at a very reasonable price This indicator is basically 3 different indicatos . But we have combined these 3 indicators in 1 indicator so that you can use 3 indicators at the lowest price. All three strategies are based on price action. But based on different trends. Long term, medium term and short term Attributes : No repaintin
Professional Scalping Tool on Deriv Attention! The indicator will be sold in limited quantities!!! The previous 5 copies were sold for $250 The remaining 4 copies will be sold for $350 The next price is $500 Description: This trading indicator is designed for professional traders focused on scalping. Designed with the market in mind, it provides highly accurate spike trading signals. It works on the M1 timeframe and supports the following symbols: Boom 300 Index, Boom 500 Index, Boom 1000 I
PZ Harmonacci Patterns MT5
PZ TRADING SLU
3.25 (4)
This is arguably the most complete harmonic price formation auto-recognition indicator you can find for the MetaTrader Platform. It detects 19 different patterns, takes fibonacci projections as seriously as you do, displays the Potential Reversal Zone (PRZ) and finds suitable stop-loss and take-profit levels. [ Installation Guide | Update Guide | Troubleshooting | FAQ | All Products ] It detects 19 different harmonic price formations It plots primary, derived and complementary Fibonacci p
MetaForecast M5
Vahidreza Heidar Gholami
5 (2)
MetaForecast는 가격 데이터의 조화를 기반으로 모든 시장의 미래를 예측하고 시각화합니다. 시장이 항상 예측 가능한 것은 아니지만 가격에 패턴이 있다면 MetaForecast는 가능한 정확하게 미래를 예측할 수 있습니다. 다른 유사한 제품과 비교했을 때, MetaForecast는 시장 동향을 분석하여 더 정확한 결과를 생성할 수 있습니다. 입력 매개변수 Past size (과거 크기) MetaForecast가 미래 예측을 생성하기 위한 모델을 만드는 데 사용하는 막대의 수를 지정합니다. 모델은 선택한 막대 위에 그려진 노란색 선으로 표시됩니다. Future size (미래 크기) 예측해야 할 미래 막대의 수를 지정합니다. 예측된 미래는 핑크색 선으로 표시되며 그 위에 파란색 회귀선이 그려집니다. Degree (차수) 이 입력은 MetaForecast가 시장에서 수행할 분석 수준을 결정합니다. Degree 설명  0 차수 0의 경우, "Past size" 입력에 모든 봉우리
제작자의 제품 더 보기
Mt5TradeCopier
Mcblastus Gicharu Ndiba
Forex Trade copier MT5.  It copies forex trades, positions, orders from any accounts to any other account,  MT5 even multiple accounts. The unique copying algorithm exactly copies all trades from the master account to your client account. It is also noted for its high operation speed and Tough error handling. It also can copy from demo account to live account too. It is one of the best free trade copiers that can do ,  MT5 or to multiple accounts  MT5 to multiple accounts  Features of Trade Copi
필터:
리뷰 없음
리뷰 답변