Show engulfing form
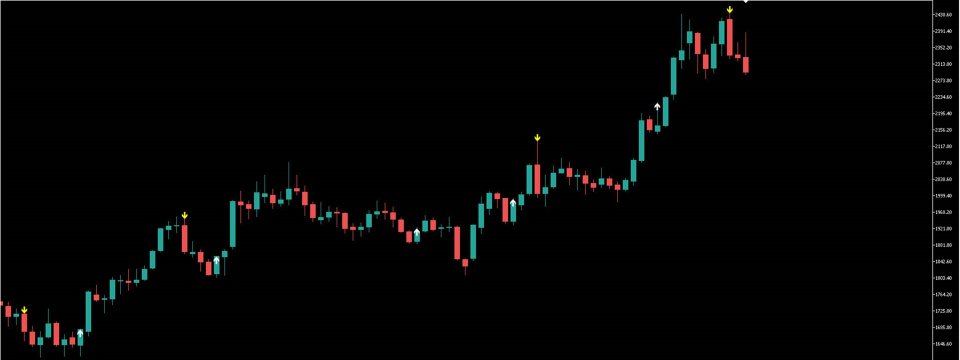
This indicator shows the engulfing pattern, which is the most direct manifestation of capital flow.

Engulfing Pattern is a common price reversal pattern in technical analysis, which usually appears at the end of a price trend or at key support and resistance levels. It can be divided into two types: Bullish Engulfing Pattern and Bearish Engulfing Pattern.

Bullish Engulfing Pattern
feature:

Previous K-line: This is the negative line of a small entity (the opening price is higher than the closing price).
The next K-line: This is the positive line of a large entity (the opening price is lower than the closing price), and the entity of the positive line completely covers the entity of the previous negative line.
meaning:

Appearance position: Usually appears at the end of a downward trend, indicating that the power of sellers gradually fails and the power of buyers begins to dominate.
It indicates that the price may reverse upward and is a bullish signal.

Bearish Engulfing Pattern
feature:

Previous K-line: This is a small-body positive line (the opening price is lower than the closing price).
The next K line: This is the negative line of a large entity (the opening price is higher than the closing price), and the entity of the negative line completely surrounds the entity of the previous positive line.
meaning:

Appearance position: Usually appears at the end of an upward trend, indicating that the power of buyers gradually fails and the power of sellers begins to dominate.
It indicates that the price may reverse downward and is a bearish signal.

