• 미리보기
  • 리뷰
  • 코멘트

Boom 300 Index Precision spike detector

Our Spike Detector is specifically engineered to cater to the unique needs of traders in the Boom and Crash indices markets. This tool is optimized for M1 (1-minute) and M5 (5-minute) timeframes, ensuring you receive timely and actionable insights.

Key Features:

1. **Non-Repainting**: Our detector guarantees accuracy with non-repainting signals, ensuring your data remains consistent and reliable.
2. **Push Notifications**: Stay updated with real-time push notifications, so you never miss a critical market movement.
3. **Mobile Compatibility with VPS**: Our tool can be seamlessly operated on mobile devices when used with a Virtual Private Server (VPS), providing flexibility and convenience.
4. **Pinpoint Accuracy**: Enjoy high precision with a 90% accuracy rate, helping you make more informed trading decisions.
5. **Comprehensive User Guide**: A detailed guide is included to help you install and utilize the detector effectively, ensuring you can maximize its potential.
6. **Audible Alerts**: Get audible notifications for spikes, enabling you to react swiftly to market changes.
7. **Exit Signals**: Receive clear exit signals for optimal trade exits, safeguarding your profits.
8. **User-Friendly Interface**: The detector features an intuitive and user-friendly interface, making it accessible for both novice and experienced traders.

Our Spike Detector is your ultimate companion for navigating the volatile Boom and Crash markets, providing you with the tools needed to enhance your trading strategy and achieve better results.

How the Spike Detector Works


The Spike Detector for Boom and Crash indices is a specialized tool designed to provide precise market signals, enhancing your trading strategy. This guide will explain how the detector works, interpret its signals, and how to effectively use it to improve your trading results.


#### Understanding the Signals


The Spike Detector generates real-time alerts crucial for making informed trading decisions. Here’s how to interpret these signals:


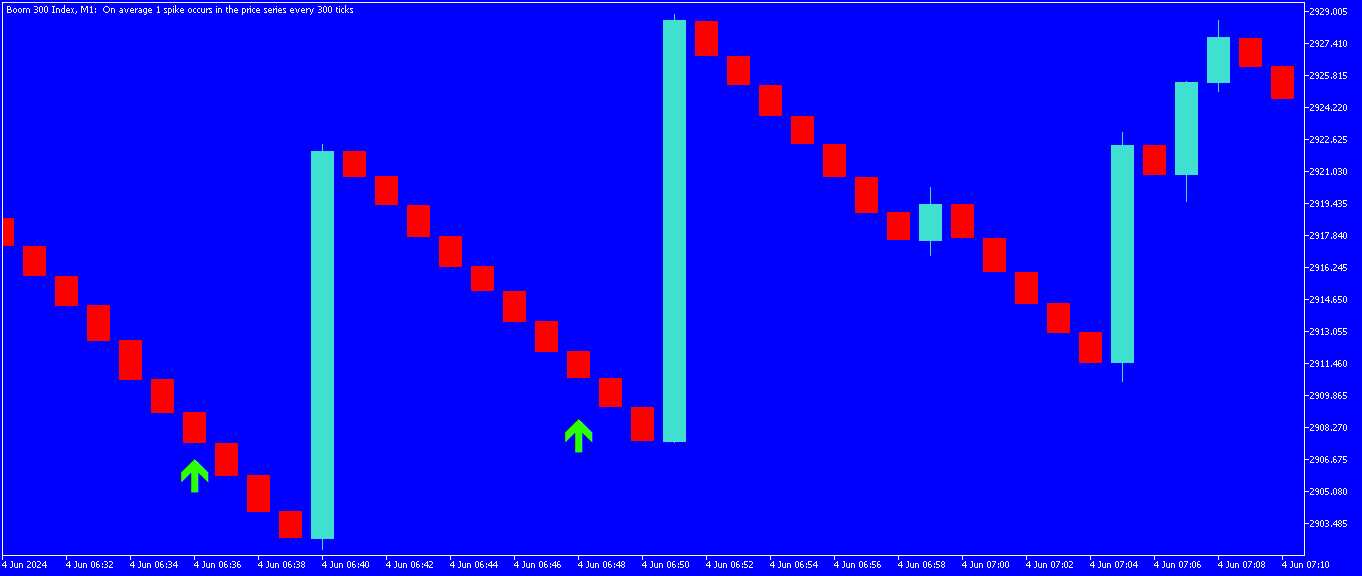
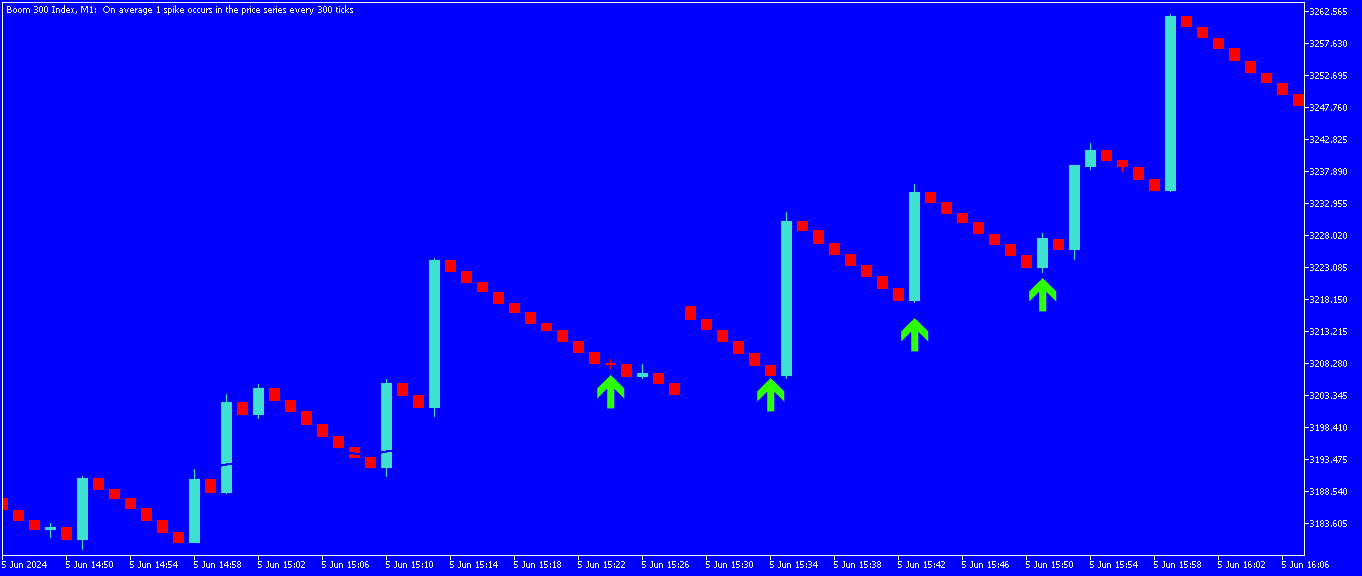
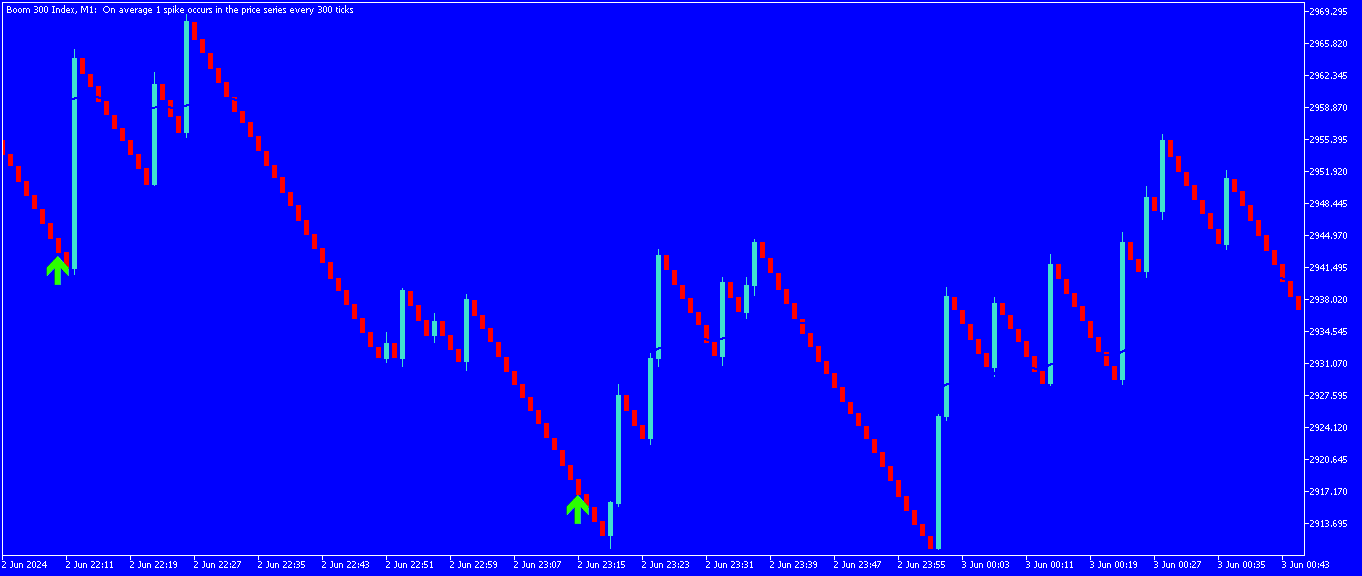
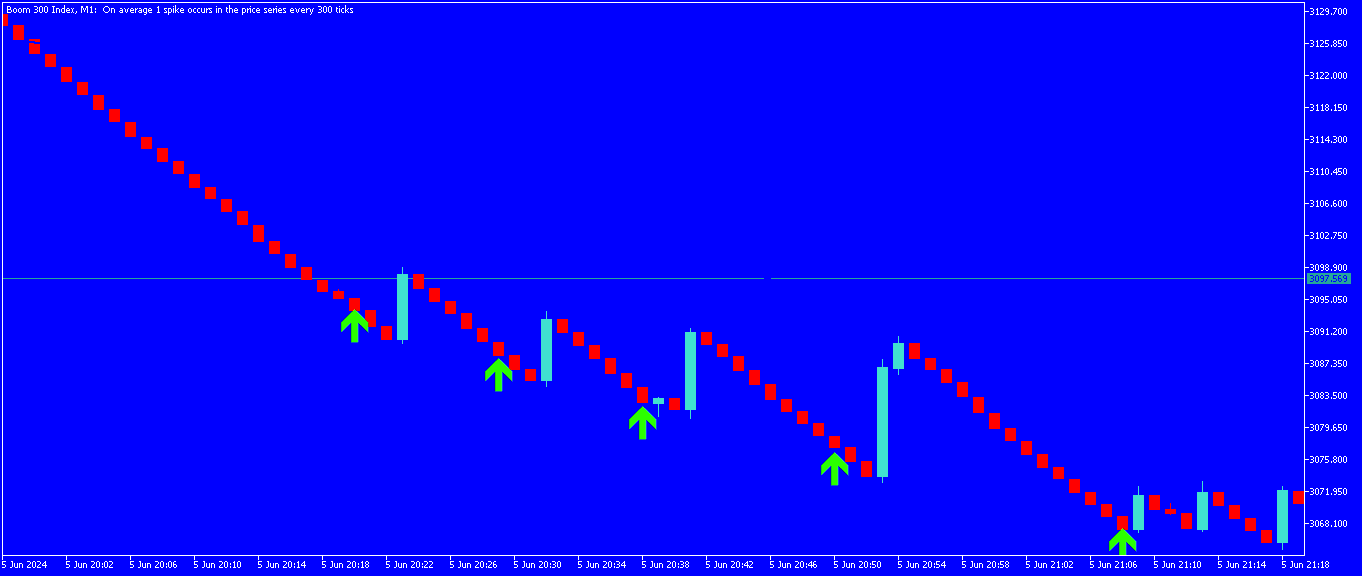
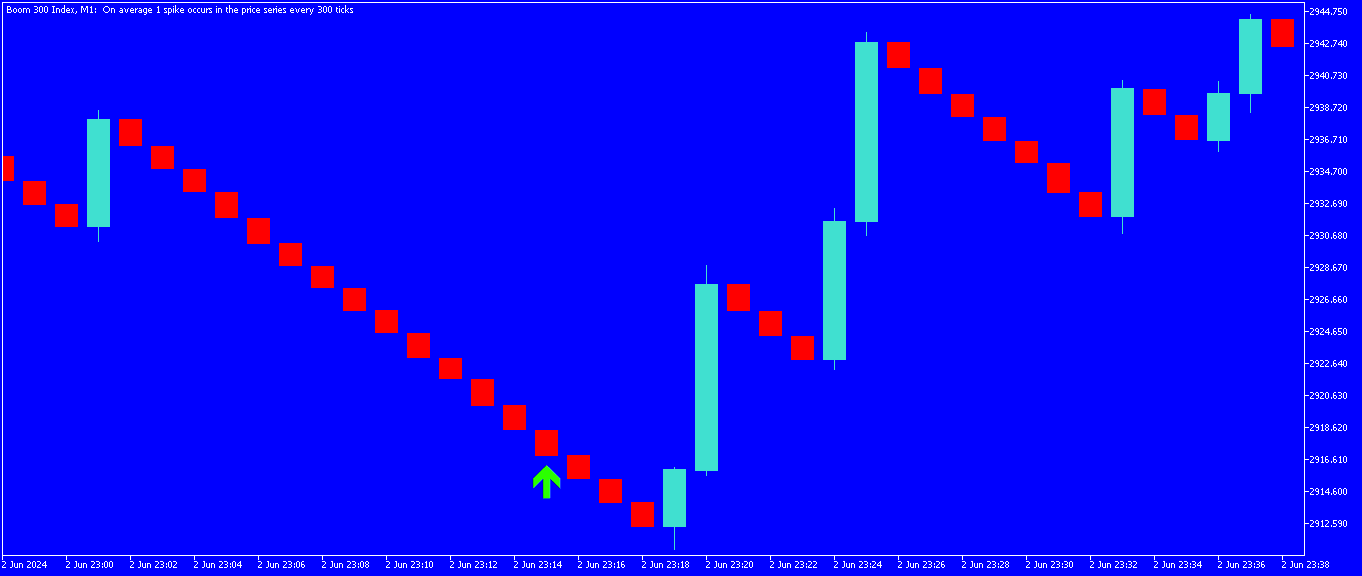
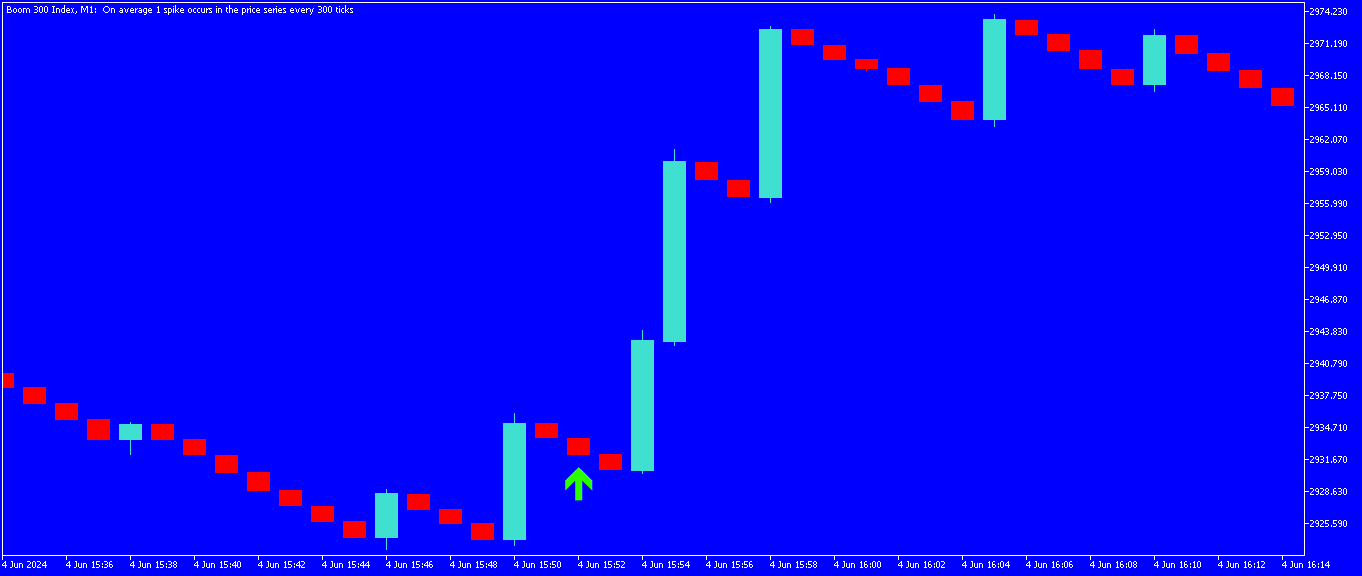
1. Lime Green Up Arrow (Boom Market):

    - **Signal**: This arrow indicates a potential upward spike in the Boom market.

    - **Action**: When a lime green up arrow appears on your chart, it signals an optimal buying opportunity. Enter a buy position immediately.

    - **Hold Duration**: Maintain the position for up to 10 minutes.

    - **Exit Strategy**: If a spike occurs within this timeframe, it confirms the signal's accuracy, and you can decide to exit or hold based on your strategy. If no spike occurs within 10 minutes, exit the position to avoid potential losses.


2. Other Alerts:

    - Push Notifications: Receive real-time notifications for signals, allowing you to react promptly even when away from your computer.

    - Audible Alerts: These ensure you are aware of signals without needing to constantly monitor your screen.


The Spike Detector’s high accuracy (90%) ensures that you can rely on these signals for consistent trading performance. The non-repainting nature of the signals guarantees that the alerts you receive are stable and dependable.

 Installation Guide

Installing the Spike Detector on MT5 is straightforward. Follow these steps to integrate the detector into your trading platform:


1. Download the Spike Detector:

    - Ensure you have the Spike Detector file ready for installation.


2. Open MT5 Platform:

    - Launch your MT5 trading platform.


3. Automatic Installation:

    - Double-click the Spike Detector file. This will initiate the automatic installation process in MT5.

    - Follow the prompts to complete the installation.


4. **Manual Installation (Alternative Method):

    - Copy the Spike Detector file to the MT5 directory:

        - Go to `File` > `Open Data Folder`.

        - Navigate to `MQL5` > `Indicators`.

        - Paste the Spike Detector file into this folder.

    - Restart MT5 to recognize the new indicator.


5. **Loading the Indicator**:

    - In the MT5 platform, open the `Navigator` panel.

    - Under the `Indicators` section, locate the Spike Detector.

    - Drag and drop the Spike Detector onto the appropriate chart (Boom or Crash indices).


6. **Configuring the Indicator**:

    - A settings window will appear. Customize the settings if needed, but the default settings are optimized for typical use.

    - Click `OK` to apply the indicator to the chart.


How to Use the Spike Detector


Once the Spike Detector is installed and configured, it’s essential to understand how to use it effectively for trading Boom and Crash indices. Here’s a step-by-step guide:


1. Set Up Your Chart**:

    - Ensure your chart is set to M1 or M5 timeframe, as the Spike Detector is optimized for these intervals.


2. Monitoring Signals**:

    - Keep an eye on the chart for lime green up arrows in Boom markets. These arrows signal potential spikes.

    - Enable push notifications and audible alerts to stay informed about signals even when you’re not actively monitoring the screen.


3. Executing Trades**:

    - Upon seeing a lime green up arrow, immediately enter a buy position in the Boom market.

    - Hold the position for 10 minutes.


4. Exiting Trades**:

    - If a spike occurs within 10 minutes, you can either exit the position to secure profits or continue to hold based on your broader strategy.

    - If no spike occurs within the 10-minute window, exit the position to minimize potential losses.


5. Using on Mobile Devices**:

    - For traders using mobile devices, ensure you have a Virtual Private Server (VPS) setup. This allows the Spike Detector to function seamlessly on your mobile MT5 platform.

    - Follow the same steps to monitor signals and execute trades from your mobile device.


6. Continuous Learning and Adaptation**:

    - Regularly review the user guide to ensure you’re utilizing all features of the Spike Detector.

    - Adapt your trading strategy based on the performance and signals provided by the detector.

 Conclusion


The Spike Detector is a powerful tool designed to help you navigate the Boom and Crash indices markets with precision. By providing non-repainting signals, push notifications, and audible alerts, it ensures you stay ahead of market movements. Follow the installation and usage guide meticulously to fully leverage the capabilities of the Spike Detector, enhancing your trading strategy and improving your outcomes in the volatile Boom and Crash markets.


Remember, while the Spike Detector offers high accuracy, it’s crucial to combine its signals with sound trading practices and risk management strategies. Happy trading!


추천 제품
Our Spike Detector is specifically engineered to cater to the unique needs of traders in the Boom and Crash indices markets. This tool is optimized for M1 (1-minute) and M5 (5-minute) timeframes, ensuring you receive timely and actionable insights. Key Features: 1. Non-Repainting**: Our detector guarantees accuracy with non-repainting signals, ensuring your data remains consistent and reliable. 2. Push Notifications**: Stay updated with real-time push notifications, so you never miss a criti
MT5 Drawdown Tracker – Track Your EA’s Performance with Precision! Take your trading analysis to the next level with our MT5 indicator designed to monitor, record, and report the drawdown of any Expert Advisor. Whether you’re fine-tuning your strategies or optimizing risk management, this tool gives you the insights you need. Key Features: Effortless Tracking: Automatically monitors the drawdown levels of your EAs with precision. Comprehensive Data Storage: Accurately logs each drawdown event,
Create and trade timeframes in seconds. The bar time duration is freely adjustable from 1 second and up. The chart is accurately constructed using real ticks from the broker's server. Main characteristics The indicator is an overlay on the main chart, making it possible to utilize one-click trading and on-chart order manipulation. History calculated using real tick data. Built-in technical studies: 4 moving averages (Simple, Exponential, Smooth, Linear-weighted, Volume-weighted using tick or rea
Order Book, known also as Market Book, market depth, Level 2, - is a dynamically updated table with current volumes of orders to buy and to sell specific financial instument at price levels near Bid and Ask. MetaTrader 5 provides the means for receiving market book from your broker, but in real time only, without access to its history. The indicator OrderBook Cumulative Indicator accumulates market book data online and visualizes them on the chart. In addition, the indicator can show the market
표시기는 현재 시세를 작성하여 과거 시세와 비교할 수 있으며 이를 바탕으로 가격 변동을 예측합니다. 표시기에는 원하는 날짜로 빠르게 이동할 수 있는 텍스트 필드가 있습니다. 옵션: 기호 - 표시기가 표시할 기호 선택. SymbolPeriod - 지표가 데이터를 가져올 기간 선택. IndicatorColor - 표시기 색상. HorisontalShift - 지시자가 그린 따옴표를 지정된 막대 수만큼 이동합니다. Inverse - true는 인용 부호를 반대로, false - 원래 보기를 반전합니다. ChartVerticalShiftStep - 차트를 수직으로 이동합니다(키보드의 위/아래 화살표). 다음은 날짜를 입력할 수 있는 텍스트 필드의 설정으로, '엔터'를 누르면 즉시 이동할 수 있습니다.
거래량 가중 MACD 볼륨 가중 MACD(VW-MACD)는 Buff Dormeier가 작성했으며 그의 책 Investing With Volume Analysis에 설명되어 있습니다. 볼륨 가중 가격 추세의 수렴과 발산을 나타냅니다. 볼륨을 포함하면 VW-MACD가 일반적으로 기존 MACD보다 응답성과 신뢰성이 높아집니다.   MACD(이동 평균 수렴 발산)란 무엇입니까? 이동 평균 수렴 발산은 1979년 Gerald Appel에 의해 만들어졌습니다. 표준 MACD는 단기 지수 평균과 장기 지수 평균 간의 차이를 표시합니다. 차이(MACD 라인)가 양수이고 상승하면 가격 추세가 상승하고 있음을 나타냅니다. MACD 라인이 음수이면 가격 추세가 하락하고 있음을 나타냅니다. 이 차이의 부드러운 지수 평균이 계산되어 MACD 신호 라인을 형성합니다. MACD선이 MACD 신호선 위에 있으면 MACD의 모멘텀이 상승하고 있음을 나타냅니다. 마찬가지로 MACD가 MACD 신호선 아래
An Ultimate Tool  for quick and efficient market analysis. Unique combination of solid indicators defining market direction for trend tracking and filtration designed for you to stay on the   right   side of the market. Market Rider Tools   gives you access to one of the most used from professional trades indicators on worldwide, which were not build in for MT4 and MT5 terminals . These are unique non-repainting indicators designed to be used on all time frames for all instruments classes: For
Super Magic Moving Pro
Benyamin Naser Mokhtari Karchegani
*NASDAQ 100을 위한 골든 지표 소개!* NASDAQ 100에서 거래 성공을 향상시킬 강력한 도구를 찾고 계신가요? 더 이상 찾지 마세요! 저희의 독점 지표는 NASDAQ 100의 움직임에 대한 2년간의 광범위한 연구와 분석 끝에 세심하게 개발되었습니다. 이 고급 이동 평균 지표는 황금비율 원리, 피보나치 수준, 간 각도를 활용하여 가격과 이동 평균 간의 가장 정확한 교차 지점을 찾아냅니다. *왜 이 지표를 선택해야 할까요?* - *간편한 설정:* 다운로드하고 실행하기만 하면 됩니다. 복잡한 설정이 필요 없습니다! - *최적의 성능:* 1분 및 5분 타임 프레임에서 가장 효과적이며, 다른 모든 타임 프레임에서도 우수한 성과를 제공합니다. - *추세 강도 감지:* 강력한 캔들스틱이 이동 평균을 교차할 때 거래에 진입하세요. (캔들 몸체의 80% 이상이 이동 평균 위에 있어야 합니다.) *매직 전략의 일부!*   이 지표는 NASDAQ 100에서 매직 전략을 위한 세
All traders face to a serious question: How to estimate trading strategy performance and control risk in real-time? Eventhough use backtest and optimizing in strategy tester, but unfortunately, trader need to deal with the curse of curve-fitting, because optimized result is just for the specific set of historical data that was tested. This indicator retrieves deal information from historical data then draws balance and equity curve of account and calculate drawdown in REAL-TIME. It helps trader
Smart M Concept MT5
Andrei Novichkov
Our new indicator is an important part of the Smart Money Concepts (SMC) system It uses a modern market vision and fast calculation methods. As a result, the trader has a complete picture of the trade at every moment in time, which makes the process of obtaining results easier and faster. Our new indicator displays the following important patterns:   Order Blocks. Imbalance – Fair Value Gap (FVG). Break Of Structures (BoS). Change of character (CHoCH). Equal highs & lows. Premium , Equilibrium
Visual Dragon State Indicator
AL MOOSAWI ABDULLAH JAFFER BAQER
Dragon State Indicator is a powerful trading tool designed to empower traders by giving them the foundation to optimize it further. This indicator is not optimized , making it a perfect choice for traders who love to tweak and customize trading tools to suit their unique strategies. The Logic Behind the Indicator The Dragon State Indicator identifies pivotal market movements using these components: Buy and Sell Signals : Buy Signal : Clearly displayed with lime-green arrows when conditi
Renko System
Marco Montemari
This indicator can be considered as a trading system. It offers a different view to see the currency pair: full timeless indicator, can be used for manual trading or for automatized trading with some expert advisor. When the price reaches a threshold a new block is created according to the set mode. The indicator beside the Renko bars, shows also 3 moving averages. Features renko mode median renko custom median renko 3 moving averages wicks datetime indicator for each block custom notification
VR Grid Mt5
Vladimir Pastushak
3.43 (7)
VR 그리드 표시기는 사용자 정의 설정으로 그래픽 그리드를 생성하도록 설계 되었습니다. 표준 그리드 와 달리 VR 그리드는 원형 레벨 을 구축하는 데 사용됩니다. 사용자의 선택에 따라 라운드 수준 사이의 단계는 임의적일 수 있습니다. 또한 VR Grid는 다른 인디케이터나 유틸리티와는 달리 기간이 바뀌거나 단말기를 재부팅해도 그리드의 위치 를 유지합니다. 설정, 세트 파일, 데모 버전, 지침, 문제 해결 등은 다음에서 얻을 수 있습니다. [블로그] 다음에서 리뷰를 읽거나 작성할 수 있습니다. [링크] 버전 [MetaTrader 4] 수직 수준 은 실제 시간 간격을 기준으로 하며 누락 또는 존재하지 않는 기간은 무시 합니다. 따라서 레벨 사이의 단계는 사용자가 선택한 값과 엄격하게 일치합니다. VR 그리드 표시기를 사용할 때 트레이더는 모든 수준에서 스타일 , 수직선 및 수평선의 색상 및 두께를 변경할 수 있습니다. 이를 통해 금융 상품의 라운드 수준 을 제어할 수 있습니다. 라운
FREE
CoioteAverageSpreed
Alexandre Moraes De Souza Lima
O indicador CoioteAverageSpreed é uma releitura do indicador AverageSpreed. Ele mostra a relação de esforço x resultado entre o volume e a volatilidade do preço. Com o volume heatmap é possível identificar visualmente se o preço foi deslocado com uma quantidade maior de volume e se o deslocamento do preço apresentou maior resultado ou não. É possível identificar momentos de ignição e exaustão do movimento, além de injeções de fluxo para dar continuidade a um movimento.
ATR Line
Evgeny Levchenko
The indicator - "ATR Line" determines the current trend and gives signals to buy (green arrow to the top) or sell (red arrow to the bottom). The indicator calculation is based on the deviation of the average price of the instrument from its average true range - ATR. The moving average of prices is used to reduce "market noise". If the main line of the indicator - "ATR Line" is lower the instrument price chart, then the market is in a "bullish" trend. If the main line of the indicator is higher t
** NOTE: This indicator uses realtime data. Thus DO NOT download Demo version. If you still need demo version, please refer to free version . Symbol Chart Changer is an indicator/utility that offers you the option to switch between symbols and timeframes. You can choose any symbol and timeframe on the same chart with just a few clicks.  In addition, this indicator also shows the profit of the symbol through the color of the buttons. Features: Click buttons on the chart to monitor all your fa
C500 Spirit Breaker
Norman Thomas Celliers
Crash 500  indicator Update V2 No Repaint This indicator works with a custom build in strategy  The indicator will only give a sell sign when market conditions are in place. Only for sell. Apply own risk management target profit and stoploss. When market conditions are met the sell sign will indicate you to enter a sell position and you will have to apply your risk management system accordingly. This is only for Crash 500 market and only 1min chart   NB: Please note this indicator will be free
Entry IQ MT5
Michael Prescott Burney
5 (1)
The Entry IQ Indicator is a sophisticated technical analysis tool designed to enhance decision-making in trading by providing clear, actionable insights into market trends and price dynamics. It leverages a combination of dynamic price boxes, equilibrium zones, and trend detection algorithms to identify potential entry points for long and short positions. The indicator includes advanced features such as automatic adjustment for brokers with varying price digit formats, customizable arrow signal
FREE
XOATRHIST 5
Ainur Sharipov
3 (1)
Version for MetaTrader 5. The indicator is based on point and figure chart, but their period is equal to ATR indicator values. Displays in the form of steps. Steps above zero indicate an uptrend. Below zero on a downtrend. Parameters: ATRPeriod - ATR period for calculation of steps. Note: The indicator uses closes price, thus it is recommended to consider completed bars.
Owl Smart Levels MT5
Sergey Ermolov
4.07 (28)
MT4 버전  |  FAQ Owl Smart Levels Indicator 는 Bill Williams 의 고급 프랙탈, 시장의 올바른 파동 구조를 구축하는 Valable ZigZag, 정확한 진입 수준을 표시하는 피보나치 수준과 같은 인기 있는 시장 분석 도구를 포함하는 하나의 지표 내에서 완전한 거래 시스템입니다. 시장과 이익을 취하는 장소로. 전략에 대한 자세한 설명 표시기 작업에 대한 지침 고문-거래 올빼미 도우미의 조수 개인 사용자 채팅 ->구입 후 나에게 쓰기,나는 개인 채팅에 당신을 추가하고 거기에 모든 보너스를 다운로드 할 수 있습니다 힘은 단순함에 있습니다! Owl Smart Levels 거래 시스템은 사용하기 매우 쉽기 때문에 전문가와 이제 막 시장을 연구하고 스스로 거래 전략을 선택하기 시작한 사람들 모두에게 적합합니다. 전략 및 지표에는 눈에 보이지 않는 비밀 공식 및 계산 방법이 없으며 모든 전략 지표는 공개되어 있습니다. Owl Smart Levels를 사
John Bollinger's normalized MFI (Fund Flow Index). Bollinger bands are used to calculate overbought/oversold areas. It takes three input parameters: MFI period - MFI calculation period MFI Applied Volume - Calculates the volume of MFI transactions BB period - Calculation period of the Bollinger band BB deviation - Brin deviation Calculation: NormMFI = (MFI-BL) / (TL-BL) Among them: TL = BBands(MFI, BB period, BB deviation, UPPER_BAND) BL = BBands(MFI, BB period, BB deviation, LOWER_BAND) MFI - M
Everything is simple. The usual Information indicator. Shows on the chart: Current spread, buy swap, sell swap, time to close the candle, broker time. The indicator can be placed at the top right or at the bottom right of the chart. Most often, the spread is called the difference between the sale and purchase price. Swap is the cost of transferring a position to the next day. 
The intention of the dashboard is to provide a quick overview of the daily, weekly and monthly range of configured assets. In "single asset mode" the dashboard shows you possible reversal points directly in the chart, thus making statistics directly tradable. If a configured threshold is exceeded, the dashboard can send a screen alert, a notification (to the mobile MT5) or an email.  There are various ways of using this information. One approach is that an asset that has completed nearly 100%
Previous High and Previous Low in the charts usually forms an area of interest for trading on the chart. Price usually move quickly then stall around these areas. This indicator identify Bars which are highest or lowest of the surrounding bars and extend a line out to visualize it. Extend line for how many bars: Define how many bars to extend the bars to the right of the extreme bar. Width of Extreme: Define how many bars it should be the highest/lowest to the left and right of the bar Keep line
이것은 바이너리 옵션에 대한 지표입니다. 이동 평균 신호 확인을 통해 Engulfing Candles를 계산합니다. Green Buy 및 Red Sell 화살표가 차트에 표시됩니다. 여러 쌍(EUR/USD, EUR/JPY, USD/JPY...등)을 사용하여 3분 및 5분 차트에서 테스트되었습니다. EUR/JPY OTC 및 EUR/USD OTC와 같은 Pocketoption OTC 시장에서도 작동합니다. 초보자를 위한, 마틴게일을 사용하는 경우 권장 설정은 다음과 같습니다. 초기 투자: $1.00 마틴게일 승수: 2.5 마틴게일 단계: 5 전문 트레이더의 경우, Martingale을 사용하는 경우 위험 관리 전략에 따라 초기 투자가 결정됩니다. 하지만 저는 2.5 Multiplier를 강력히 권장하고 단계를 5로 유지합니다. 지표가 다섯 번째 단계에 도달하지 못할 가능성이 높지만 지표가 매수 및 매도할 수 있는 여지를 스스로 확보해야 합니다. 첨부된 스크린샷을 참조하세요.
Point Black
Ignacio Agustin Mene Franco
Black Card Pack indicator 5/1 point black It has the strategy of professional bollingers where each arrow gives you a different entry signal. It is used to operate in m1 and in d1 It is used for scalping and intraday, modified for forex markets ! suitable for all pairs modified for synthetic index markets suitable for all pairs! Ideal for volatility and jumps!
Gioteen Volatility Index (GVI) - your ultimate solution to overcoming market unpredictability and maximizing trading opportunities. This revolutionary indicator helps you in lowering your losing trades due to choppy market movements. The GVI is designed to measure market volatility, providing you with valuable insights to identify the most favorable trading prospects. Its intuitive interface consists of a dynamic red line representing the volatility index, accompanied by blue line that indicate
Golden Spike Premium
Kwaku Bondzie Ghartey
Golden Spikes Detector Acknowledgement and Dedications:  The name of this indicator was Inspired by an Original; Mr Grant Koopman; a Knowledgeable and experienced Synthetics trader. I dedicate this indicator to Mr Grant.  Overview:   The Golden Spikes Premium is a groundbreaking trading indicator meticulously crafted for the Boom and Crash indices on the Deriv market. Tailored to meet the needs of discerning traders, this powerful tool operates exclusively on the one-minute timeframe, providing
The indicator detects divergence signals - the divergences between the price peaks and the MACD oscillator values. The signals are displayed as arrows in the additional window and are maintained by the messages in a pop-up window, e-mails and push-notifications. The conditions which formed the signal are displayed by lines on the chart and in the indicator window. The indicator parameters MacdFast - fast MACD line period MacdSlow - slow MACD line period MacdSignal - MACD signal line period Macd
AIS Optimal TPSL MT5
Aleksej Poljakov
5 (1)
이 표시기는 최적의 이익실현 및 손절매 수준을 표시합니다. 이 수준은 과거 데이터를 기반으로 계산됩니다. 처음 시작할 때 표시기는 기록에 대해 학습됩니다. 그런 다음 그는 가격이 미래에 이 또는 그 수준을 극복할 확률을 평가하고 정지 주문을 하기 위한 가장 최적의 옵션을 선택합니다. 예를 들어 이익을 취하는 값은 이익이 최대이고 가격이 해당 수준에 도달할 확률이 가장 높도록 선택됩니다. 손절매 수준은 최소한이어야 하지만 도달할 확률은 최소한이어야 합니다. 결과적으로 승리에 대한 수학적 기대치가 가장 높은 레벨이 생성됩니다. 또한 이 지표는 지지선과 저항선의 형태로 사용될 수 있습니다. 이를 위해 다양한 예측 길이와 오프셋을 결합할 수 있습니다. 표시 매개변수: 길이 - 예측 길이. 이 매개변수는 향후 막대 거래의 예상 기간을 나타냅니다. Shift - 막대에서 이동합니다. 이 매개변수 덕분에 과거의 표시기 판독값을 볼 수 있습니다. 너비 - 선 너비. ClrBuy - 매수 포지션의
이 제품의 구매자들이 또한 구매함
Trend Screener Pro MT5
STE S.S.COMPANY
4.89 (74)
트렌드 표시기, 트렌드 트레이딩 및 필터링을 위한 획기적인 고유 솔루션, 하나의 도구 안에 내장된 모든 중요한 트렌드 기능! Forex, 상품, 암호 화폐, 지수 및 주식과 같은 모든 기호/도구에 사용할 수 있는 100% 다시 칠하지 않는 다중 시간 프레임 및 다중 통화 표시기입니다. Trend Screener는 차트에 점이 있는 화살표 추세 신호를 제공하는 효율적인 지표 추세 추종 지표입니다. 추세 분석기 표시기에서 사용할 수 있는 기능: 1. 트렌드 스캐너. 2. 최대 이익 분석이 있는 추세선. 3. 추세 통화 강도 측정기. 4. 경고가 있는 추세 반전 점. 5. 경고가 있는 강력한 추세 점. 6. 추세 화살표 Trend Screener Indicator가 있는 일일 분석 예, 일일 신호 성능...등은 여기에서 찾을 수 있습니다. 여기를 클릭하십시오. LIMITED TIME OFFER : Trend Screener Indicator는 50$ 및 평생 동안만 사용할 수 있습니다.
Golden Trend Indicator MT5
Noha Mohamed Fathy Younes Badr
4.86 (14)
Golden Trend indicator  is The best indicator for predicting trend movement this indicator never lags and never repaints and never back paints    and give  arrow buy and sell    before the candle appear  and it will help you and  will make your trading decisions clearer its work on all currencies and  gold and crypto and all time frame This unique  indicator uses very secret algorithms to catch the  trends, so you can trade using this indicator and see the trend clear on charts  manual guide and
FX Volume MT5
Daniel Stein
4.82 (17)
FX Volume: 브로커 시각에서 바라보는 진짜 시장 심리 간단 요약 트레이딩 접근 방식을 한층 더 향상시키고 싶으신가요? FX Volume 는 소매 트레이더와 브로커의 포지션을 실시간으로 파악할 수 있게 해 줍니다. 이는 COT 같은 지연된 보고서보다 훨씬 빠릅니다. 꾸준한 수익을 추구하는 분이든, 시장에서 더 깊은 우위를 원하시는 분이든, FX Volume 을 통해 대규모 불균형을 찾아내고, 돌파 여부를 확인하며 리스크 관리를 정교화할 수 있습니다. 지금 시작해 보세요! 실제 거래량 데이터가 의사결정을 어떻게 혁신할 수 있는지 직접 경험해 보시기 바랍니다. 1. 트레이더에게 FX Volume이 매우 유익한 이유 탁월한 정확도를 지닌 조기 경보 신호 • 다른 사람들보다 훨씬 앞서, 각 통화쌍을 매수·매도하는 트레이더 수를 거의 실시간으로 파악할 수 있습니다. • FX Volume 은 여러 리테일 브로커에서 추출한 실제 거래량 데이터를 종합해 명확하고 편리한 형태로 제공하는
FX Levels MT5
Daniel Stein
5 (3)
FX Levels: 모든 시장을 위한 뛰어난 정확도의 지지와 저항 간단 요약 통화쌍, 지수, 주식, 원자재 등 어떤 시장이든 믿을 만한 지지·저항 레벨을 찾고 싶나요? FX Levels 는 전통적인 “Lighthouse” 기법과 첨단 동적 접근을 결합해, 거의 보편적인 정확성을 제공합니다. 실제 브로커 경험을 반영하고, 자동화된 일별 업데이트와 실시간 업데이트를 결합함으로써 FX Levels 는 가격 반전 포인트를 파악하고, 수익 목표를 설정하며, 자신 있게 트레이드를 관리할 수 있게 돕습니다. 지금 바로 시도해 보세요—정교한 지지/저항 분석이 어떻게 여러분의 트레이딩을 한 단계 끌어올릴 수 있는지 직접 확인하세요! 1. FX Levels가 트레이더에게 매우 유용한 이유 뛰어난 정확도의 지지·저항 존 • FX Levels 는 다양한 브로커 환경에서도 거의 동일한 존을 생성하도록 설계되어, 데이터 피드나 시간 설정 차이로 인한 불일치를 해소합니다. • 즉, 어떤 브로커를 사용하
FX Power MT5 NG
Daniel Stein
5 (10)
FX Power: 통화 강세 분석으로 더 스마트한 거래 결정을 개요 FX Power 는 어떤 시장 상황에서도 주요 통화와 금의 실제 강세를 이해하기 위한 필수 도구입니다. 강한 통화를 매수하고 약한 통화를 매도함으로써 FX Power 는 거래 결정을 단순화하고 높은 확률의 기회를 발견합니다. 트렌드를 따르거나 극단적인 델타 값을 사용해 반전을 예측하고자 한다면, 이 도구는 귀하의 거래 스타일에 완벽히 적응합니다. 단순히 거래하지 말고, FX Power 로 더 스마트하게 거래하세요. 1. FX Power가 거래자에게 매우 유용한 이유 통화와 금의 실시간 강세 분석 • FX Power 는 주요 통화와 금의 상대적 강세를 계산하고 표시하여 시장 역학에 대한 명확한 통찰력을 제공합니다. • 어떤 자산이 앞서고 있고 어떤 자산이 뒤처지는지 모니터링하여 보다 현명한 거래 결정을 내릴 수 있습니다. 포괄적인 멀티 타임프레임 뷰 • 단기, 중기 및 장기 타임프레임에서 통화와 금의 강세를
CBT Quantum Maverick 고효율 바이너리 옵션 거래 시스템 CBT Quantum Maverick는 정밀하고 간단하며 체계적인 거래를 원하는 트레이더를 위해 설계된 고성능 바이너리 옵션 거래 시스템입니다. 사용자 지정이 필요 없으며, 처음부터 최적화된 결과를 제공합니다. 약간의 연습만으로 신호를 쉽게 마스터할 수 있습니다. 주요 특징: 정확한 신호 제공: 현재 봉 데이터를 기반으로 다음 캔들에 대한 신호를 생성하며, 빈번한 재도색이 없습니다. 다양한 시장에 대한 적응성: 바이너리 옵션 거래에 특화되었으며, 여러 브로커 및 자산 클래스와 호환됩니다. 호환 가능: Deriv Synthetic Charts: 모든 시간 프레임에서 사용 가능. OTC 차트: Quotex, PocketOption, Binomo, Stockity, IQOption, Exnova, OlympTrade, Deriv, Binolla, Homebroker 등의 브로커와 호환(MT5로의 무료 데이터 임
Quantum TrendPulse
Bogdan Ion Puscasu
5 (13)
SuperTrend   ,   RSI   ,   Stochastic   의 힘을 하나의 포괄적인 지표로 결합하여 트레이딩 잠재력을 극대화하는 궁극의 트레이딩 도구   인 Quantum TrendPulse를   소개합니다. 정밀성과 효율성을 추구하는 트레이더를 위해 설계된 이 지표는 시장 추세, 모멘텀 변화, 최적의 진입 및 종료 지점을 자신 있게 식별하는 데 도움이 됩니다. 주요 특징: SuperTrend 통합:   주요 시장 추세를 쉽게 따라가고 수익성의 물결을 타세요. RSI 정밀도:   매수 과다 및 매도 과다 수준을 감지하여 시장 반전 시점을 파악하는 데 적합하며 SuperTrend 필터로 사용 가능 확률적 정확도:   변동성이 큰 시장에서 숨겨진 기회를 찾기 위해 확률적 진동   을 활용하고 SuperTrend의 필터로 사용 다중 시간대 분석:   M5부터 H1 또는 H4까지 다양한 시간대에 걸쳐 시장을 최신 상태로 유지하세요. 맞춤형 알림:   맞춤형 거래 조건이 충족되면
Entry Points Pro for MT5
Yury Orlov
4.46 (130)
다시 색을 칠하지 않고 거래에 진입할 수 있는 정확한 신호를 제공하는 MT5용 지표입니다. 외환, 암호화폐, 금속, 주식, 지수 등 모든 금융 자산에 적용할 수 있습니다. 매우 정확한 추정값을 제공하고 매수와 매도의 가장 좋은 시점을 알려줍니다. 하나의 시그널로 수익을 내는 지표의 예와 함께 비디오 (6:22)시청하십시오! 대부분의 거래자는 Entry Points Pro 지표의 도움으로 첫 거래 주 동안 트레이딩 결과를 개선합니다. 저희의   Telegram Group 을 구독하세요! Entry Points Pro 지표의 좋은점. 재도색이 없는 진입 신호 신호가 나타나고 확인되면(시그널 캔들이 완성된 경우) 신호는 더 이상 사라지지 않습니다. 여타 보조지표의 경우 신호를 표시한 다음 제거되기 때문에 큰 재정적 손실로 이어집니다. 오류 없는 거래 게시 알고리즘을 통해 트레이드(진입 또는 청산)를 할 이상적인 순간을 찾을 수 있으며, 이를 통해 이를 사용하는 모든 거래자의 성공률이
IX Power MT5
Daniel Stein
4.83 (6)
IX Power: 지수, 원자재, 암호화폐 및 외환 시장 통찰력을 발견하세요 개요 IX Power 는 지수, 원자재, 암호화폐 및 외환 시장의 강도를 분석할 수 있는 다목적 도구입니다. FX Power 는 모든 가용 통화 쌍 데이터를 사용하여 외환 쌍에 대해 가장 높은 정확도를 제공하는 반면, IX Power 는 기초 자산 시장 데이터에만 초점을 맞춥니다. 이로 인해 IX Power 는 비외환 시장에 이상적이며, 다중 쌍 분석이 필요하지 않은 간단한 외환 분석에도 신뢰할 수 있는 도구입니다. 모든 차트에서 매끄럽게 작동하며, 거래 결정을 향상시키기 위한 명확하고 실행 가능한 통찰력을 제공합니다. 1. IX Power가 트레이더에게 유용한 이유 다양한 시장 강도 분석 • IX Power 는 지수, 원자재, 암호화폐 및 외환 심볼의 강도를 계산하여 각 시장에 맞는 통찰력을 제공합니다. • US30, WTI, 금, 비트코인 또는 통화 쌍과 같은 자산을 모니터링하여 거래 기회를 발견
FX Dynamic: 맞춤형 ATR 분석으로 변동성과 트렌드를 파악하세요 개요 FX Dynamic 는 Average True Range(ATR) 계산을 활용하여 트레이더에게 일간 및 일중 변동성에 대한 뛰어난 인사이트를 제공하는 강력한 도구입니다. 80%, 100%, 130%와 같은 명확한 변동성 임계값을 설정함으로써 시장이 평소 범위를 초과할 때 빠르게 경고를 받고, 유망한 수익 기회를 재빨리 식별할 수 있습니다. FX Dynamic 는 브로커의 시간대를 인식하거나 수동으로 조정할 수 있으며, 변동성 측정 기준을 일관되게 유지하며, MetaTrader 플랫폼과 완벽하게 연동되어 실시간 분석을 지원합니다. 1. FX Dynamic이 트레이더에게 매우 유용한 이유 실시간 ATR 인사이트 • 하루 및 일중 변동성을 한눈에 모니터링하세요. ATR의 80%, 100%, 130% 임계값이 도달 또는 초과되면, 시장의 중요한 지점에 있음을 알 수 있습니다. • 변동성이 완전히 폭발하기
TPSproTREND PrO MT5
Roman Podpora
4.69 (16)
TPSpro TREND PRO  - is a trend indicator that automatically analyzes the market and provides information about the trend and each of its changes, as well as giving signals for entering trades without redrawing! The indicator uses each candle, analyzing them separately. referring to different impulses - up or down impulse. Exact entry points into transactions for currencies, crypto, metals, stocks, indices!  ИНСТРУКЦИЯ RUS         INSTRUCTIONS  ENG       R ecommended to use with an indicator   -
TPSpro RFI Levels MT5
Roman Podpora
4.53 (19)
지침         러시아   -        영어       표시기와 함께 사용하는 것이 좋습니다   .       -       TPSpro   트렌드 프로 -   MT4 버전         거래에서 핵심 요소는 거래 상품을 매수 또는 매도하기로 결정하는 구역 또는 수준입니다. 주요 업체가 시장에서 자신의 존재를 숨기려는 시도에도 불구하고, 그들은 필연적으로 흔적을 남깁니다. 우리의 과제는 이러한 흔적을 식별하고 올바르게 해석하는 방법을 배우는 것이었습니다. 주요 기능:: 판매자와 구매자를 위한 활성 영역을 표시합니다! 이 지표는 매수 및 매도를 위한 모든 올바른 초기 임펄스 레벨/존을 보여줍니다. 진입점 검색이 시작되는 이러한 레벨/존이 활성화되면 레벨의 색상이 바뀌고 특정 음영으로 채워집니다. 또한 상황을 보다 직관적으로 이해하기 위해 화살표가 나타납니다. 더 높은 시간대의 레벨/존 표시(MTF 모드) 더 높은 시간 간격을 사용하여 레벨/존을 표시하는 기능을 추가했습니다.
우선적으로, 이 거래 도구는 전문적인 거래에 이상적인 비-다시 그리기 및 지연되지 않는 지표입니다.  온라인 강좌, 사용자 매뉴얼 및 데모. 스마트 가격 액션 컨셉트 인디케이터는 신규 및 경험 많은 트레이더 모두에게 매우 강력한 도구입니다. Inner Circle Trader Analysis 및 Smart Money Concepts Trading Strategies와 같은 고급 거래 아이디어를 결합하여 20가지 이상의 유용한 지표를 하나로 결합합니다. 이 인디케이터는 스마트 머니 컨셉트에 중점을 두어 대형 기관의 거래 방식을 제공하고 이동을 예측하는 데 도움을 줍니다.  특히 유동성 분석에 뛰어나 기관이 어떻게 거래하는지 이해하는 데 도움을 줍니다. 시장 트렌드를 예측하고 가격 변동을 신중하게 분석하는 데 탁월합니다. 귀하의 거래를 기관 전략에 맞추어 시장의 동향에 대해 더 정확한 예측을 할 수 있습니다. 이 인디케이터는 시장 구조를 분석하고 중요한 주문 블록을 식별하고 다양
Basic Harmonic Patterns Dashboard MT5
Mehran Sepah Mansoor
4.57 (7)
이 대시보드는 선택한 심볼에 대해 사용 가능한 최신 고조파 패턴을 표시하므로 시간을 절약하고 더 효율적으로 사용할 수 있습니다 /   MT4 버전 . 무료 인디케이터:   Basic Harmonic Pattern 인디케이터 열 Symbol :   선택한 심볼이 나타납니다 Trend :   강세 또는 약세 Pattern :   패턴 유형(가틀리, 나비, 박쥐, 게, 상어, 사이퍼 또는 ABCD) Entry :   진입 가격 SL:   스톱로스 가격 TP1:   1차 테이크프로핏 가격 TP2:   2차 테이크프로핏 가격 TP3:   3차 테이크프로핏 가격 Current price:   현재 가격 Age (in bars):   마지막으로 그려진 패턴의 나이 주요 입력 Symbols :   "28개 주요 통화쌍" 또는 "선택한 심볼" 중에서 선택합니다. Selected Symbols :   쉼표로 구분하여 모니터링하려는 원하는 심볼("EURUSD,GBPUSD,XAUUSD")을 선택
Bill Williams Advanced
Siarhei Vashchylka
5 (9)
Bill Williams Advanced is designed for automatic chart analysis using Bill Williams' "Profitunity" system. The indicator analyzes four timeframes at once. Manual (Be sure to read before purchasing) Advantages 1. Automatically analyzes the chart using the "Profitunity" system of Bill Williams. The found signals are placed in a table in the corner of the screen. 2. Equipped with a trend filter based on the Alligator indicator. Most of the system signals are recommended to be used only according t
Gartley Hunter Multi
Siarhei Vashchylka
5 (9)
Gartley Hunter Multi - An indicator for searching for harmonic patterns simultaneously on dozens of trading instruments and on all possible timeframes. Manual (Be sure to read before purchasing) | Version for MT4 Advantages 1. Patterns: Gartley, Butterfly, Shark, Crab. Bat, Alternate Bat, Deep Crab, Cypher 2. Simultaneous search for patterns on dozens of trading instruments and on all possible timeframes 3. Search for patterns of all possible sizes. From the smallest to the largest 4. All fou
Support And Resistance Screener는 하나의 지표 안에 여러 도구를 제공하는 MetaTrader에 대한 하나의 레벨 지표입니다. 사용 가능한 도구는 다음과 같습니다. 1. 시장 구조 스크리너. 2. 완고한 후퇴 영역. 3. 약세 후퇴 영역. 4. 일일 피벗 포인트 5. 주간 피벗 포인트 6. 월간 피벗 포인트 7. 고조파 패턴과 볼륨에 기반한 강력한 지지와 저항. 8. 은행 수준 구역. LIMITED TIME OFFER : HV 지원 및 저항 표시기는 50 $ 및 평생 동안만 사용할 수 있습니다. ( 원래 가격 125$ ) MQL5 블로그에 액세스하면 분석 예제와 함께 모든 프리미엄 지표를 찾을 수 있습니다. 여기를 클릭하십시오. 주요 특징들 고조파 및 볼륨 알고리즘을 기반으로 하는 강력한 지원 및 저항 영역. Harmonic 및 Volume 알고리즘을 기반으로 한 강세 및 약세 풀백 영역. 시장 구조 스크리너 일간, 주간 및 월간 피벗 포인트. 실제 거래의
소개       Quantum Breakout PRO   , 브레이크아웃 존 거래 방식을 변화시키는 획기적인 MQL5 지표! 13년 이상의 거래 경험을 가진 숙련된 트레이더 팀이 개발한       퀀텀 브레이크아웃 PRO       혁신적이고 역동적인 브레이크아웃 존 전략으로 거래 여정을 새로운 차원으로 끌어올리도록 설계되었습니다. Quantum Breakout Indicator는 5개의 이익 목표 영역이 있는 브레이크아웃 영역의 신호 화살표와 브레이크아웃 상자를 기반으로 한 손절 제안을 제공합니다. 초보자 거래자와 전문 거래자 모두에게 적합합니다. Quantum EA 채널:       여기를 클릭하세요 중요한! 구매 후 설치 매뉴얼을 받으려면 개인 메시지를 보내주십시오. 추천: 기간: M15 통화쌍: GBPJPY, EURJPY, USDJPY,NZDUSD, XAUUSD 계정 유형: 스프레드가 매우 낮은 ECN, Raw 또는 Razor 브로커 시간: GMT +3 중개인 :
Matrix Arrow Indicator MT5
Juvenille Emperor Limited
5 (13)
매트릭스 화살표 표시기 MT5 는 외환, 상품, 암호 화폐, 지수, 주식과 같은 모든 기호/도구에 사용할 수 있는 100% 다시 칠하지 않는 다중 기간 표시기를 따르는 고유한 10 in 1 추세입니다.  Matrix Arrow Indicator MT5 는 다음과 같은 최대 10개의 표준 지표에서 정보와 데이터를 수집하여 초기 단계에서 현재 추세를 결정합니다. 평균 방향 이동 지수(ADX) 상품 채널 지수(CCI) 클래식 하이켄 아시 캔들 이동 평균 이동 평균 수렴 발산(MACD) 상대 활력 지수(RVI) 상대 강도 지수(RSI) 포물선 SAR 스토캐스틱 오실레이터 윌리엄스의 백분율 범위 모든 지표가 유효한 매수 또는 매도 신호를 제공하면 강력한 상승/하락 추세를 나타내는 다음 캔들/막대가 시작될 때 해당 화살표가 차트에 인쇄됩니다. 사용자는 사용할 표시기를 선택하고 각 표시기의 매개변수를 개별적으로 조정할 수 있습니다. 매트릭스 화살표 표시기 MT5는 선택한 표시기에서만 정보를 수
FxaccurateLS
Shiv Raj Kumawat
WHY IS OUR FXACCCURATE LS MT5 THE PROFITABLE ? PROTECT YOUR CAPITAL WITH RISK MANAGEMENT Gives entry, stop and target levels from time to time. It finds Trading opportunities by analyzing what the price is doing during established trends. POWERFUL INDICATOR FOR A RELIABLE STRATEGIES We have made these indicators with a lot of years of hard work. It is made at a very advanced level. Established trends provide dozens of trading opportunities, but most trend indicators completely ignore them! The
RelicusRoad Pro MT5
Relicus LLC
4.78 (18)
이제 $ 147 (몇 가지 업데이트 후 $ 499 증가) - 무제한 계정 (PCS 또는 MACS) RelicusRoad 사용 설명서 + 교육 비디오 + 비공개 Discord 그룹 액세스 + VIP 상태 시장을 보는 새로운 방법 RelicusRoad는 외환, 선물, 암호화폐, 주식 및 지수에 대한 세계에서 가장 강력한 거래 지표로서 거래자에게 수익성을 유지하는 데 필요한 모든 정보와 도구를 제공합니다. 우리는 초보자부터 고급까지 모든 거래자가 성공할 수 있도록 기술적 분석 및 거래 계획을 제공합니다. 미래 시장을 예측할 수 있는 충분한 정보를 제공하는 핵심 거래 지표입니다. 우리는 차트에서 말이 안 되는 여러 지표 대신 완전한 솔루션을 믿습니다. 타의 추종을 불허하는 매우 정확한 신호, 화살표 + 가격 조치 정보를 표시하는 올인원 표시기입니다. 강력한 AI를 기반으로 하는 RelicusRoad는 누락된 정보와 도구를 제공하여 교육하고 성공적인 트레이더인 트레이딩 전문가가 되도
ON Trade Gann Squares MT5
Abdullah Alrai
5 (2)
간 스퀘어 지표는 W.D. 간이 쓴 "시장 예측을 위한 수학적 공식" 기사에 기반한 강력한 시장 분석 도구입니다. 이 도구는 수학적 개념과 간 이론을 사용하여 정확한 시장 분석을 수행합니다. 144, 90, 52의 제곱과 9의 제곱을 사용합니다. 또한 의 9의 제곱근 및 해당 제곱의 채널 및 스타 패턴과의 관련성을 통합합니다. 사용자 메뉴얼 및 적용: 이 지표를 사용하기 전에 사용자 메뉴얼을 읽고 질문이 있을 경우 문의하시기 바랍니다. 전체 메뉴얼은 웹사이트에서 제공됩니다. MT5의 전체 버전을 구매하거나 MT4의 무료 버전을 테스트할 수 있습니다. 두 버전 모두 링크에서 확인하실 수 있습니다. 주요 기능 및 기능: 간 스퀘어 지표는 정확한 결정을 위해 기하학적 개념과 간 이론을 활용하는 시장 분석을 위한 포괄적인 도구 집합을 제공합니다. 주요 기능은 다음과 같습니다. 9의 제곱 분석:   이 지표는 9의 제곱에 대한 수평 선, 스타 패턴, 그리드 및 간 팬을 그릴 수 있습니다. 간
Easy Breakout MT5
Mohamed Hassan
5 (3)
After your purchase, feel free to contact me for more details on how to receive a bonus indicator called VFI, which pairs perfectly with Easy Breakout for enhanced confluence!     Easy Breakout MT5   is a powerful price action trading system built on one of the most popular and widely trusted strategies among traders: the   Breakout strategy ! This indicator delivers crystal-clear Buy and Sell signals based on breakouts from key support and resistance zones. Unlike typical breakout indicators
Berma Bands
Muhammad Elbermawi
5 (3)
Berma Bands(BBs) 지표는 시장 동향을 파악하고 이를 활용하려는 트레이더에게 귀중한 도구입니다. 가격과 BBs 간의 관계를 분석함으로써 트레이더는 시장이 추세 단계인지 범위 단계인지를 분별할 수 있습니다. 자세한 내용을 알아보려면 [ Berma Home Blog ]를 방문하세요. 버마 밴드는 세 개의 뚜렷한 선으로 구성되어 있습니다. 어퍼 버마 밴드, 미들 버마 밴드, 로어 버마 밴드입니다. 이 선들은 가격 주위에 그려져 전체 추세에 대한 가격 움직임을 시각적으로 표현합니다. 이 밴드들 사이의 거리는 변동성과 잠재적인 추세 반전에 대한 통찰력을 제공할 수 있습니다. 버마 밴드 라인이 각각에서 분리될 때, 그것은 종종 시장이 횡보 또는 범위 이동 기간에 접어들고 있음을 시사합니다. 이는 명확한 방향 편향이 없음을 나타냅니다. 트레이더는 이러한 기간 동안 추세를 파악하기 어려울 수 있으며 더 명확한 추세가 나타날 때까지 기다릴 수 있습니다. 버마 밴드 라인이 단일 라인으로
Royal Scalping Indicator M5
Vahidreza Heidar Gholami
5 (6)
Royal Scalping Indicator is an advanced price adaptive indicator designed to generate high-quality trading signals. Built-in multi-timeframe and multi-currency capabilities make it even more powerful to have configurations based on different symbols and timeframes. This indicator is perfect for scalp trades as well as swing trades. Royal Scalping is not just an indicator, but a trading strategy itself. Features Price Adaptive Trend Detector Algorithm Multi-Timeframe and Multi-Currency Trend Low
ICT, SMC, SMART MONEY CONCEPTS, SMART MONEY, Smart Money Concept, Support and Resistance, Trend Analysis, Price Action, Market Structure, Order Blocks, BOS/CHoCH,   Breaker Blocks ,  Momentum Shift,   Supply&Demand Zone/Order Blocks , Strong Imbalance,   HH/LL/HL/LH,    Fair Value Gap, FVG,  Premium  &   Discount   Zones, Fibonacci Retracement, OTE, Buy Side Liquidity, Sell Side Liquidity, BSL/SSL Taken, Equal Highs & Lows, MTF Dashboard, Multiple Time Frame, BigBar, HTF OB, HTF Market Structure
Basic Supply Demand Dashboard MT5
Mehran Sepah Mansoor
5 (1)
이 대시보드는 선택한 기호에 대한 거래 전략에 따라 스캘핑 모드와 장기 모드 모두에서 차트의 공급 및 수요 영역을 검색하고 표시합니다. 또한 대시보드의 스캐너 모드를 통해 원하는 모든 기호를 한눈에 확인하고 적합한 위치를 놓치지 않도록 도와줍니다 / MT4 버전 . 무료 보조지표:   Basic Supply Demand 특징 여러 통화쌍에 대한 거래 기회를 볼 수 있으며, 공급 및 수요 영역에 대한 근접성에 따라 순위가 매겨진 모든 쌍을 명확하고 간결하게 볼 수 있습니다. 색상부터 감지 매개변수까지 특정 요구에 맞게 사용자 지정 설정 가능 주요 입력 Indicator mode :   표시기 모드 또는 새로운 기능이 포함된 패널 모드 중에서 선택 가능 Symbols :   "28개 주요 통화쌍" 또는 "선택한 심볼" 중에서 선택 Selected Symbols :   쉼표로 구분하여 모니터링하려는 원하는 심볼("EURUSD, GBPUSD, XAUUSD")을 선택합니다. 브로
- Lifetime update free -   Real price is 80$   - 40% Discount ( It is 49$ now ) Contact me for instruction, any questions! Related Product:  Gold Trade Expert MT5 - Non-repaint - I just sell my products in Elif Kaya Profile, any other websites are stolen old versions, So no any new updates or support. Introduction The breakout and retest strategy is traded support and resistance levels. it involves price breaking through a previous level.  The break and retest strategy is designed to help trade
Volumatic VIDyA MT5
Duc Hoan Nguyen
5 (1)
Special offer : ALL TOOLS , just $35 each! New tools   will be   $30   for the   first week   or the   first 3 purchases !  Trading Tools Channel on MQL5 : Join my MQL5 channel to update the latest news from me Volumatic VIDYA (Variable Index Dynamic Average) 는 트렌드를 추적하고 각 트렌드 단계에서 매수 및 매도 압력을 분석하기 위해 설계된 고급 지표입니다. 가변 지수 동적 평균(Variable Index Dynamic Average)을 핵심 동적 평활화 기술로 활용하여 이 도구는 주요 시장 구조 수준에서 가격 및 거래량 역학에 대한 중요한 통찰력을 제공합니다. MT4 버전 보기:  Volumatic VIDyA MT4 다른 제품 보기:    모든 제품 To use iCustom
CONTACT US  after purchase to get the Indicator Manual. Try Now—Limited 50% Discount for First 10 Buyers! Download the  Metatrader 4 Version Due to regulatory restrictions, our service is unavailable in certain countries such as India, Pakistan, and Bangladesh. William Delbert Gann (W.D. Gann) was an exceptional market analyst, whose trading technique was based on a complex blend of mathematics, geometry, astrology, and ancient mathematics which proved to be extremely accurate. A Note from t
제작자의 제품 더 보기
Boom and Crash Sniper Spike Detector - Boom 1000 The Boom and Crash Sniper Spike Detector is the ultimate tool for spike trading on Boom 1000, offering clear and reliable signals to help you capture high-probability trades. This advanced indicator is designed to enhance your trading strategy by simplifying spike detection and maximizing your profits. Key Features: Multi-Timeframe Compatibility : The indicator can be used on M1, M5, M15, M30, and H1 timeframes, but it works best on the M1 timefra
Vix 75 dominus EA
David Chokumanyara
Experience unparalleled trading performance with the VIX 75 Dominus EA, your ultimate solution for dominating the Volatility 75 Index. This fully automated trading robot is designed to optimize your trading strategy on the M15 timeframe, ensuring you capitalize on market movements with precision and efficiency. Whether you're a seasoned trader or a novice, the VIX 75 Dominus EA empowers you to trade smarter, not harder. ### Key Features: - **Optimized for M15 Timeframe**: Tailored for pinpoint
Gold XAUUSD Scalping Indicator The Gold XAUUSD Scalping Indicator is a powerful trend-following tool crafted for traders who specialize in scalping. This indicator is optimized for the M5 timeframe , ensuring precise signals, but it is also versatile enough to be used on M1 and M15 charts to suit various trading strategies. Key Features Trend-Following Accuracy : Identifies high-probability buy and sell opportunities by analyzing trend direction effectively. Multi-Timeframe Compatibility : Best
Spike Detector for Boom and Crash Indices The Spike Detector is specifically designed to cater to the unique needs of traders in the Boom and Crash indices markets. Optimized for M1 (1-minute) and M5 (5-minute) timeframes, this tool ensures you receive timely and actionable insights. Below, you'll find a comprehensive guide on its key features, advantages, installation process, and how to use it effectively. Key Features and Advantages 1. Non-Repainting: The Spike Detector guarantees accurac
Panther Scalping Indicator – Your Ultimate Trading Edge! Maximize Your Profits with the Panther Scalping Indicator! We’ve transformed the powerful Panther Scalping Strategy into an advanced indicator that gives you precise Buy and Sell signals on Deriv’s Synthetic Indices , including Volatility Indices, Step, Jump, and Drift Switching Indices. How It Works: Lime Up Arrow – Clear Buy Signal when market conditions align. Red Down Arrow – Strong Sell Signal to capitalize on downtrends
Introducing the Boom 500 Sniper Spike Detector – an advanced, non-repainting indicator specifically crafted to help you capture spikes in the Boom 500 market with precision. Whether you are an experienced trader or just starting, this indicator provides reliable signals that simplify spike trading, making it an essential addition to your trading arsenal. Key Features: Non-Repainting Signals : The Boom 500 Sniper Spike Detector generates highly reliable signals that do not repaint, allowing you t
Our Spike Detector is specifically engineered to cater to the unique needs of traders in the Boom and Crash indices markets. This tool is optimized for M1 (1-minute) and M5 (5-minute) timeframes, ensuring you receive timely and actionable insights. Key Features: 1. **Non-Repainting**: Our detector guarantees accuracy with non-repainting signals, ensuring your data remains consistent and reliable. 2. **Push Notifications**: Stay updated with real-time push notifications, so you never miss a cri
Our Spike Detector is specifically engineered to cater to the unique needs of traders in the Boom and Crash indices markets. This tool is optimized for M1 (1-minute) and M5 (5-minute) timeframes, ensuring you receive timely and actionable insights. Key Features: 1. Non-Repainting**: Our detector guarantees accuracy with non-repainting signals, ensuring your data remains consistent and reliable. 2. Push Notifications**: Stay updated with real-time push notifications, so you never miss a criti
Crash 1000 Scalping Indicator for the Crash 1000 Deriv Synthetic Index. Introduction The Crash 1000 Scalping Indicator is a specialized tool designed for the Crash 1000 index on the Deriv Synthetic market. This indicator is particularly useful for scalping on the M1 timeframe, helping traders to identify precise entry and exit points for buy positions. It is designed to be non-repainting, providing clear signals with audible alerts and push notifications, and is compatible with mobile devices th
DC Boom 1000 Scalping Strategy Guide **Price**: $30 **Contact**: WhatsApp/Telegram: +27683229304 WhatsApp/Telegram: +27671192993 1. Understanding the Boom 1000 Index Boom 1000 Index: A synthetic index known for generating upward spikes. This strategy focuses on capturing the brief downward movements between spikes by selling when specific signals appear. 2. Timeframe M1 Timeframe: This strategy is exclusively designed for the 1-minute (M1) chart, allowing you to make quick trades and capture sma
Boom 900 Precision Spike Detector The Boom 900 Precision Spike Detector is a powerful tool designed to help traders accurately identify spike opportunities in the Boom 900 market. With advanced features and precise alerts, this indicator takes the guesswork out of trading, enabling you to maximize your profits with confidence. Key Features: Non-Repainting Signals: Get reliable signals without repainting, ensuring your trading decisions are based on accurate, real-time data. Audible Alerts: Stay
Crash 900 Precision Spike Detector The Crash 900 Precision Spike Detector is your ultimate tool for trading the Crash 900 market with precision and confidence. Equipped with advanced features, this indicator helps you identify potential sell opportunities and reversals, making it an essential tool for traders aiming to capture spikes with minimal effort. Key Features: Non-Repainting Signals: Accurate, non-repainting signals that you can trust for reliable trading decisions. Audible Alerts: Stay
Boom 600 Precision Spike Detector The Boom 600 Precision Spike Detector is your ultimate tool for trading the Boom 600 market with precision and confidence. Equipped with advanced features, this indicator helps you identify potential buy opportunities and reversals, making it an essential tool for traders aiming to capture spikes with minimal effort. Key Features: Non-Repainting Signals: Accurate, non-repainting signals that you can trust for reliable trading decisions. Audible Alerts: Stay on t
Crash 600 Precision Spike Detector The Crash 600 Precision Spike Detector is an essential tool designed to help traders navigate the Crash 600 market with accuracy and efficiency. Packed with advanced features, this indicator provides precise alerts that allow traders to capture spikes and reversals with confidence. Key Features: Non-Repainting Signals: Dependable, non-repainting signals that ensure your trading decisions are based on real-time, accurate data. Audible Alerts: Receive sound notif
Boom and Crash Sniper Spike Detector - Boom 900 Unlock the potential of spike trading on Boom 900 with the Boom and Crash Sniper Spike Detector. This cutting-edge indicator provides precise and clear signals, helping you identify high-probability trades and capture spikes effortlessly. Designed for traders who want to enhance their trading performance, this tool simplifies the process of detecting spike opportunities. Key Features: Multi-Timeframe Compatibility : The indicator works across multi
Boom 600 Sniper Spike Detector - MQL5 Listing Description Introducing the Boom 600 Sniper Spike Detector – a cutting-edge, non-repainting indicator designed to help you effectively capitalize on spikes in the Boom 600 market. Ideal for both seasoned traders and beginners, this indicator offers precise, actionable signals to enhance your trading strategy and maximize your profit potential. Key Features: Non-Repainting Signals : Guarantees reliable and consistent signals that do not repaint, provi
Introducing the Boom 300 Sniper Spike Detector – a powerful, non-repainting indicator specifically engineered to help you master spike trading in the Boom 300 market. Whether you're a seasoned trader or new to the game, this tool offers precise and timely signals, allowing you to catch spikes with confidence and improve your overall trading performance. Key Features: Non-Repainting Signals : Ensures consistent and accurate signals that do not repaint, providing you with reliable data to make con
Boom Sniper Scalping Indicator for MQL5 The **Boom Sniper Scalping Indicator** is a highly accurate and reliable tool, specifically crafted for traders aiming to maximize profits in the Boom markets. Whether you're trading Boom 1000, Boom 900, Boom 600, Boom 500, or Boom 300 indices, this indicator provides precision signals to streamline your scalping strategy. With a focus on accuracy and efficiency, it is an indispensable asset for traders looking to capitalize on quick market movements. K
Crash Sniper Scalping Indicator for MQL5 The **Crash Sniper Scalping Indicator** is a powerful and reliable tool specifically designed for traders looking to profit from the Crash markets. Whether trading Crash 1000, Crash 900, Crash 600, Crash 500, or Crash 300 indices, this indicator provides high-precision signals to simplify scalping. With its clear visual cues and accuracy, it's an essential tool for traders aiming to capitalize on quick market movements. Key Features: - **Multi-Timefram
The Precision Scalping Indicator is a powerful and versatile trading tool designed to enhance your scalping strategies across various financial markets. Whether you trade forex pairs, commodities like Gold (XAU/USD), cryptocurrencies such as Bitcoin (BTC), or synthetic indices from Deriv, this indicator adapts seamlessly to your trading style. Key Features: Non-Repainting Signals : Ensures signal reliability by displaying fixed signals that don't disappear or repaint. Audible Alerts : Real-time
Panther Scalping Indicator – The Ultimate Trading Weapon for Gold, Forex & BTC! Dominate the Markets with Precision Buy & Sell Signals! We’ve designed the Panther Scalping Indicator to give you an unfair advantage in trading Gold (XAUUSD), Forex pairs, and BTC. This powerful tool is built on the proven Panther Scalping Strategy , ensuring you never miss a high-probability trade. How It Works: Lime Up Arrow – A clear Buy Signal when market conditions align. Red Down Arrow – A strong
필터:
리뷰 없음
리뷰 답변