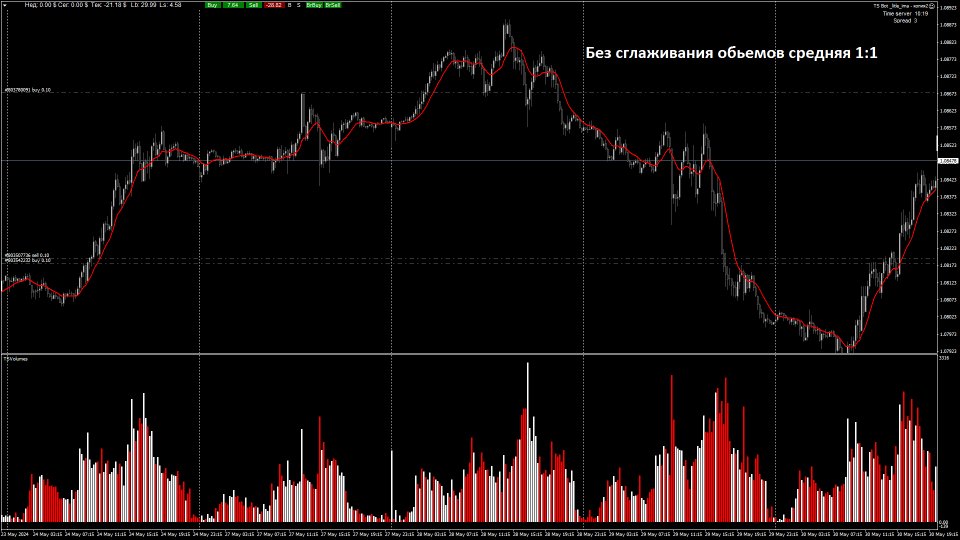
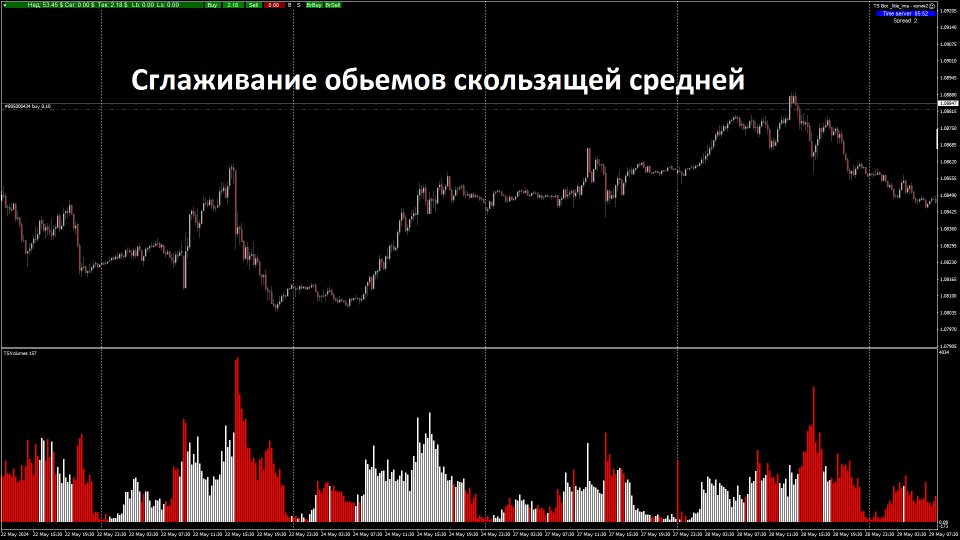
TS Volumes
- 지표
- Sergei Turov
- 버전: 1.1
- 업데이트됨: 5 6월 2024
- 활성화: 10
Advantages of the Tick Volume Indicator:
-
Identifying Market Sentiment:
- A predominance of green bars on the histogram may indicate an uptrend or strong buying pressure, useful for determining entry points for long positions.
- A predominance of red bars indicates a downtrend or strong selling pressure, useful for determining entry points for short positions.
-
Analyzing Market Activity:
- The indicator helps identify periods of high activity, when significant changes are occurring in the market, and periods of calm, when there is little activity.
- High tick volume values often coincide with important market events or news, allowing traders to be prepared for possible market movements.
-
Timely Trading Signals:
- A rapid change in the color of the histogram can serve as a signal to change the trading strategy. For example, if the color changes from green to red, it may signal the beginning of a correction or trend reversal.
How to Use the Tick Volume Indicator:
- Monitoring Color Changes: Traders should pay attention to changes in the color of the histogram, which can indicate a shift in market sentiment.
- Combining with Other Indicators: To increase forecast accuracy, the tick volume indicator can be used in combination with other technical indicators such as moving averages, RSI, MACD, and others.
- Analyzing Extreme Values: Extremely high tick volume values can indicate possible market reversal points or significant price movements.
The tick volume indicator is an important tool for analyzing market activity and can significantly assist traders in making informed decisions based on current market data.


