BullsBearsPulse
- 지표
- Javier Diaz Perete
- 버전: 1.0
- 활성화: 5
Description of the Indicator
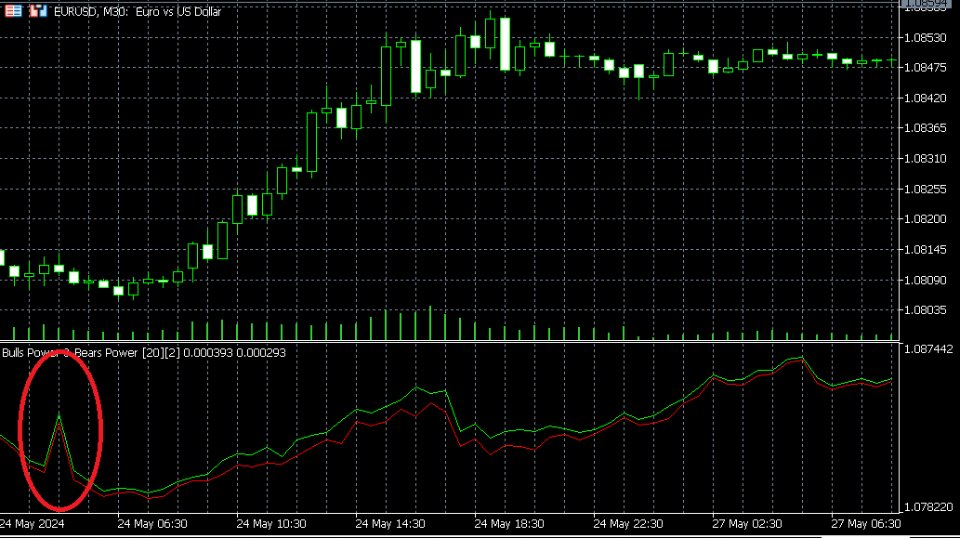
The indicator "BullsBearsPulse" is designed for MetaTrader 5 and provides a visual representation of the Bulls Power and Bears Power indicators. These indicators are useful tools for technical analysis, particularly for the EUR/USD currency pair, to help traders identify potential trading opportunities.
Functionality
-
Bulls Power: This indicator measures the strength of the bulls (buyers) in the market. It calculates the difference between the highest price and a 20-period Exponential Moving Average (EMA) of the closing prices. This value is plotted as a lime-colored line on a separate indicator window.
-
Bears Power: This indicator measures the strength of the bears (sellers) in the market. It calculates the difference between the lowest price and a 20-period EMA of the closing prices. This value is plotted as a red-colored line on a separate indicator window.
How It Works
- EMA Calculation: The indicator calculates a 20-period EMA of the closing prices.
- Bulls Power Calculation: For each bar, the indicator calculates the difference between the highest price and the EMA, representing the strength of the bulls.
- Bears Power Calculation: Similarly, it calculates the difference between the lowest price and the EMA for each bar, representing the strength of the bears.
- Plotting: These values are then plotted on a separate window, with the Bulls Power shown as a lime line and the Bears Power shown as a red line. The lines are shifted by 2 periods to the right to help with future trend analysis.
Utility for EUR/USD Trading
This indicator can be particularly useful for trading the EUR/USD currency pair by providing insights into market sentiment and potential reversal points:
-
Identifying Overbought/Oversold Conditions: When the Bulls Power value is significantly high, it indicates that the market might be overbought. Conversely, when the Bears Power value is significantly low, it suggests that the market might be oversold.
-
Trend Confirmation: If both Bulls Power and Bears Power are increasing, it confirms a strong bullish trend. If both are decreasing, it confirms a strong bearish trend.
-
Divergence Analysis: Traders can look for divergences between the price and the Bulls/Bears Power indicators. For instance, if the price is making higher highs but the Bulls Power is making lower highs, it could indicate a weakening bullish trend and a potential reversal.
How to Interpret
-
Positive Bulls Power: Indicates that the bulls are in control, and the price is above the EMA. This is a bullish signal.
-
Negative Bears Power: Indicates that the bears are in control, and the price is below the EMA. This is a bearish signal.
-
Crossovers: When the Bulls Power crosses above the zero line, it suggests a potential buying opportunity. When the Bears Power crosses below the zero line, it suggests a potential selling opportunity.
By using this indicator, traders can gain a better understanding of the underlying market dynamics and make more informed trading decisions for the EUR/USD pair.


