MinMax Levels MT5
- 지표
- Ivan Butko
- 버전: 1.0
- 활성화: 20
MinMax Levels
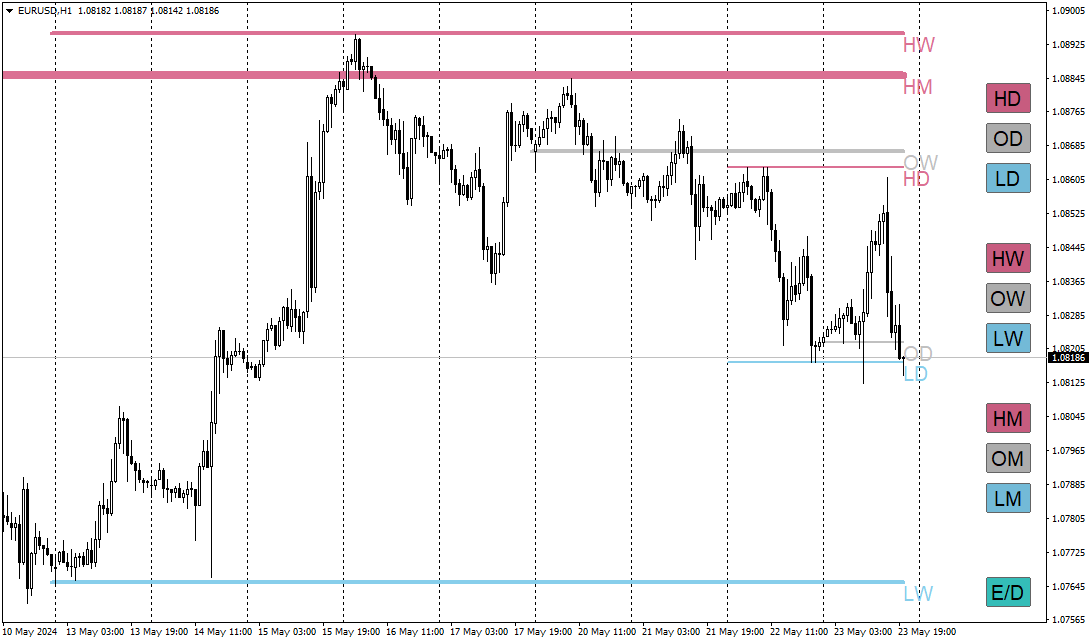
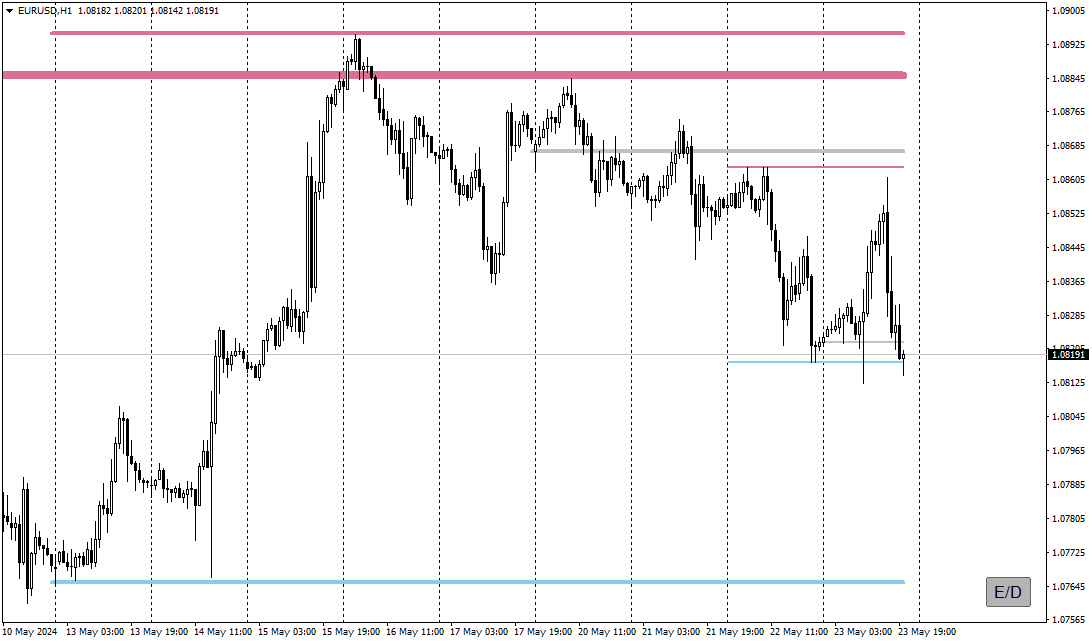
MinMax Levels – 은 중요한 거래 기간(일, 주, 월)의 최대, 최소 및 시가 수준을 나타내는 지표입니다.
각 Forex 시장 참가자는 거래 시스템에서 레벨을 사용합니다. 이는 거래를 위한 주요 신호일 수도 있고 분석 도구 역할을 하는 추가 신호일 수도 있습니다.
이 지표에서는 대규모 시장 참여자의 주요 거래 기간인 일, 주, 월을 중요한 기간으로 선택했습니다. 아시다시피 가격은 수준에서 수준으로 이동하며 중요한 수준과 관련된 가격 위치에 대한 지식은 거래 결정을 내리는 데 이점을 제공합니다.
편의를 위해 두 레벨 자체를 활성화 및 비활성화하고 버튼을 축소하여 가격 차트 작업 창에서 공간을 확보할 수 있는 버튼이 추가되었습니다.
각 Forex 시장 참가자는 거래 시스템에서 레벨을 사용합니다. 이는 거래를 위한 주요 신호일 수도 있고 분석 도구 역할을 하는 추가 신호일 수도 있습니다.
이 지표에서는 대규모 시장 참여자의 주요 거래 기간인 일, 주, 월을 중요한 기간으로 선택했습니다. 아시다시피 가격은 수준에서 수준으로 이동하며 중요한 수준과 관련된 가격 위치에 대한 지식은 거래 결정을 내리는 데 이점을 제공합니다.
편의를 위해 두 레벨 자체를 활성화 및 비활성화하고 버튼을 축소하여 가격 차트 작업 창에서 공간을 확보할 수 있는 버튼이 추가되었습니다.
이 지표의 장점:
- 편의
- 시계
- 정보 내용
- 최신 레벨
- 맞춤형 레벨
사용자 정의 가능한 수준은 차트에서 직접 비활성화할 수 있으며 버튼 자체를 최소화하여 차트 작업 공간을 확보할 수 있습니다.
이제 MinMax 레벨 지표를 기반으로 하거나 이를 기반으로 하는 모든 거래 전략에는 추가 신호가 있습니다.
또한 일, 주, 월의 최고점, 최저점 및 시가는 지지 및 저항 수준으로 작용할 수 있습니다. 그리고 일부 거래 전략에서는 유동성 수준을 표시합니다.
거래 시스템에 추가로 MinMax 레벨 표시기를 사용하십시오.
시장에 있는 다른 제품도 사용해 보세요 https://www.mql5.com/ru/users/capitalplus/seller
거래에서 큰 이익을 얻으시기 바랍니다!