Market Noise MT4
- 지표
- Ivan Butko
- 버전: 1.2
- 업데이트됨: 29 5월 2024
- 활성화: 10
Market Noise
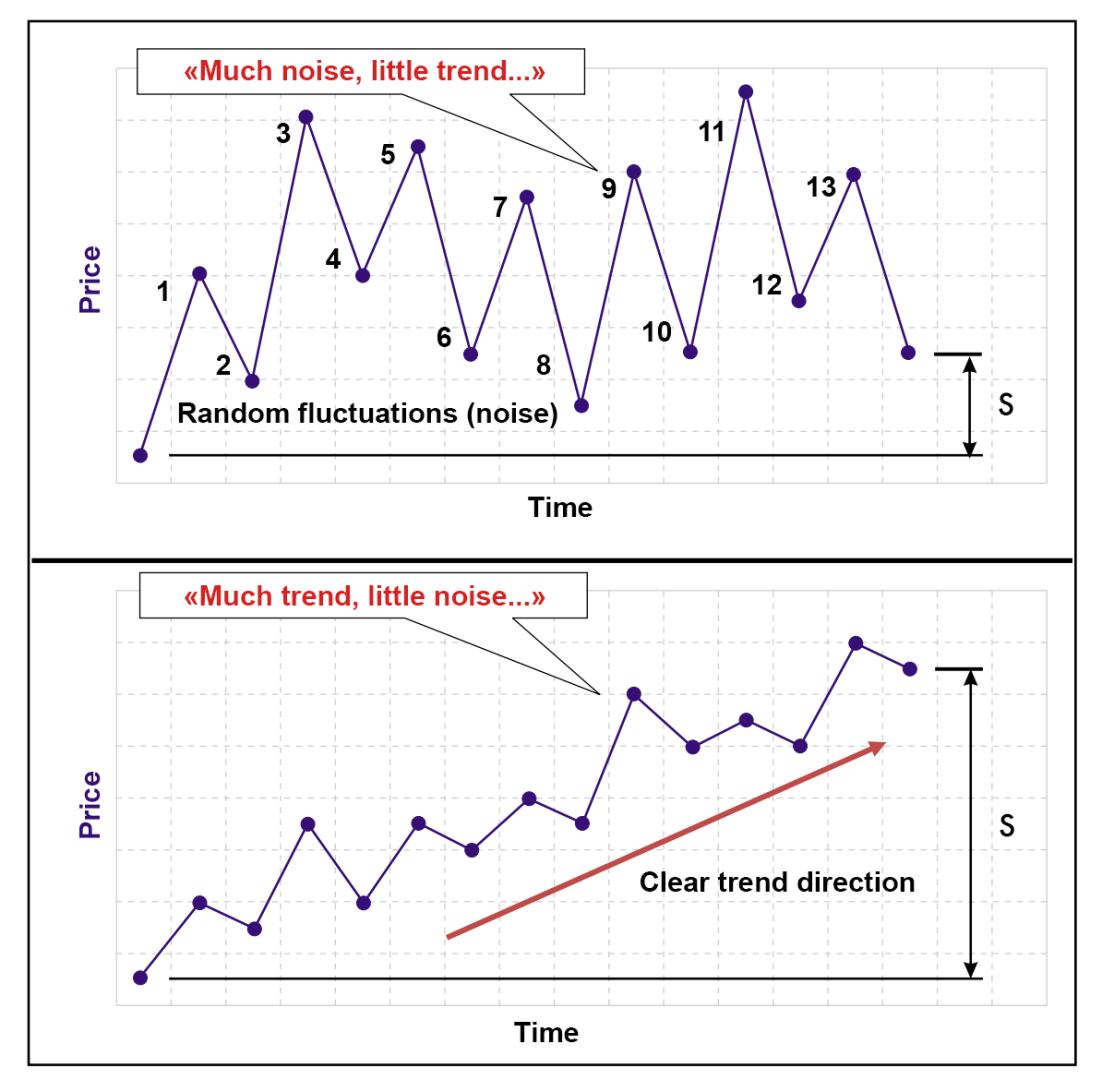
시장 노이즈는 가격 차트에서 시장 단계를 결정하는 지표이며, 축적 또는 분산 단계가 발생할 때 분명하고 부드러운 추세 움직임과 시끄러운 평탄한 움직임을 구별합니다.
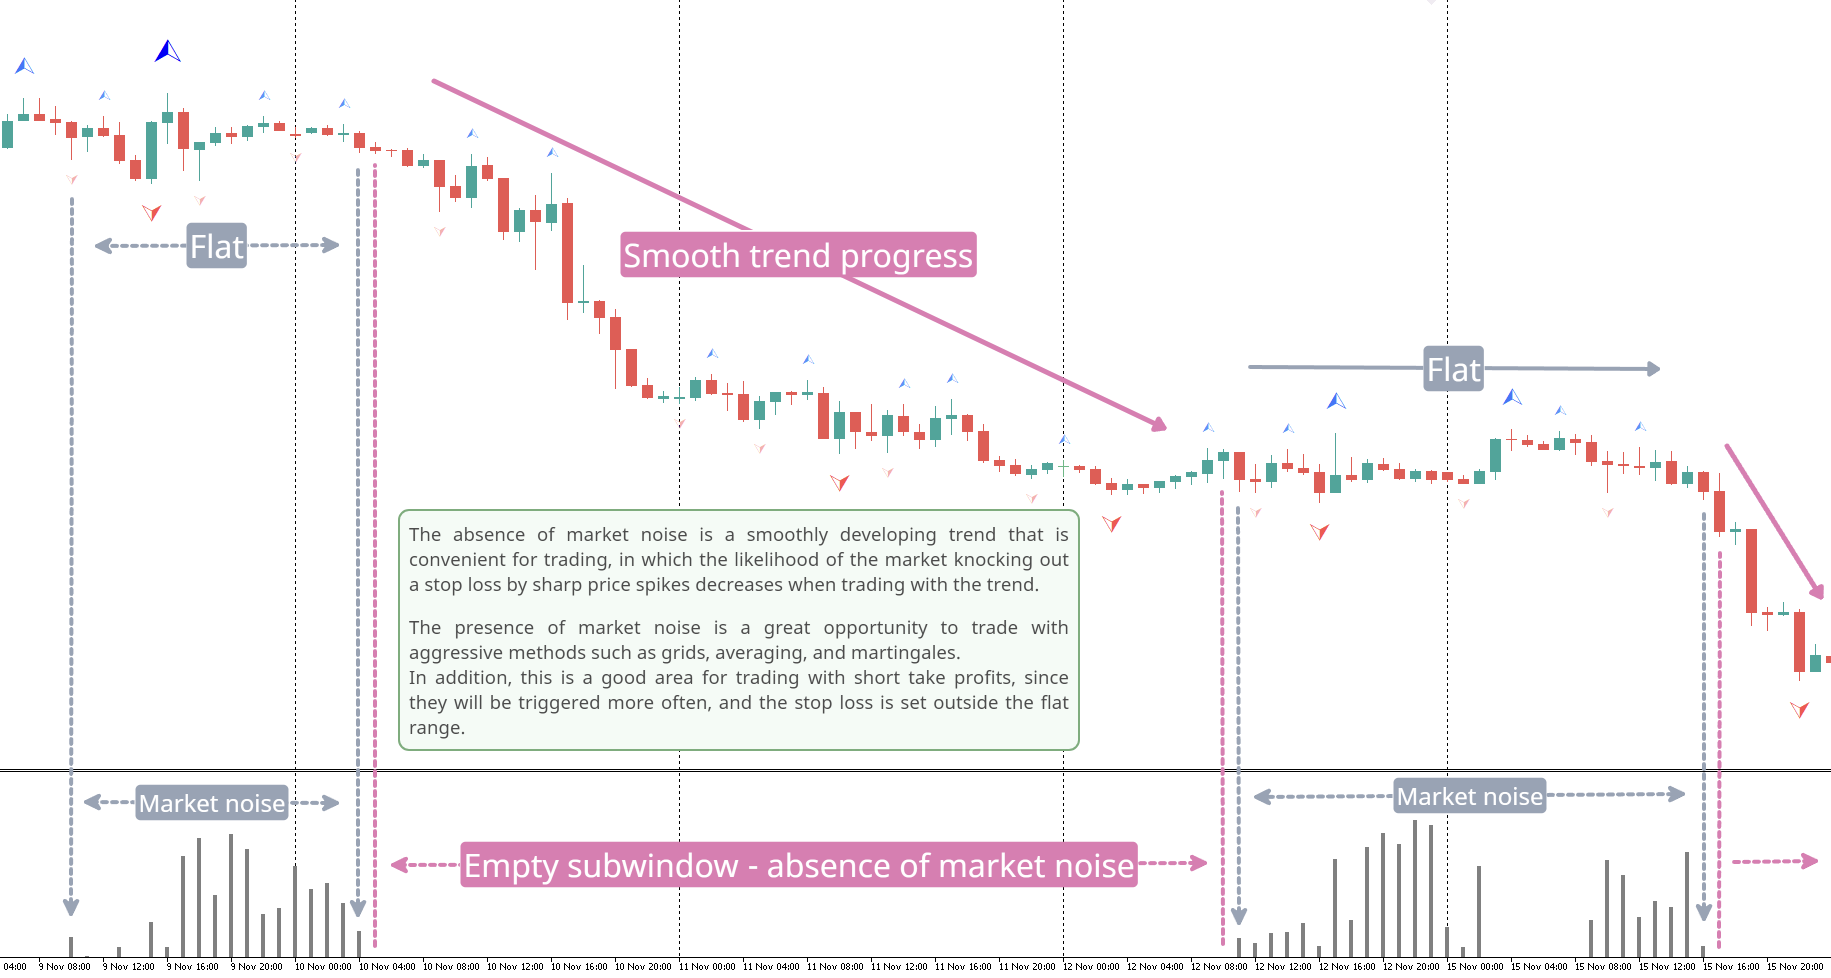
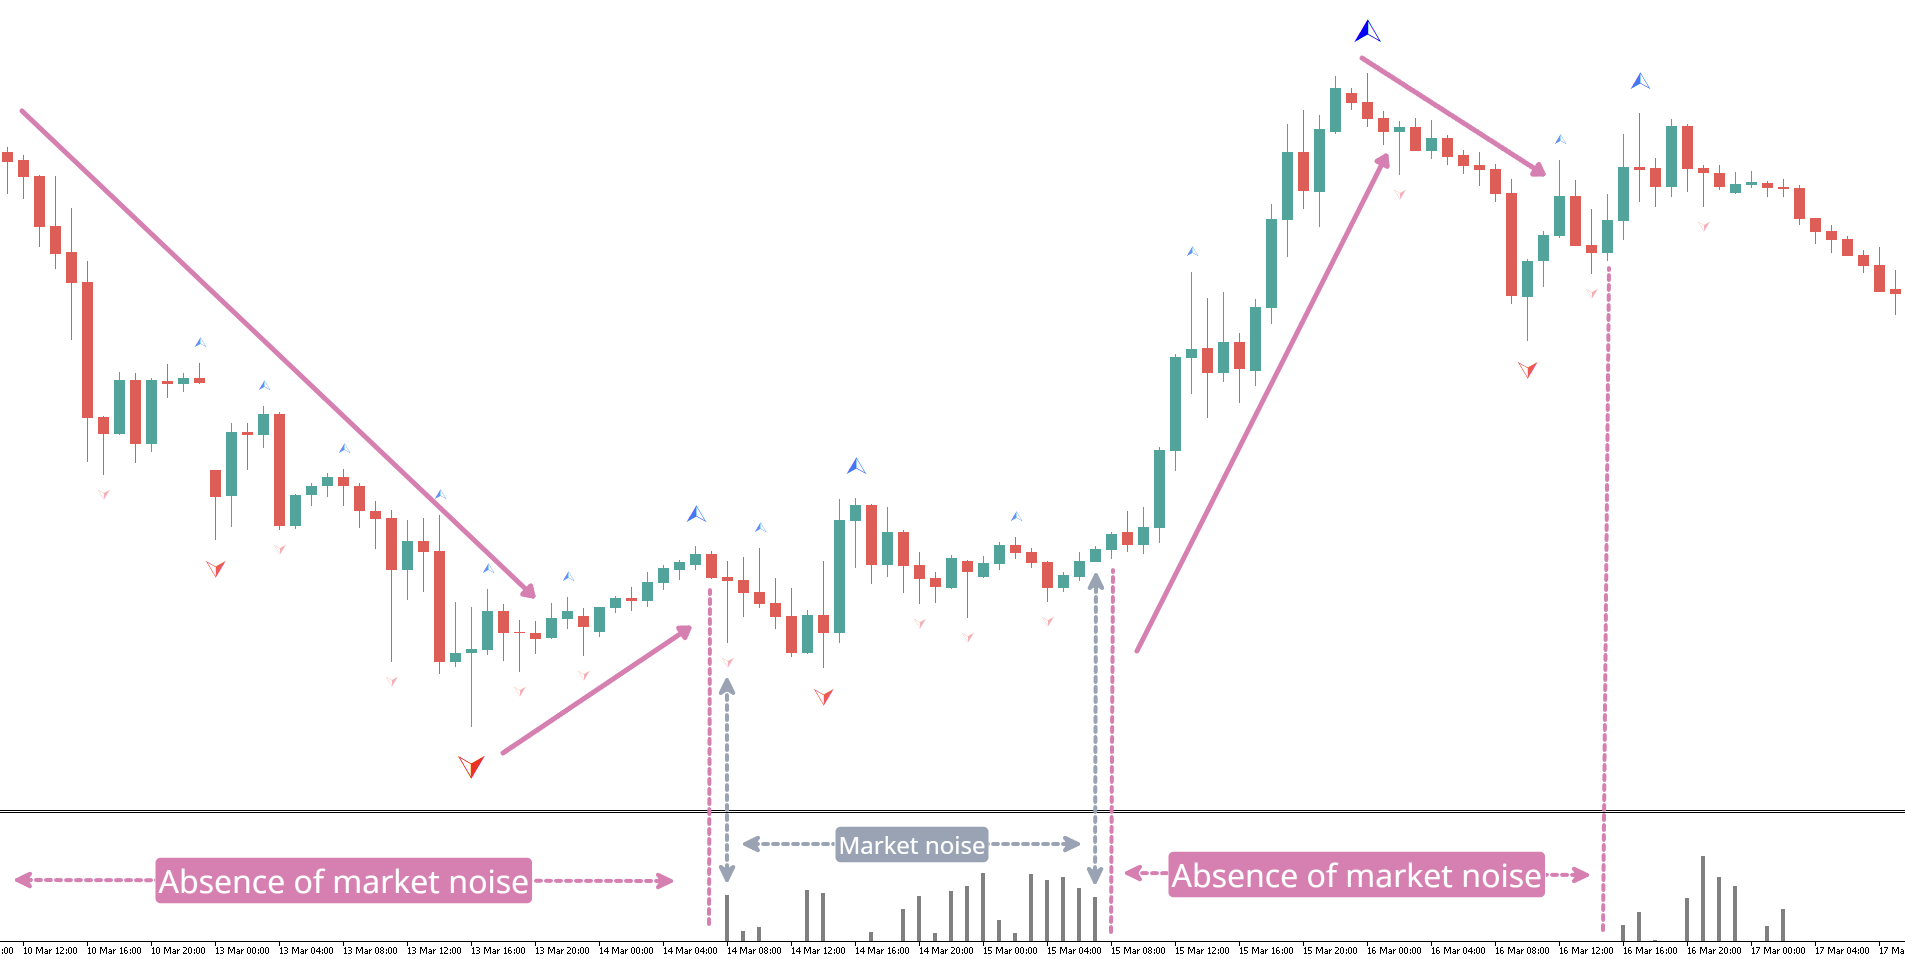
각 단계는 자체적인 거래 유형에 적합합니다. 추세를 따르는 시스템에서는 추세를 따르고, 공격적인 시스템에서는 플랫합니다. 시장 소음이 시작되면 거래 종료를 결정할 수 있습니다. 마찬가지로, 소음이 끝나자마자 공격적인 거래 시스템을 꺼야 합니다. 누군가는 두 가지 유형의 거래 전략을 서로 전환하면서 거래할 수 있습니다. 따라서 이 지표는 거래 결정 분야에서 훌륭한 조력자 역할을 합니다. 모든 가격 변동은 선택한 기간 동안의 일반적인 가격 변동과 해당 기간 내 가격 변동 형태의 노이즈라는 두 가지 구성 요소로 나눌 수 있습니다. 동시에, 서로 다른 기간의 서로 다른 시장은 잡음과 추세 구성 요소 사이의 광범위한 상호 관계를 보여줄 수 있습니다(그림 1). 가격 변동의 소음 수준이 높을수록 기본 추세의 방향과 강도를 식별하기가 더 어려워집니다. 따라서 이 경우에는 더 느린 추세 식별 방법을 사용해야 합니다. 반면, 소음 수준이 낮은 시장에서는 주요 추세가 매우 쉽게 결정되고 추세를 결정하는 더 빠른 방법이 합리적이므로 가격 방향 변화로 인한 거래 신호의 지연을 최소화할 수 있습니다. 시장 상황을 판단하기 위해 특정 기간 동안 총 가격 변동과 소음 시장 변동의 합계를 지수적으로 비교한 고급 효율성 비율(ER)이 사용됩니다. 효율성 비율(ER)은 다양할 수 있습니다. 0에서 1까지. 시장에 방향성 움직임이 없고 잡음만 있을 때 ER 값은 0이 됩니다. ER 값은 시장이 노이즈가 전혀 없는 한 방향으로 움직일 때 1과 같습니다.
장점
- 추세 거래 시스템에 대한 명확한 추세 정의
- 공격적인 시스템(그리드, 평균화, 마틴게일, 시팅아웃) 또는 SL이 높고 TP가 낮은 거래 시스템에 대한 균일한 결정
- 몇 가지 설정 - 막대 단위로 계산 기간만 표시
거래 시스템에 추가로 시장 소음 지표를 사용하십시오.
МТ5 - https://www.mql5.com/ru/market/product/107899
시장에 있는 다른 제품도 사용해 보세요 https://www.mql5.com/ru/users/capitalplus/seller
거래에서 큰 이익을 얻으시기 바랍니다!
사용자가 평가에 대한 코멘트를 남기지 않았습니다
Considering the calculation cycles, filtering, and the current platform - this indicator is slightly more complex than regular oscillators, which is why it is so different with your fast work.