Fractals Dynamic
- 지표
- Ivan Butko
- 버전: 1.0
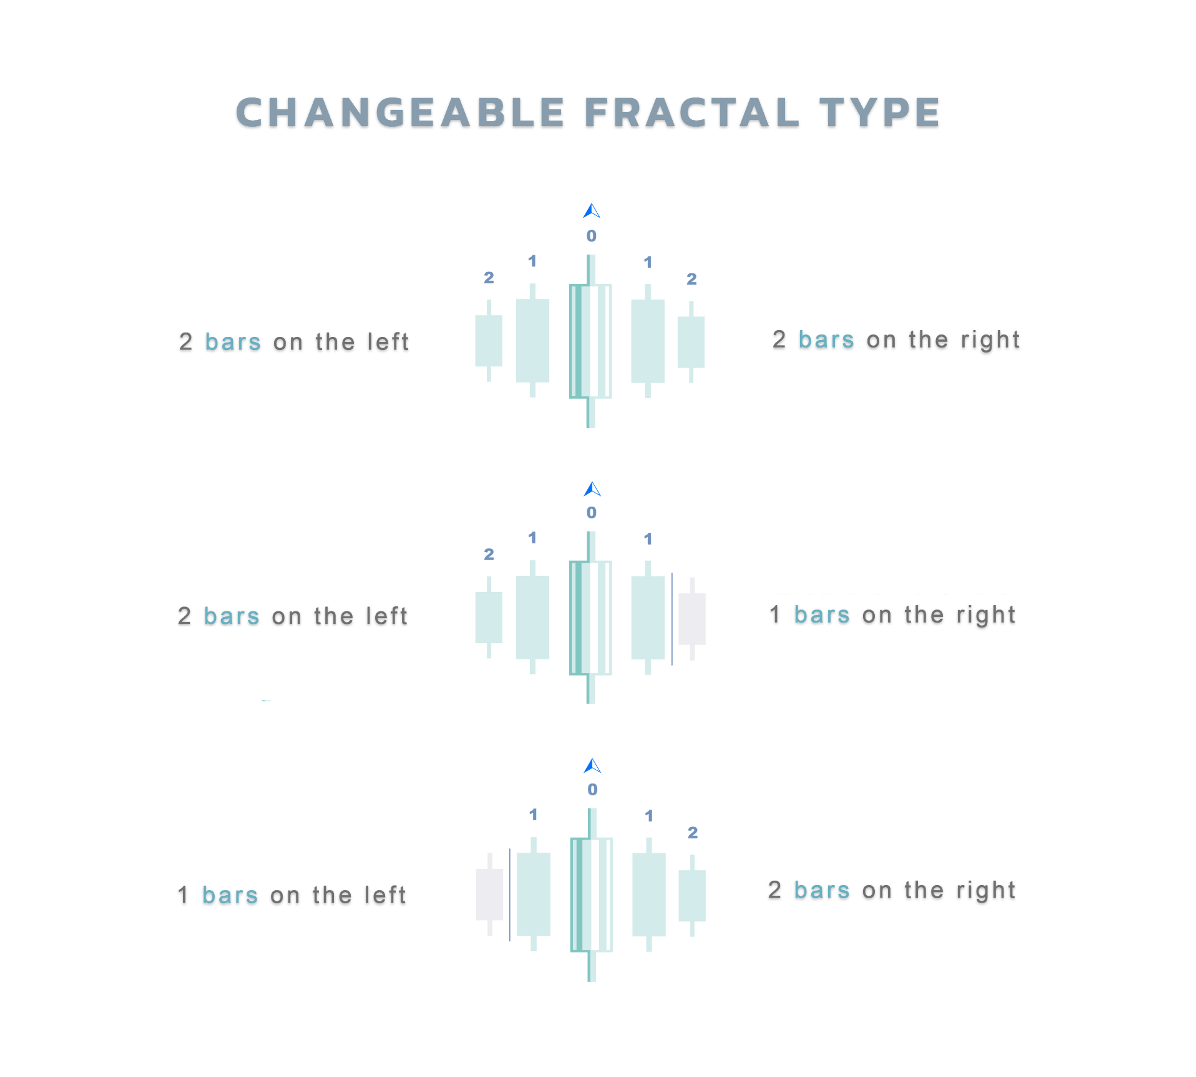
Fractals Dynamic
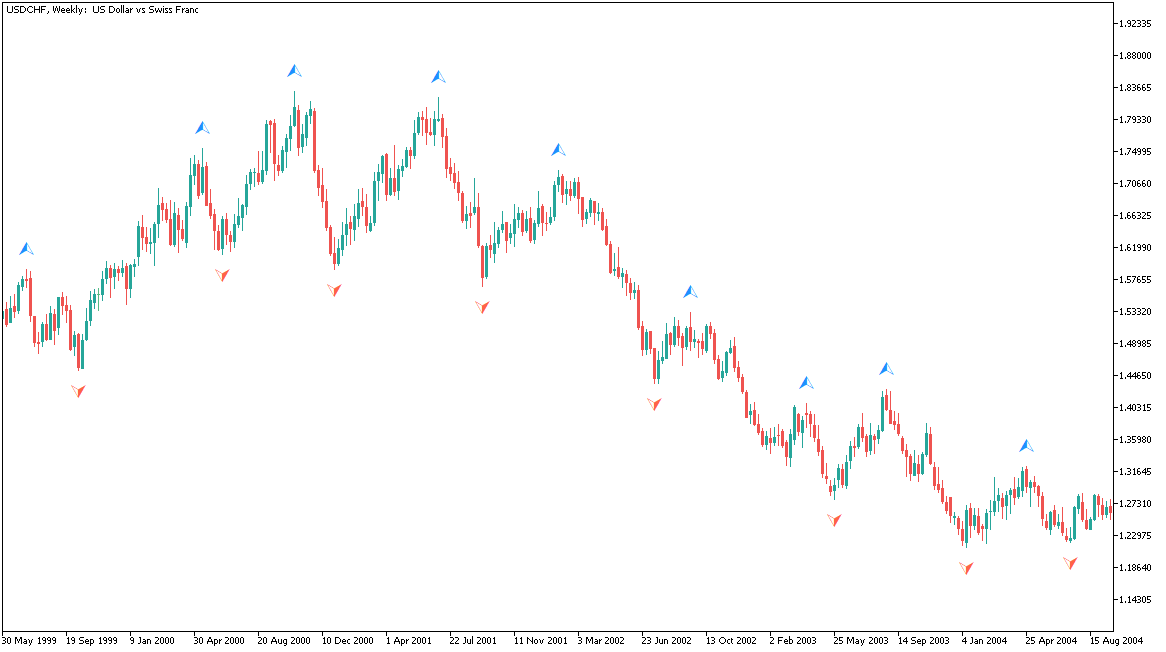
Fractals Dynamic – 이제 프랙탈 동적 표시기를 기반으로하거나 기반으로 한 모든 거래 전략에는 추가 신호가 있습니다.
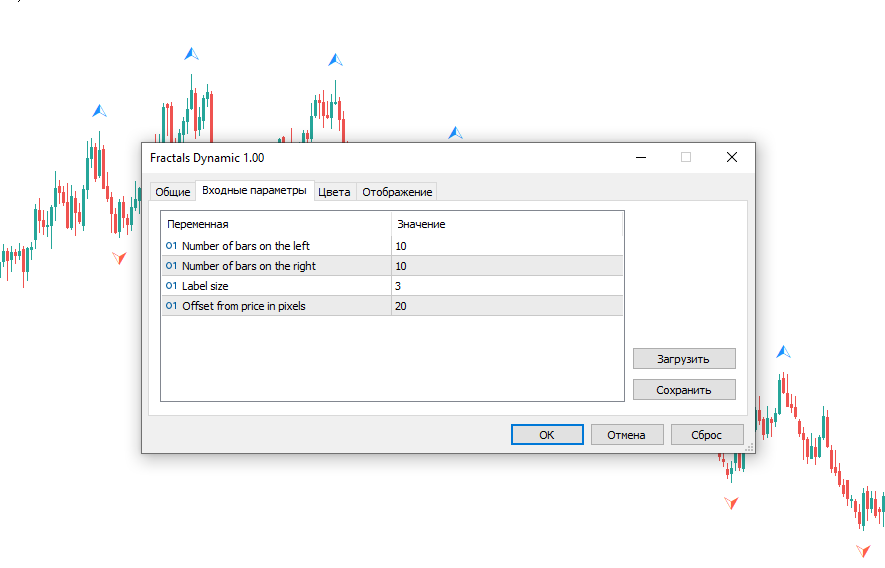
또한 프랙탈은 지원 및 저항 수준으로 작용할 수 있습니다. 그리고 일부 거래 전략에서는 유동성 수준을 보여줍니다. 이를 위해,이 버전의 멀티 프랙탈 및 멀티 프레임 표시기MultiFractal Levels에 레벨이 도입되었습니다. 당신은 어떤 가격 차트에 거래의 조수로 더 많은 정보,시각 및 유용이 표시를 찾을 수 있습니다.
거래 시스템에 추가로 Fractals Dynamic 표시기를 사용하십시오
또한 시장에 내 다른 제품을 사용해보십시오 https://www.mql5.com/ru/users/capitalplus/seller
거래에 당신을 위해 큰 이익!


lo estoy provando, se ve prometedor muchas gracias