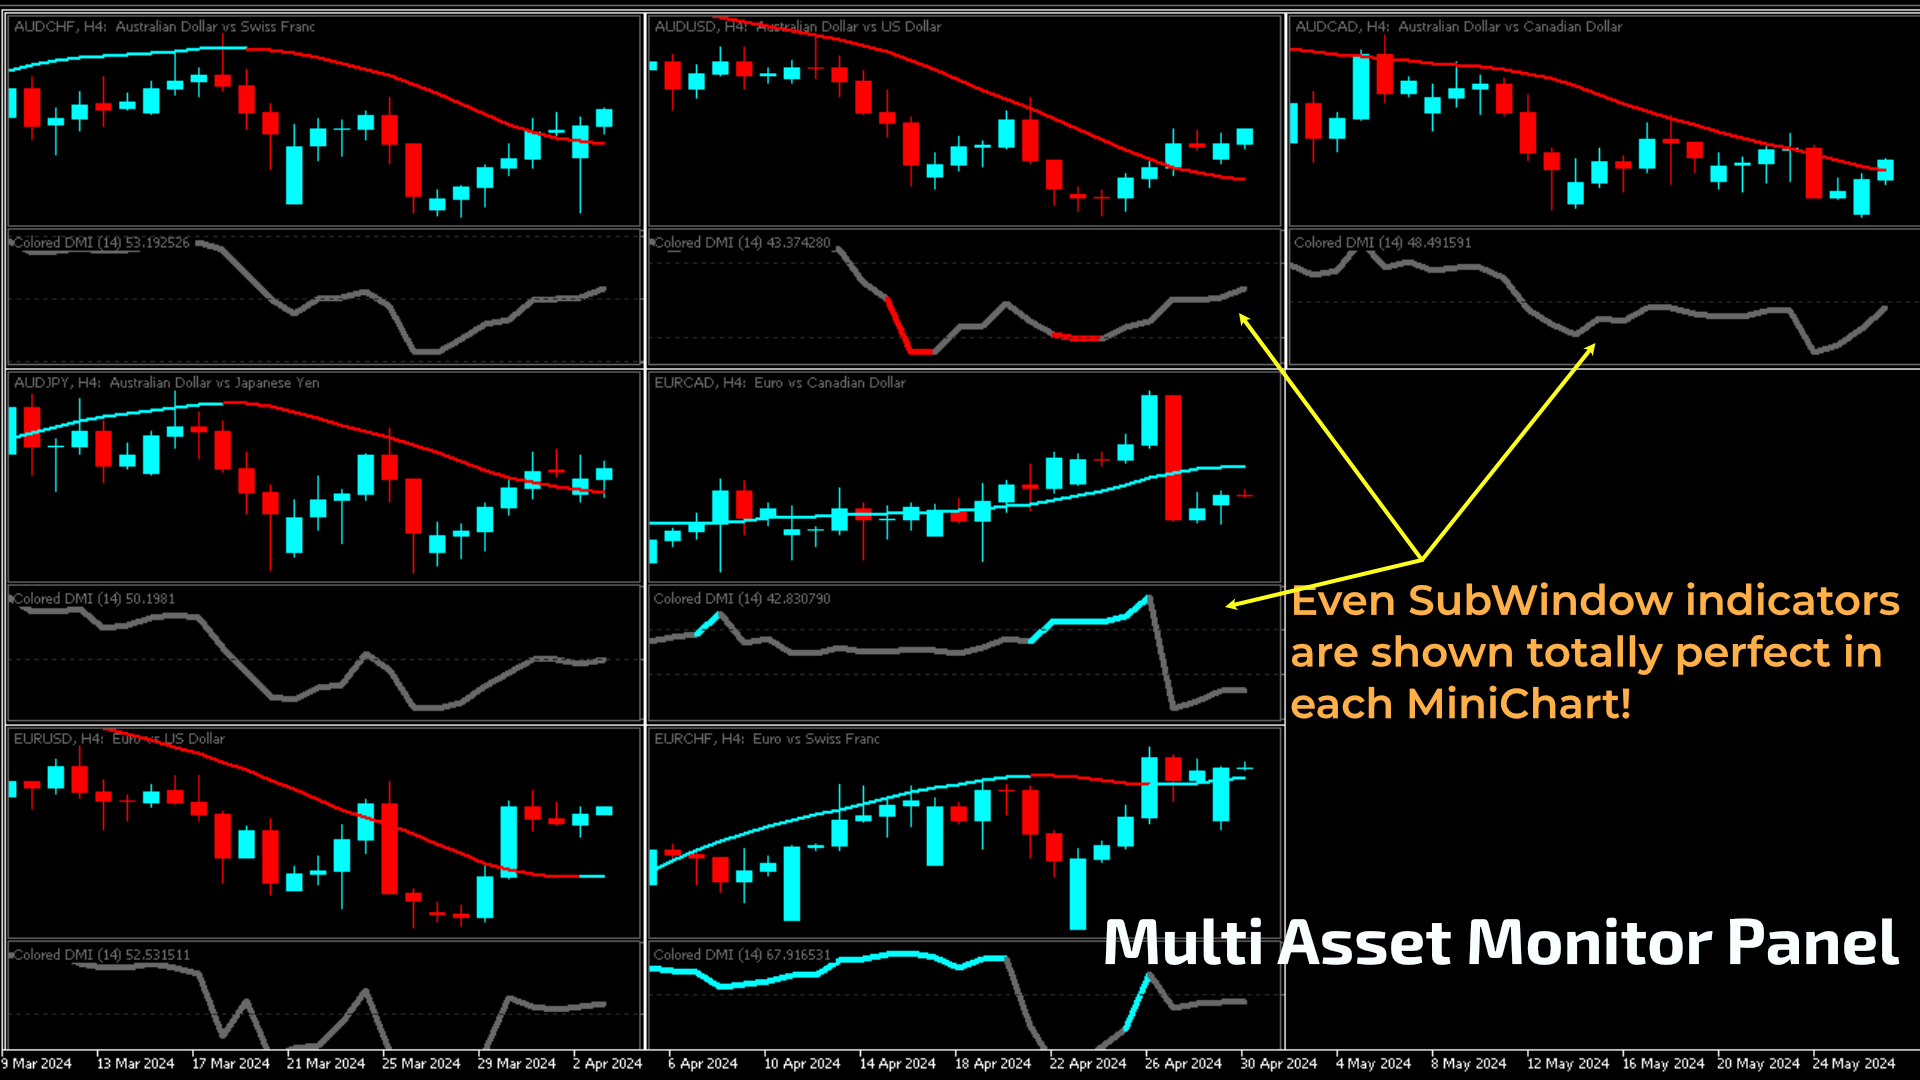
Multi Asset Monitor Panel
- 지표
- Flavio Javier Jarabeck
- 버전: 1.0
- 활성화: 20
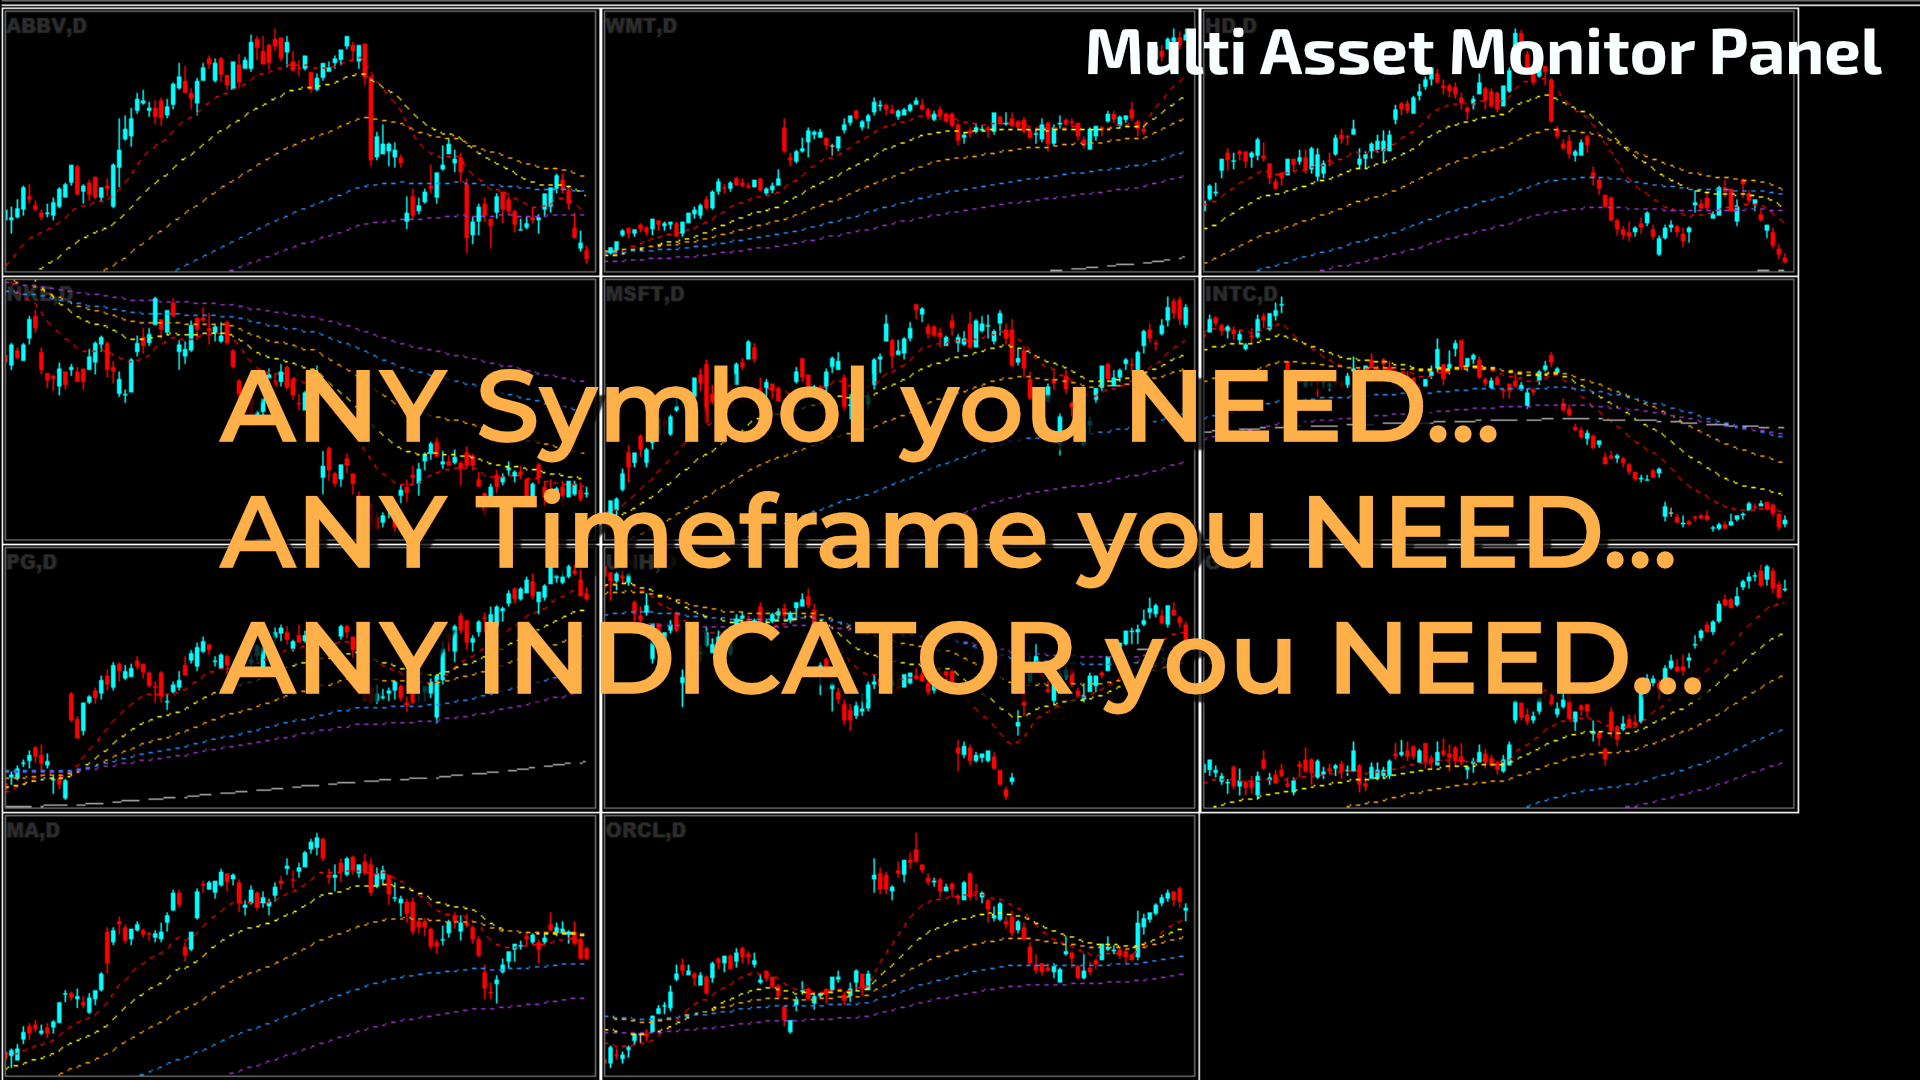
The Multi Asset Monitor Panel is a game-changer for traders who need to keep an eye on multiple markets simultaneously. This innovative panel allows you to monitor any symbol and any timeframe you need, all within a single, organized interface. With up to three lists of symbols and customizable MT5 templates, you can tailor your monitoring setup to fit your specific trading strategy.
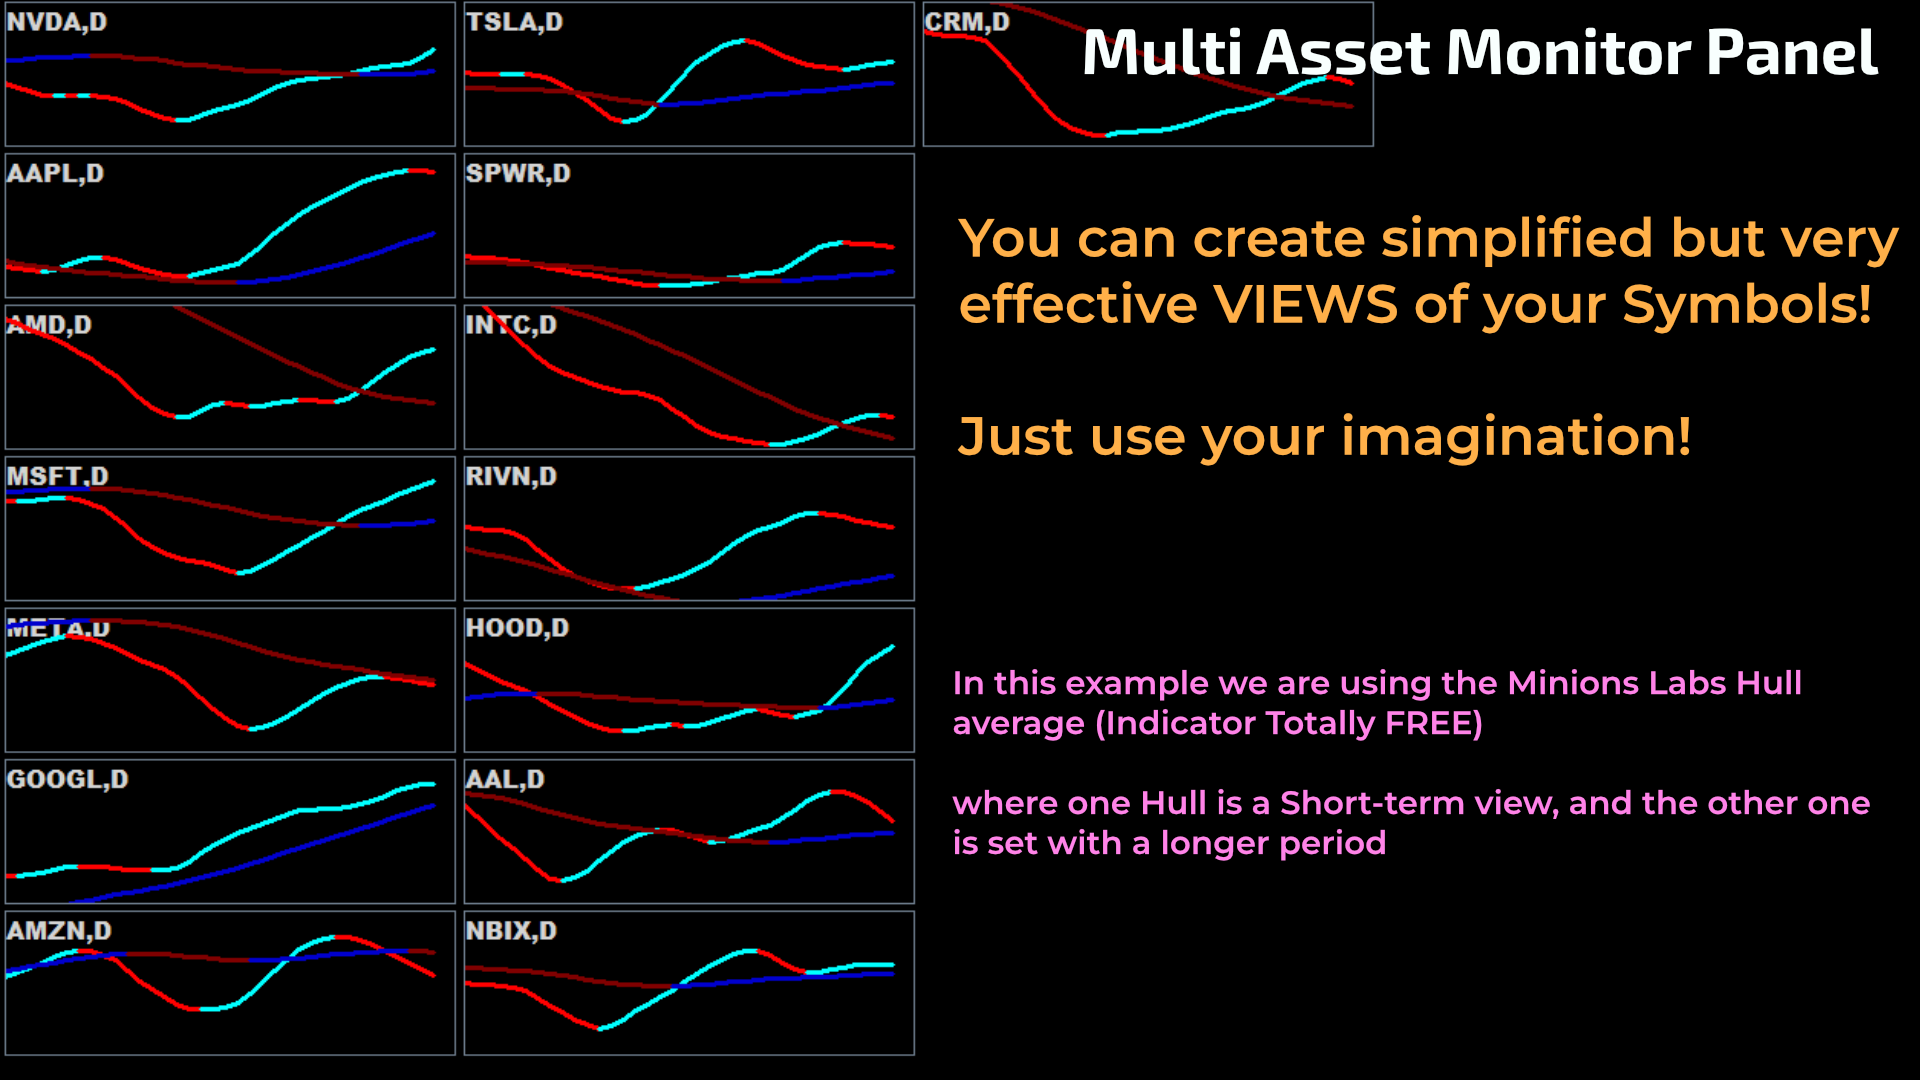
What sets the Multi Asset Monitor Panel apart is its flexibility and customization options. You can control the size and layout of the mini charts, ensuring that your workspace is as efficient as possible. Double-clicking on any mini chart launches a new window with the chosen template, making detailed analysis a breeze. Whether you're tracking stocks, forex, or cryptocurrencies, this panel provides a comprehensive view of market movements at a glance.
Why Should I Care About the Multi Asset Monitor Panel?
The Multi Asset Monitor Panel offers exclusive features that are essential for any serious trader. Its ability to monitor multiple symbols across different timeframes simultaneously means you can spot trends and market opportunities as they happen. This level of insight and responsiveness is crucial in fast-paced trading environments where every second counts.
Additionally, the panel's customizable alerts and clear visualizations help you stay on top of important market changes without missing a beat. The Multi Asset Monitor Panel not only enhances your trading efficiency but also improves your decision-making process by providing a holistic view of the market. It's a must-have tool for traders looking to maximize their profits and stay ahead of the competition.
How Does the Multi Asset Monitor Panel Work?
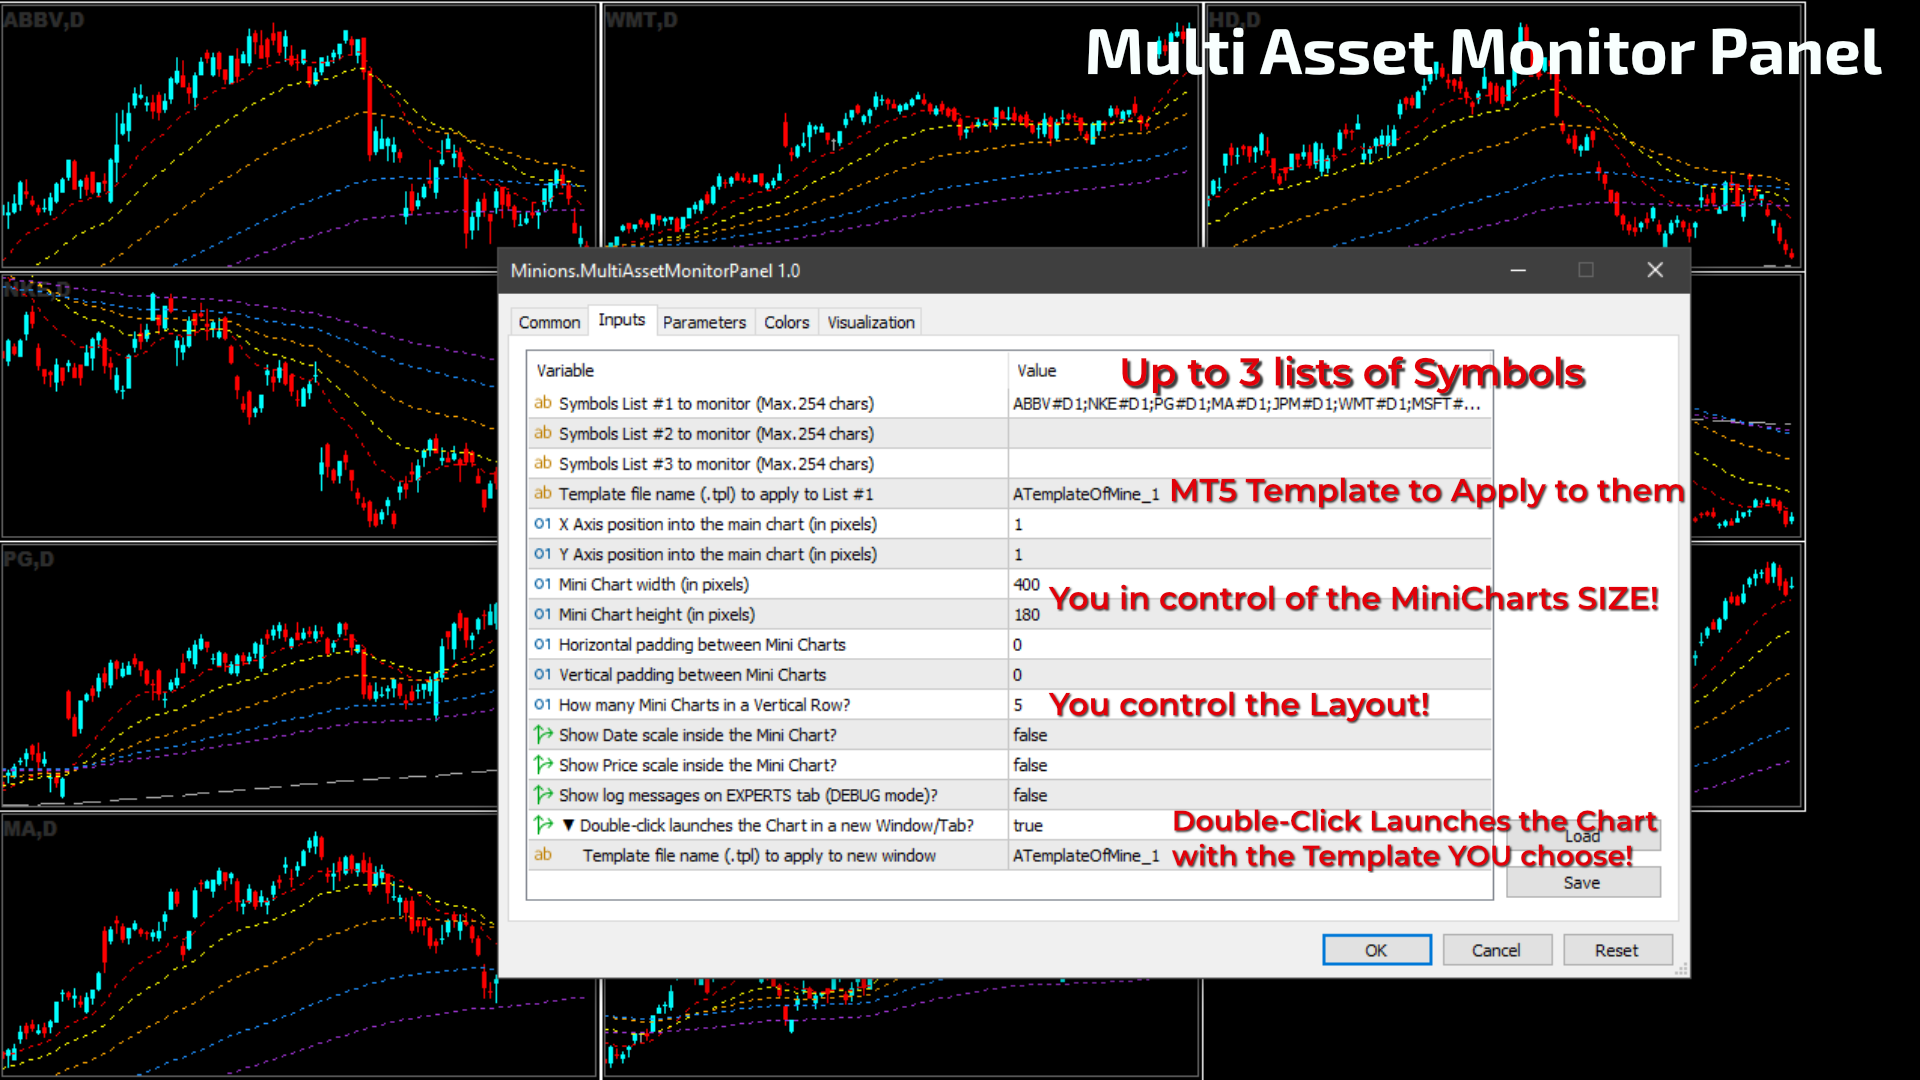
The Multi Asset Monitor Panel works by allowing you to set up to three lists of symbols to monitor. Each list can be customized with specific MT5 templates, providing tailored views of each symbol. The panel displays mini charts for each symbol, and you can control their size, layout, and the information they display, such as date and price scales.
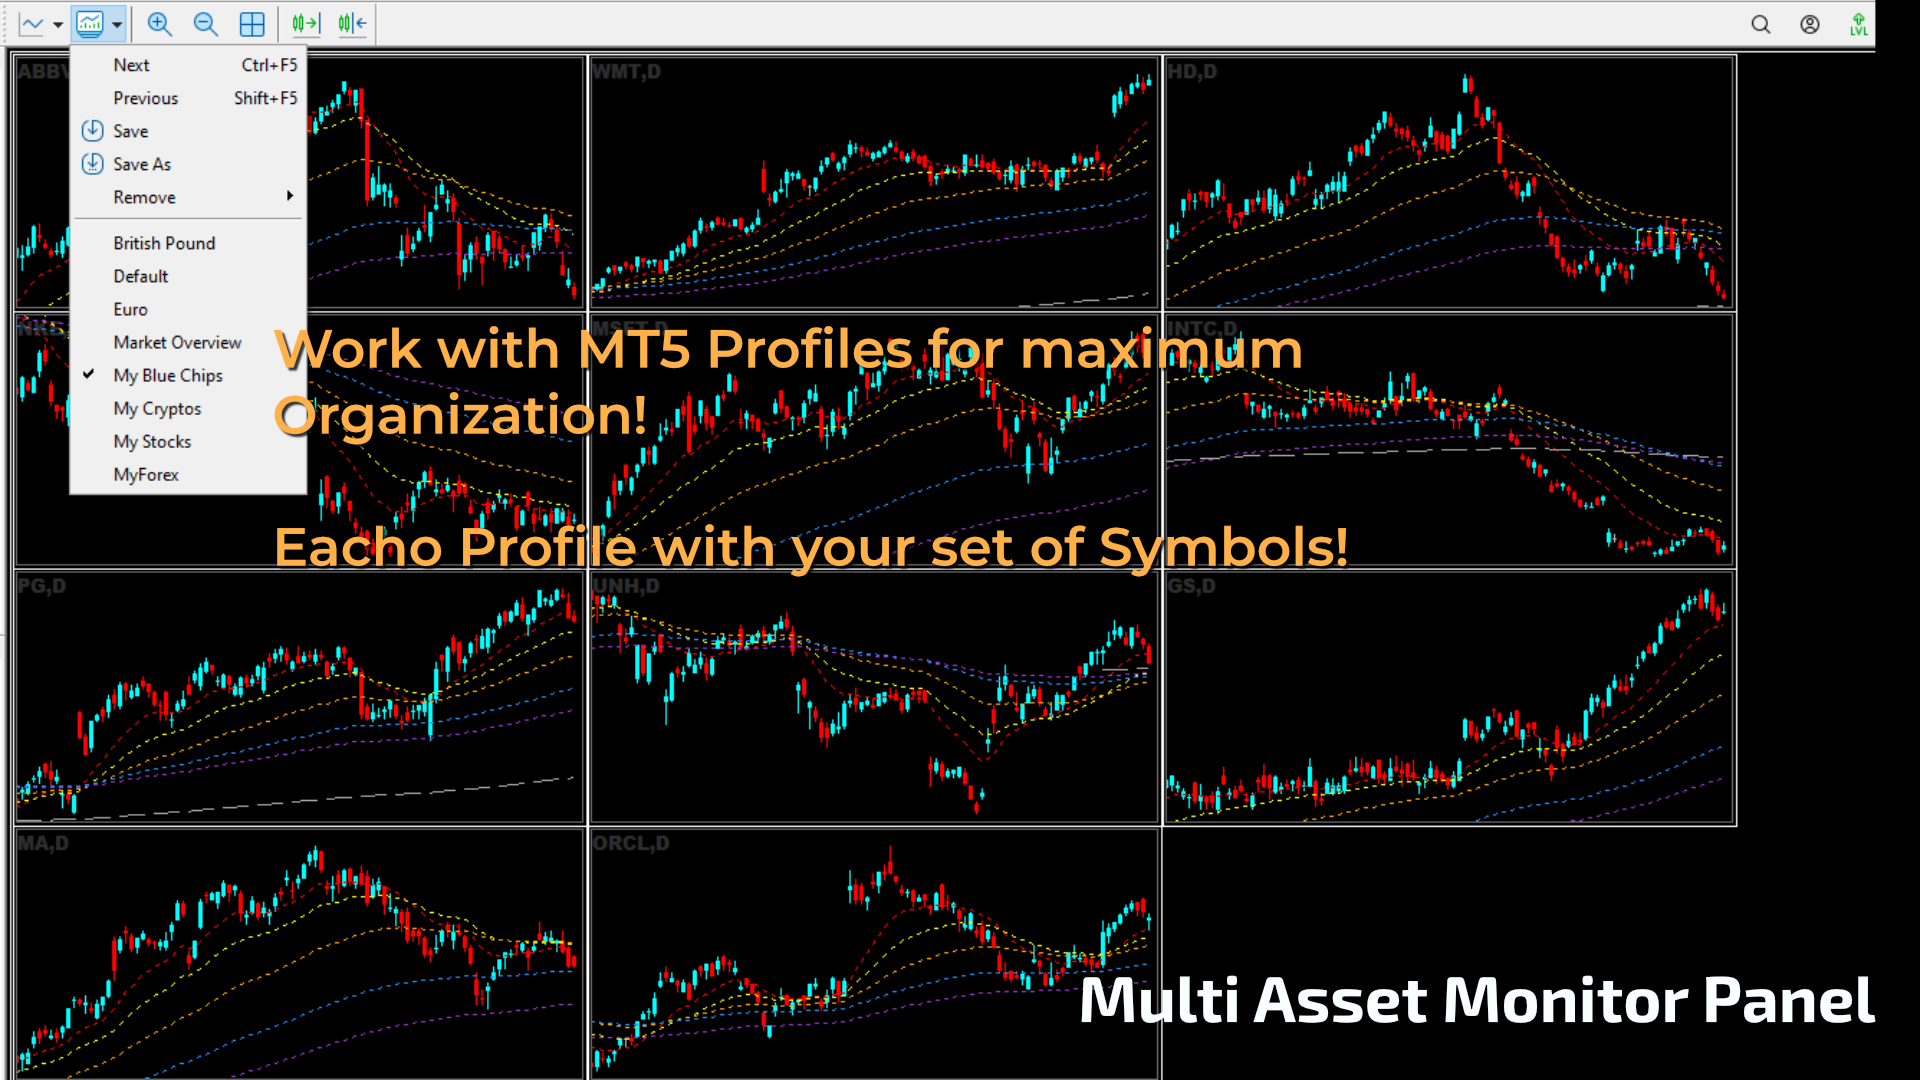
With this panel, you can organize your workspace by aligning the mini charts in rows and columns, adjusting padding, and setting the number of mini charts per row. The integration with MT5 profiles means you can switch between different sets of symbols quickly and efficiently. This feature is especially useful for traders who deal with multiple asset classes. Additionally, subwindow indicators are fully supported, ensuring that you have all the necessary information at your fingertips.
Settings
- Symbols List #1 to monitor (Max. 254 chars)
- Symbols List #2 to monitor (Max. 254 chars)
- Symbols List #3 to monitor (Max. 254 chars)
- Template file name (.tpl) to apply to List #1
- X Axis position into the main chart (in pixels)
- Y Axis position into the main chart (in pixels)
- Mini Chart width (in pixels)
- Mini Chart height (in pixels)
- Horizontal padding between Mini Charts
- Vertical padding between Mini Charts
- How many Mini Charts in a Vertical Row?
- Show Date scale inside the Mini Chart?
- Show Price scale inside the Mini Chart?
- Show log messages on EXPERTS tab (DEBUG mode)?
- Double-click launches the Chart in a new Window/Tab?
- Template file name (.tpl) to apply to new window
Want to Experience This Amazing Indicator for FREE?
Explore our powerful indicator without any cost! MetaTrader 5 offers two ways to test it: a limited demo for backtesting or a full-featured trial through our website, allowing live account testing. Check out this blog post to discover all the testing options and start trading smarter today!
Didn't Find a Feature You Need?
No product is perfect for everyone. If there's a feature you need that you can't find, please reach out to us. We value your feedback!
About Us
Flavio Jarabeck is the owner of MinionsLabs.com, dedicated to enhancing the skills and knowledge of professional traders with advanced trading robots and indicators, enabling them to explore new strategies in various markets and assets.