Levelss
- 지표
- Ivan Stefanov
- 버전: 1.1
- 업데이트됨: 11 6월 2024
- 활성화: 10
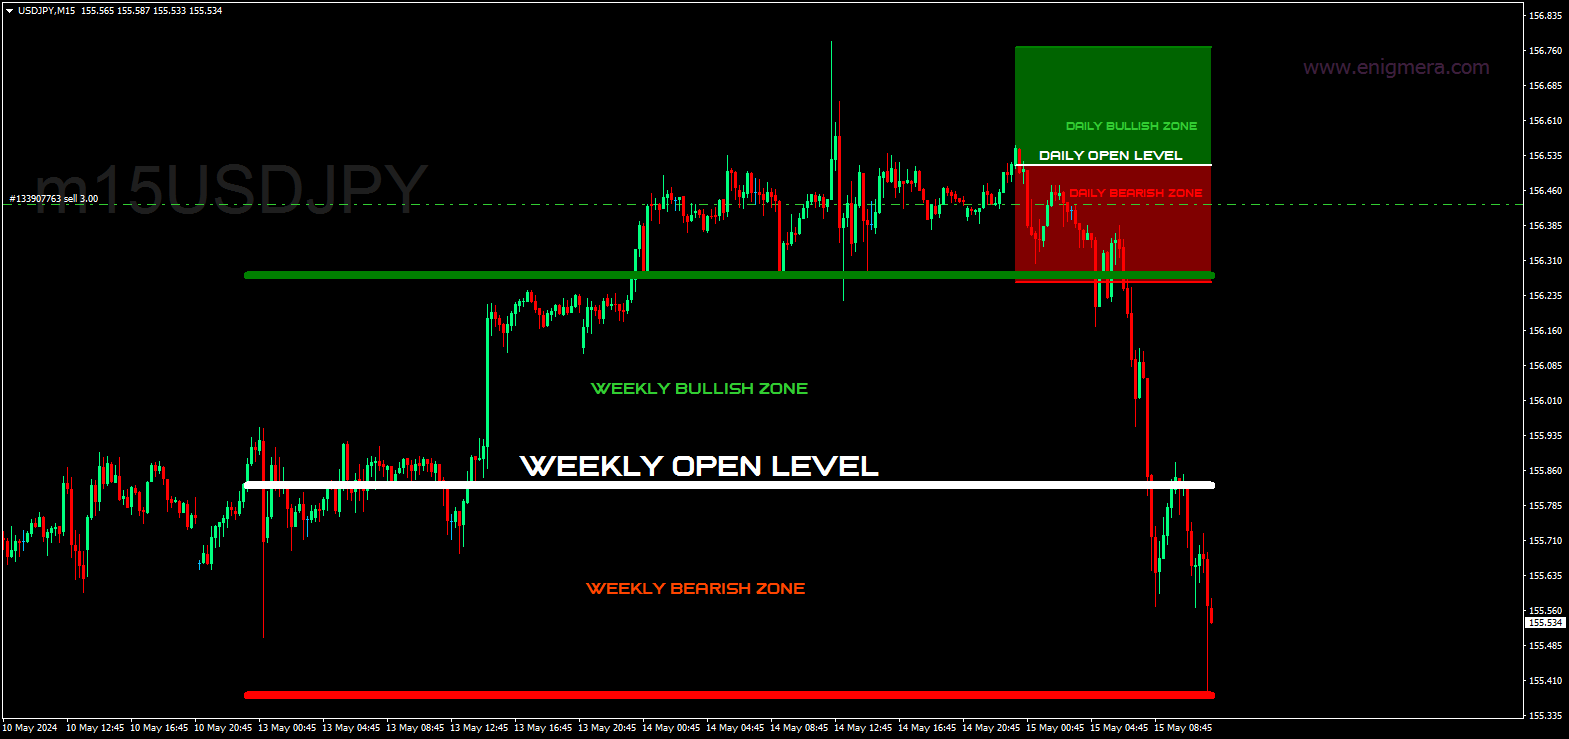
레벨스 지표가 표시됩니다:
- 일일 강세 및 약세 영역. 매일 00:00~23:59에 표시됩니다.
- 주간 강세 및 약세 영역. 매주 월요일 0:00부터 금요일 23:59까지 표시됩니다.
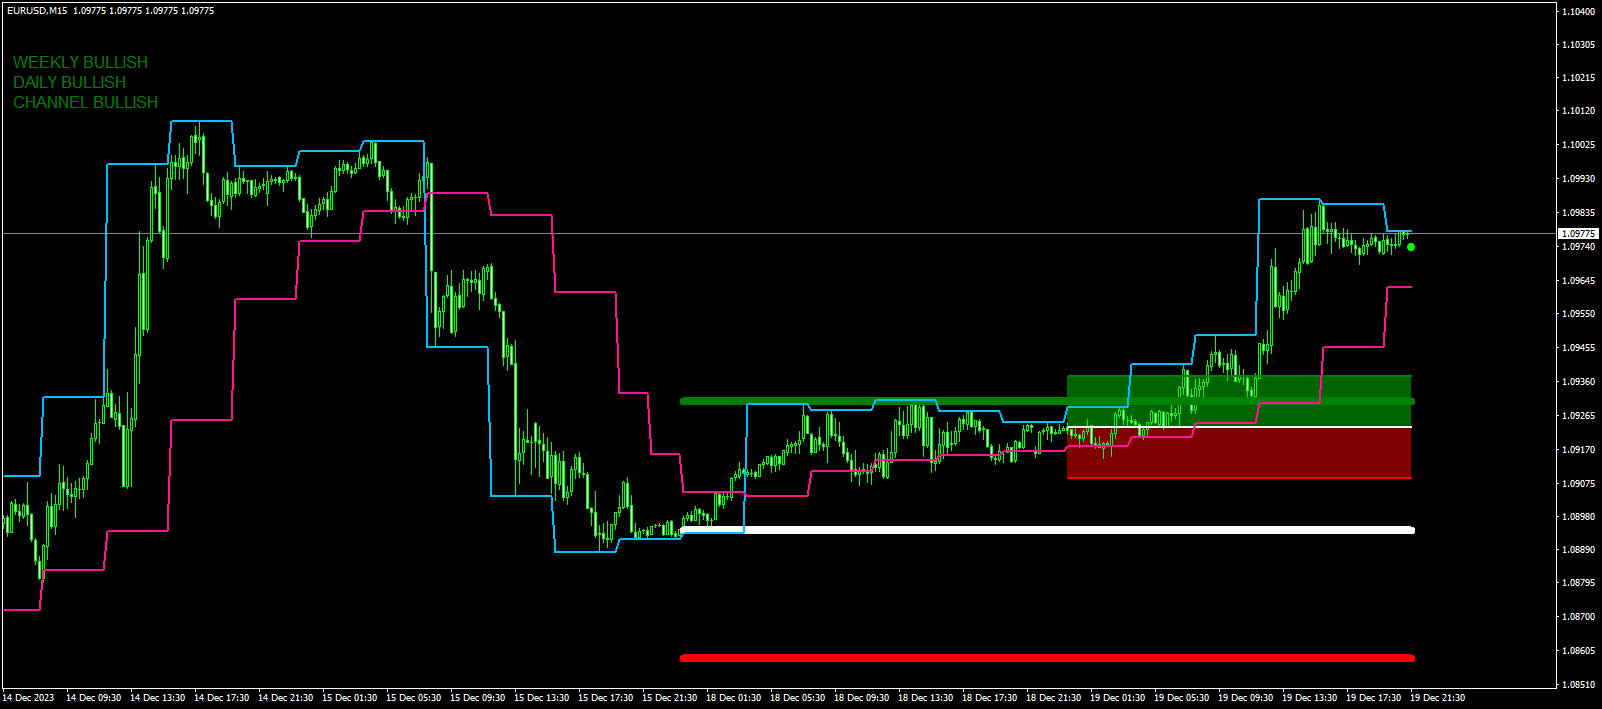
- 특정 시간대에서 특별히 계산된 채널로 다른 모든 시간대에 표시됩니다. 기본적으로 4시간 주기로 표시되며 거래하고자 하는 다른 주기로 변경할 수 있습니다. 논스톱으로 계산됩니다.
화면 왼쪽 상단에는 강세, 약세 또는 중립 영역과 채널이 표시됩니다. 세 가지가 모두 강세인 경우 현재 캔들에 녹색 점이 나타납니다. 세 개가 모두 약세인 경우 분홍색 점이 나타납니다.
인디케이터에는 제한이 없습니다.
레벨스 지표가 표시됩니다:
- 일일 강세 및 약세 영역. 매일 00:00~23:59에 표시됩니다.
- 주간 강세 및 약세 영역. 매주 월요일 0:00부터 금요일 23:59까지 표시됩니다.
- 특정 시간대에서 특별히 계산된 채널로 다른 모든 시간대에 표시됩니다. 기본적으로 4시간 주기로 표시되며 거래하고자 하는 다른 주기로 변경할 수 있습니다. 논스톱으로 계산됩니다.
화면 왼쪽 상단에는 강세, 약세 또는 중립 영역과 채널이 표시됩니다. 세 가지가 모두 강세인 경우 현재 캔들에 녹색 점이 나타납니다. 세 개가 모두 약세인 경우 분홍색 점이 나타납니다.
인디케이터에는 제한이 없습니다.